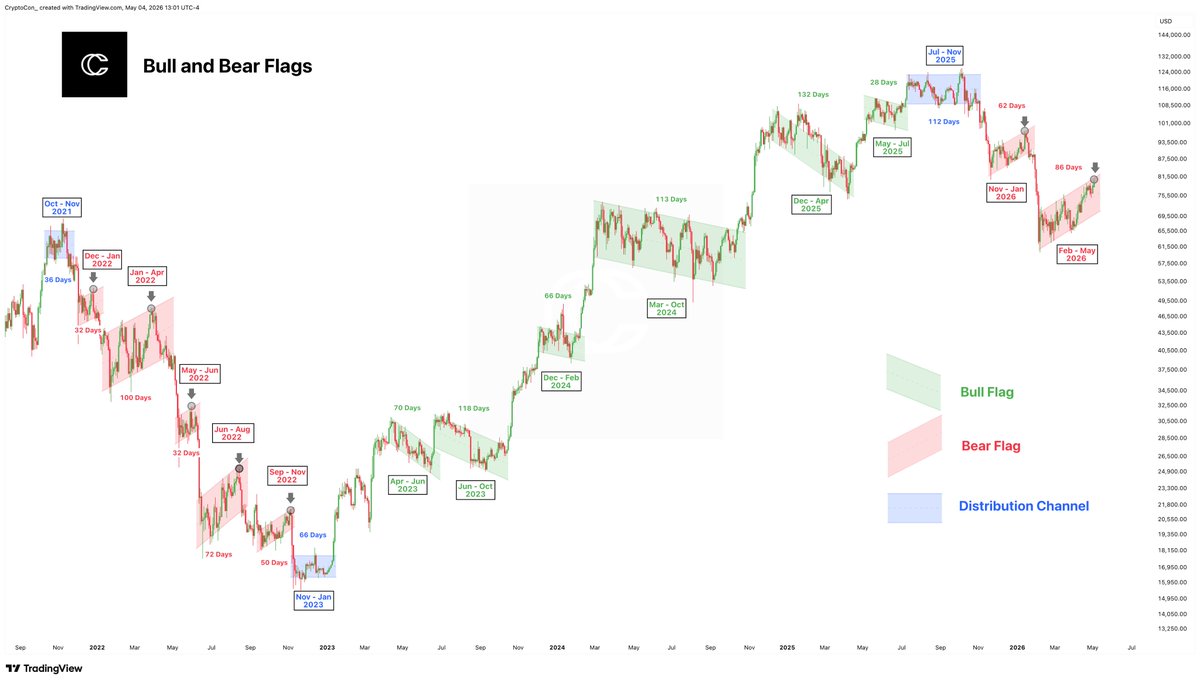
The predominant pattern here is still very much a bear flag, and now Bitcoin is at the top of the channel, the point where people start to question whether the bottom is in.
Some quick stats:
Current bear flag time: 86 Days
Longest bear flag time (since Nov 2021): 100 Days
Total bear flags: 7
It's typical to see these flags finally break to the downside after the second major retest of the top of the channel, which is happening now.
🚨 S&P 500 IS WALKING STRAIGHT INTO A WYCKOFF TRAP
This is one of the oldest market structure models in history. And right now the S&P 500 is playing it out perfectly
Preliminary Supply. Buying Climax. Upthrust. Post-Distribution
Every phase has printed exactly where the model predicted
We are now entering the Weakness phase - and if the structure holds, the target sits at 4,180
The market just hit new all-time highs while oil is above $120 and geopolitical risk is at decade highs
That's not strength. That's the last trap before the drop
NOTIFS ON!
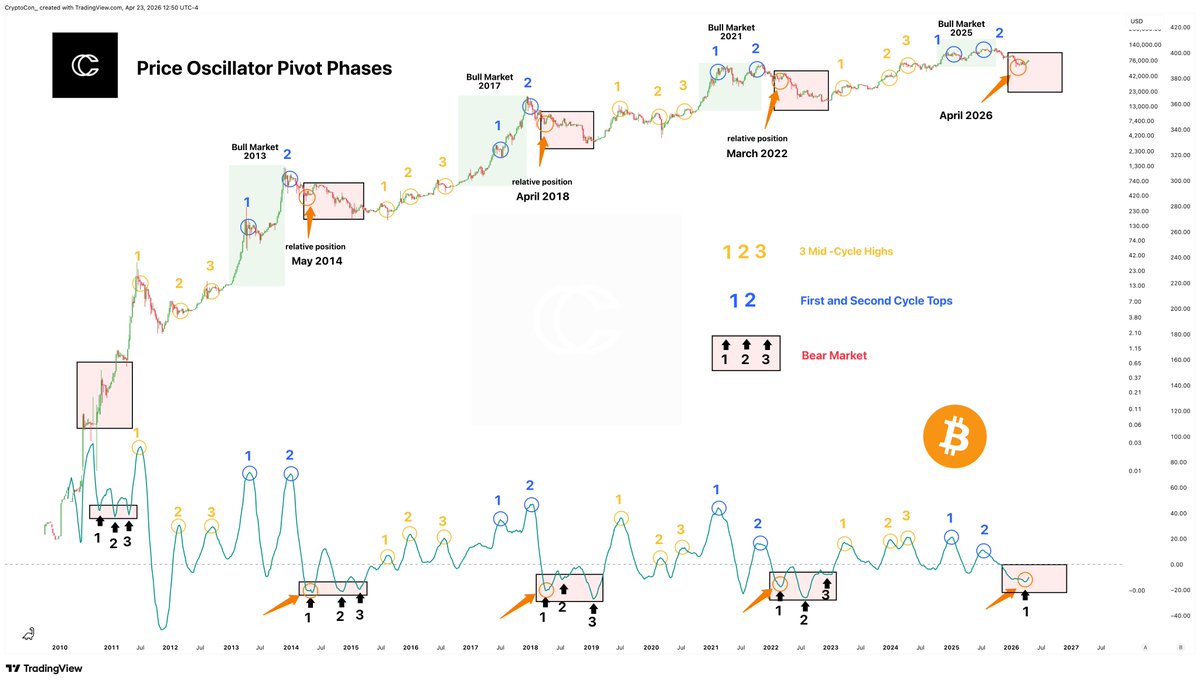
Bitcoin's first pivot of the bear market on the Price Oscillator has been dragging, but it looks like it's finally trying to lock in.
This is the first of three, with the third being the cycle bottom.
Time frame is still spot on. Other pivots were May 2014, April 2018 and March 2022.
A Bear Market Update
The cycle 4 bear market has now taken the lead as the "least worst" bear market so far, at - 41% from ATHs.
Still though, price action remains very close to other cycles.
The unification zone (where all previous bear markets align) runs from June to September. Following this zone would put Bitcoin at about 45k in June, with a gradual decline to 35k.
Other cycles would have a final drop to even lower prices for the cycle bottom.
Again, I do not think it is guaranteed that all bear markets will be "less worse" than the ones before them going forward.
🚨 BIG STORM IS COMING!
The fake recovery I talked about earlier is ending, and Bitcoin is slowly shifting toward its capitulation phase:
$126K → $81K → $97K → $62K → $75K → $43K
THE FINAL DROP IS STILL AHEAD — BE CAREFUL AND PREPARE YOUR POSITIONS IN ADVANCE
THE NEXT 60 DAYS $BTC WILL SHOCK YOU!
EVERYTHING IS GOING ACCORDING TO MY PLAN, DON’T WORRY.
TURN ON NOTIFS, FOLLOW & BOOKMARK!
Introducing... my cycles theory for Gold, which I am calling the "10/4 Cycles Theory".
It says that Gold operates around a 15 year cycle. The bull market takes 10 - 11 years, while the bear market takes 4 - 5 years.
In February of this year, the bull market would have ended, which begins the 4 - year bearish phase of the cycle, set to last until 2030 or 2031.
The cycles have incredible accuracy when viewed this way, with one interesting example of a failed bull market period between 1985 and 1996. You can see where the two cycle top events (red dots) landed and fell flat during that time in their appropriate places.
The cycle begins with one bottom event and is followed by two top events, which are the major points. These come during precise 1.5-year windows in the peaks and troughs of the sine wave cycle.
This is my latest major cycles theory to join the Halving Cycles Theory (Bitcoin) and the Quartercent Cycles Theory (S&P 500). All of which remain accurate to the current date.
For the 10/4 Theory to be successful in the near term, the bull market must end by July 2027 at the latest, which is at the end of the 10 - 11 year window. It seems highly probable, though, that February 2026 fulfilled this.
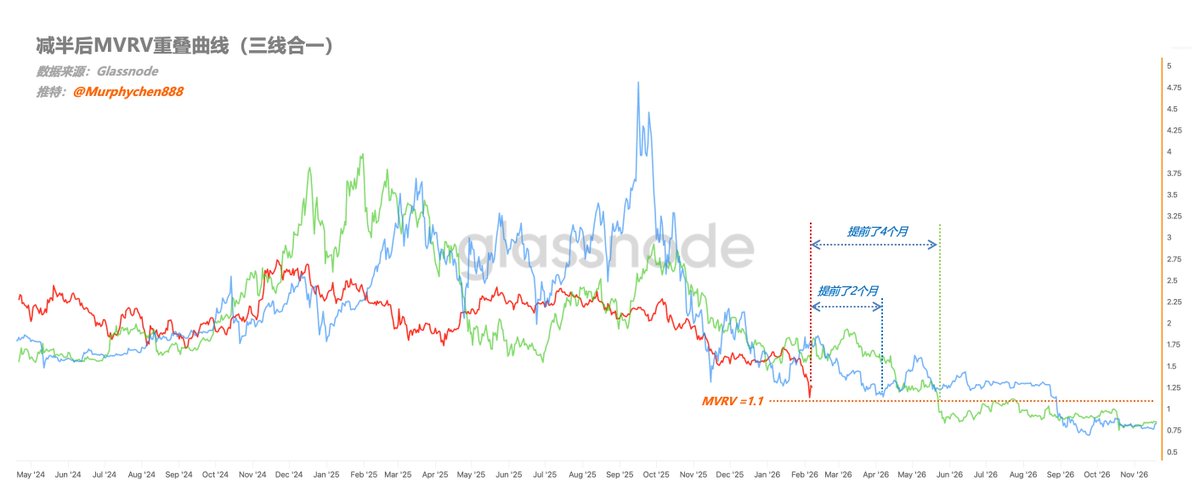
Divergence on Monthly SMIO is playing out just as it should for the bear market
The point 1 threshold was crossed in February, now we wait for the regular bullish divergence to form point 2 (the cycle bottom)
Time estimation is 9 - 12 months from point 1, which is November 2026 - January 2027, the exact time frame for the cycle bottom of the Halving Cycles Theory.
Right on track!
🚨 WHAT TO EXPECT FROM BTC?
Even though I agree with the idea that patterns don’t guarantee a 100% outcome, there are things that actually WORK
And that is FLAGS/CHANNELS
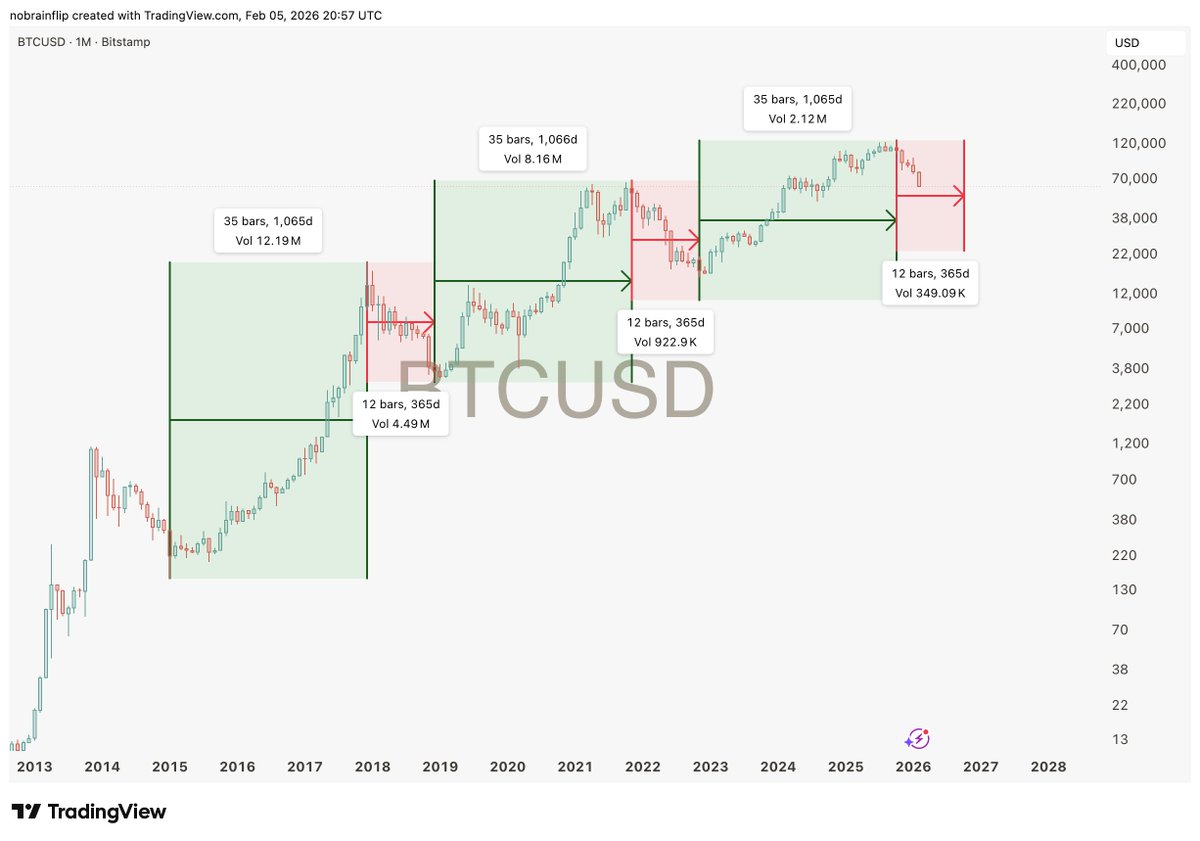
Take a look at the last 2 cycles
It was exactly flags/channels that handled perfectly what to expect next
For the past 2 months we’ve been in a classic bearish flag
This is our second flag in the current bearish cycle
For context, in 2022 there were 5 of them before reaching the bottom and final distribution
I think it’s obvious that we’re going to keep dropping
But keep in mind, flags are tricky - inside them price often moves opposite to expectations
A recent example is that rally when everyone was shouting about $80k
You see the result? - we’re going lower and lower again
Turn on notifications so you don’t miss UPDATES!
🚨 BTC CYCLICAL FRACTAL
The math is getting scary accurate
Every 17 monthly bars, the cycle shifts
- 517 days of accumulation
- 518 days of vertical expansion
THIS IS JUST REALITY
TURN ON NOTIFICATIONS!
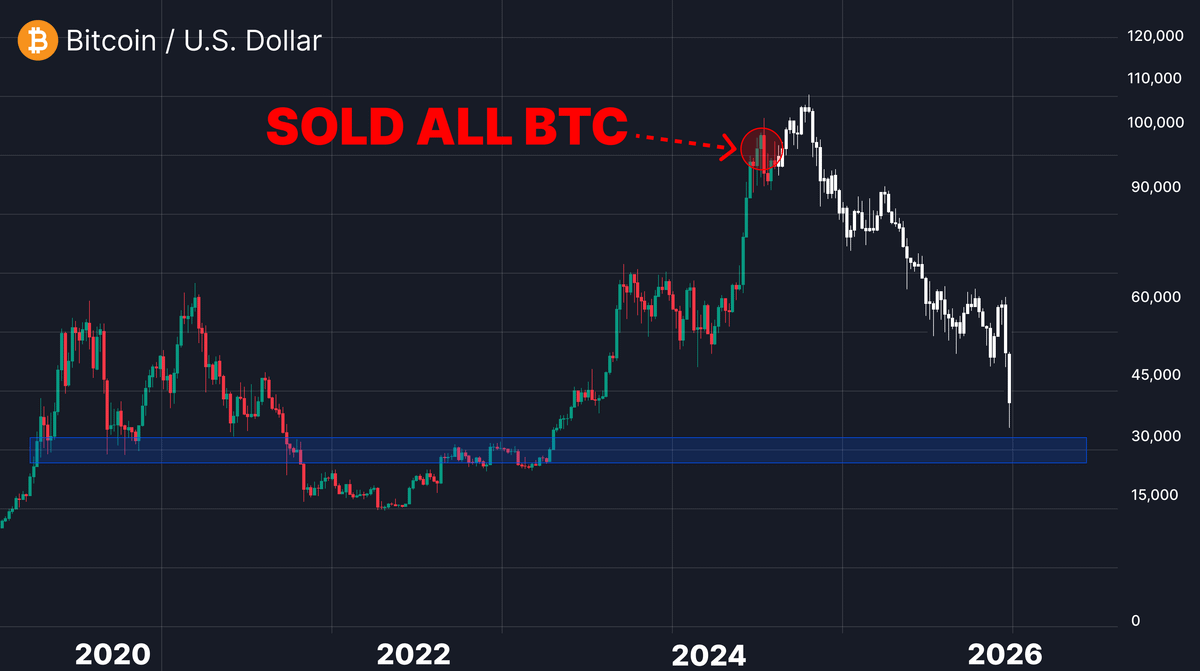
SOLD ALL my $BTC at $101.1k
Story from FTX crash to life-change is OVER
$28k – the next level where I’ll buy $BTC
Don’t buy Bitcoin until you read this 🧵👇
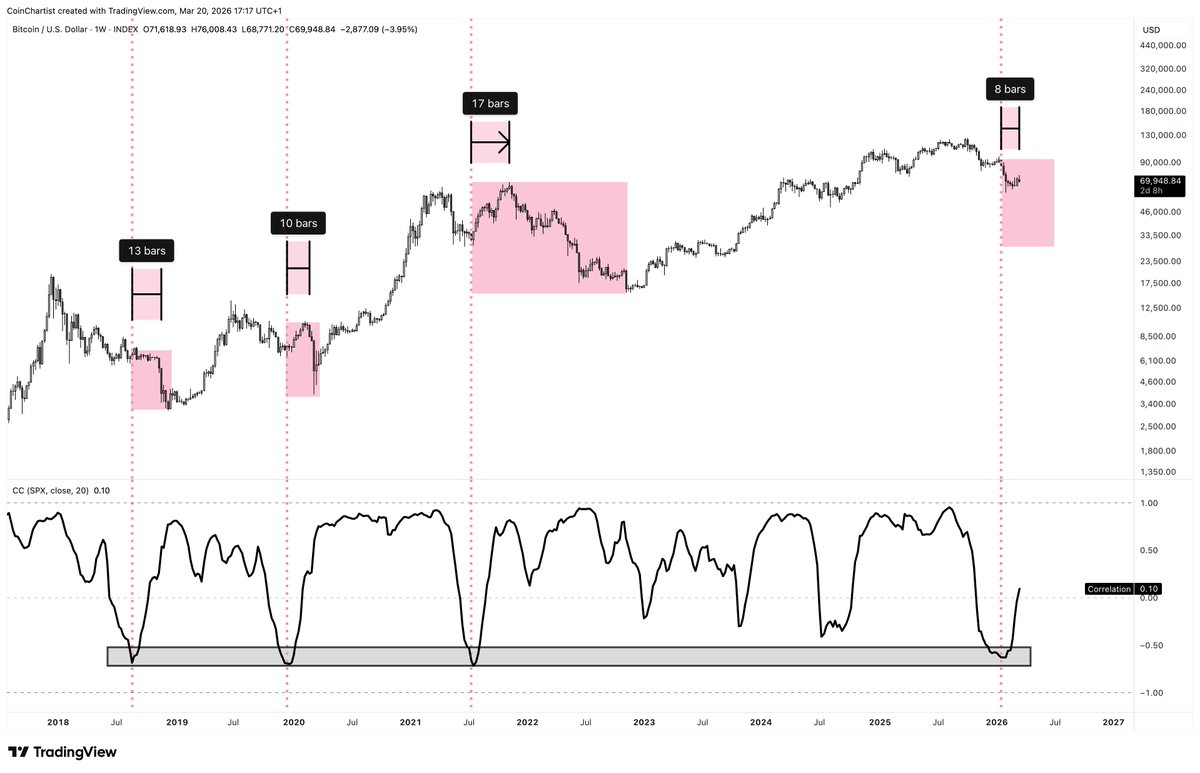
Observation
Historically, when Bitcoin's correlation with the S&P 500 drops to -0.5 on the Correlation Coefficient, and then turns sharply up, it is a warning sign that the stock market is going to collapse and take BTC with it
Usually there's a bounce first to add to the pain
I have perfectly predicted this pump.
Now Bitcoin follows a descending channel pattern.
$126K → $86K → $97K → $51K → $62K (fakeout).
Remember, I was the only one publicly calling the exact bottom at $16,000 three years ago and the top at $126,000 in October.
If you missed those calls, don’t worry. I’ll call the next one too.
Turn notifications on. If you’re not following yet, you’ll understand why that was a mistake later.
🚨 READ THIS CAREFULLY
Bitcoin’s next cycle bottom won’t be where you think.
The part most people ignore:
Timing.
Days from market cycle top → bottom:
2012: 405 days
2016: 362 days
2020: 376 days
We haven’t reached that timing zone yet in this cycle.
Purely on historical timing, the highest-probability window for the real bottom is July–November 2026.
That matters more than any single number on your chart.
Most traders only operate on price:
“I’ll buy at X.”
But the zone that feels “safe” is usually the zone where people do nothing.
I don���t play that game.
Below $50,000 I’m a buyer. Regardless of when it happens.
July–November 2026 I’m a buyer. Regardless of price.
If either condition is met, I buy. No hesitation.
Yes, I started accumulating as soon as we entered the $60k range last month, even though the timing window isn’t here yet.
Back in October, when Bitcoin was around $120,000, I said I’d be a strong buyer near $60k.
People laughed. Sentiment was euphoric: “BTC will never see $100k again.”
Now we’re here.
There’s one more thing most people keep ignoring: NUPL.
Every generational bottom: 2018, COVID, 2022, happened when NUPL entered the blue zone.
We’re not there yet.
For the record, I was the only one publicly calling the exact bottom at $16,000 three years ago and the top at $126,000 in October.
If you missed those calls, don’t worry. I’ll call the next one too.
Turn notifications on. If you’re not following yet, you’ll understand why that was a mistake later.
Well, that couldn't have gone better!
First Low Band of the Bear Bands achieved (63k) in the expected time frame (January - March 2026).
The heavy liquidity just above was also completely cleared (69 - 74k).
Next points of interest are the second low band at 44k (August - October 2026) and the cycle bottom band at 28k (November 2026 - January 2027).
The most likely low for BTC is October 2026, based on the 4 year cycle.
Under some circumstances it could happen as early as May.
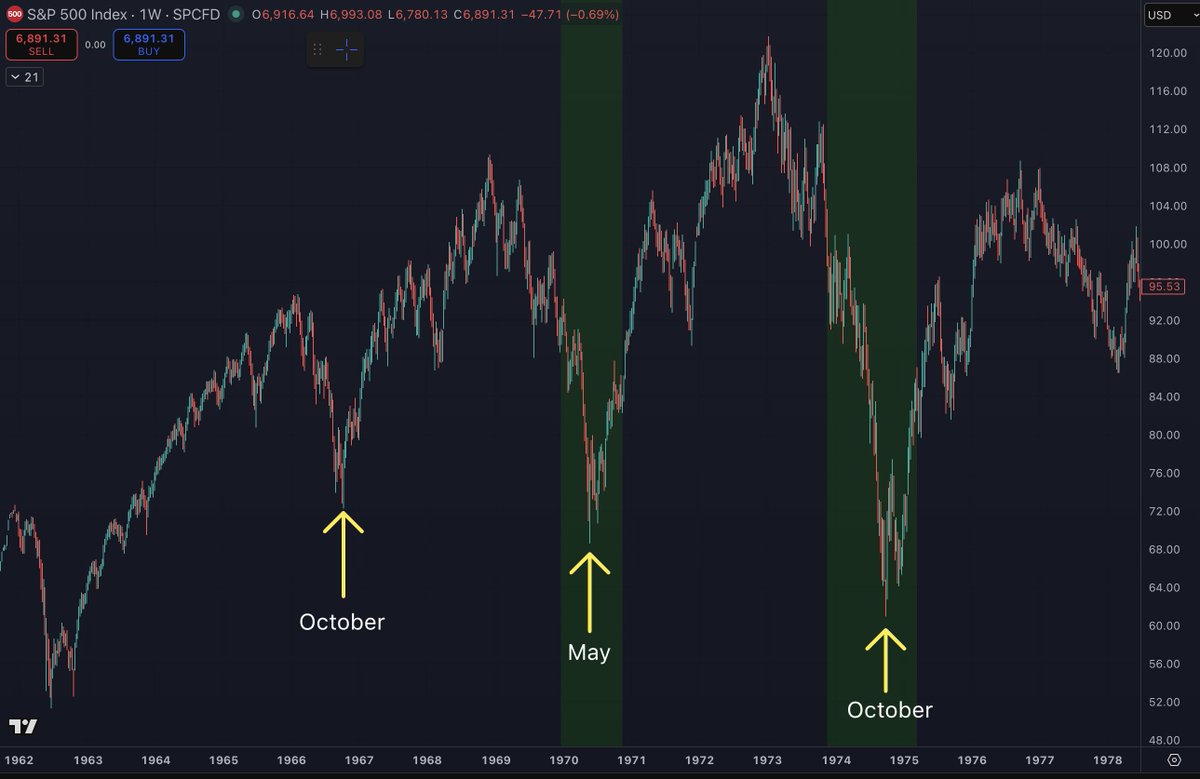
BTC does not have a monopoly on the four-year cycle.
You can that the S&P 500 has gone through many periods where it bottoms approximately every 4 years.
Major lows tends to occur in early Q4, but in some cases it occasionally happens in May.
October would be favored if we get multiple week-to-month long countertrend rallies that delay things.
May would be favored if the countertrend rallies just last a few days to a couple weeks, and deeper drawdowns occur sooner.
I favor October over May for now, but as an investor we have to be aware that markets can always evolve in ways we do not expect.
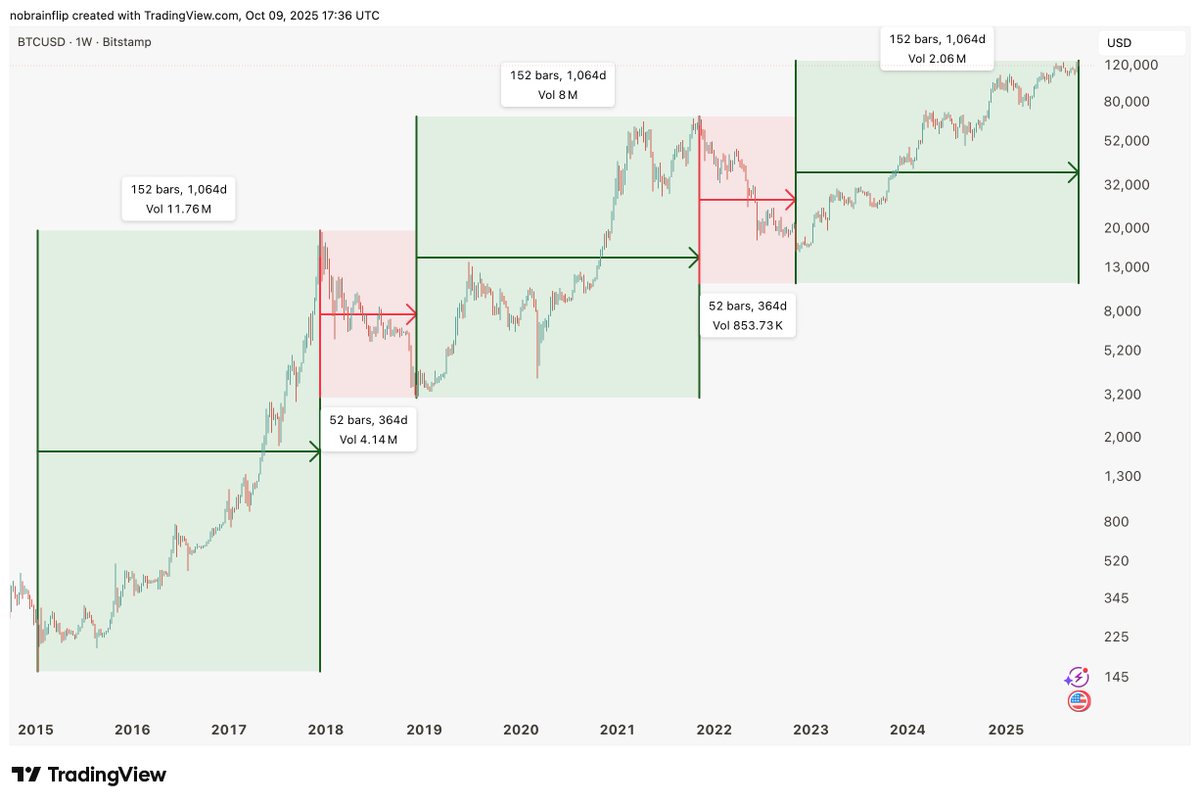
Every cycle is the same.
Yes, crypto could bounce. And honestly, it would be great for sentiment if it could. But even if it does, it would most likely result in a macro lower high.
I don't try and time those bounces. I have tried before with mixed levels of success. Sometimes it works, other times I got rekt.
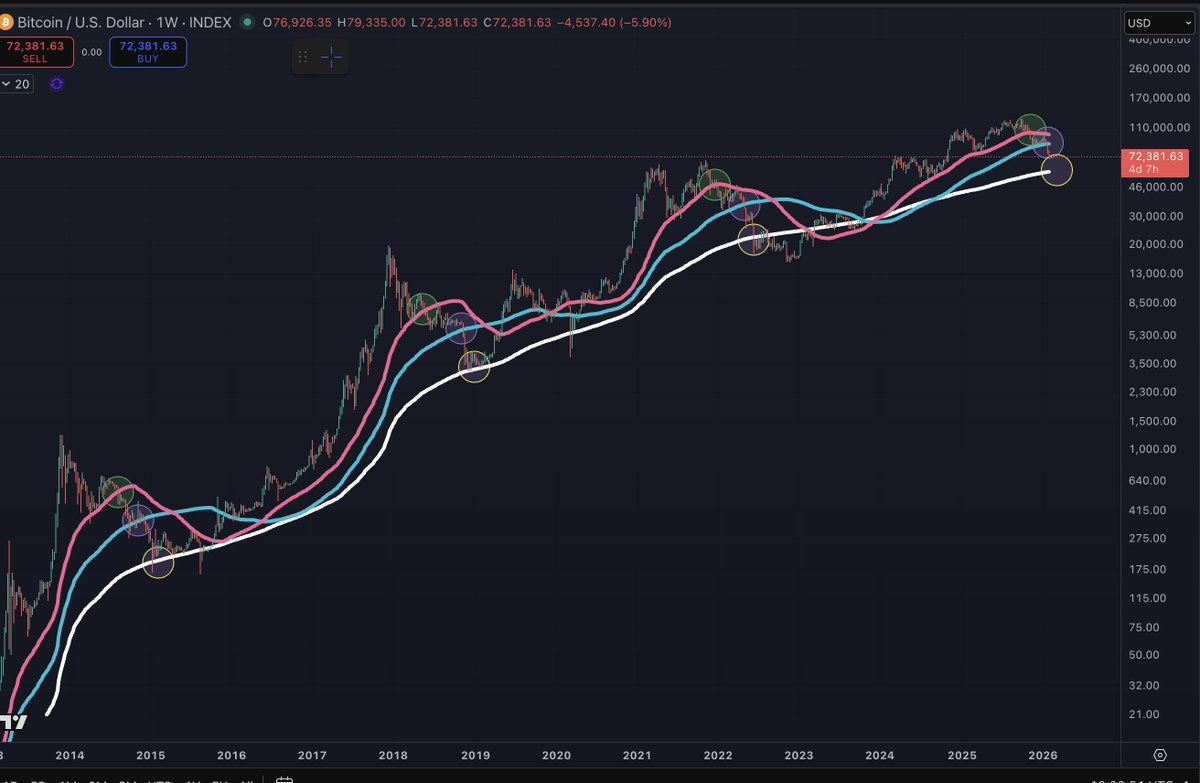
When BTC drops below the 50W moving average, it then goes to the 100W moving average, spends a little time there, then goes to the 200W moving average.
Every cycle is eventually the same.
BTC topped when it always does (Q4 of the post-halving year), and so many have spent so many hours trying to convince you that it has not.
And BTC entered into a bear market, and so many have tried to get you to believe that alt season is "just around the corner" because it always happens after BTC tops. What they fail to account for is social interest. After the 2019 top there was also no rotation into altcoins, which also occurred just before QT ended.
I track the social interest in the asset class, and it has been trending down since 2021. There is no one new here for people to sell their altcoins to.
Alt seasons historically occur *after* social interest has been trending up for a year, not after it has been trending down for 5 years.
Have an actual plan on navigating this brutal asset class. Because if the altcoins you hold drop another 50%-80% from here, not a single influencer who promoted them will express an ounce of regret for it. And you will simply be living with the consequences.
I get a lot of hate for saying the truth, but an inconvenient truth is better than a lie.
5 months ago, I predicted the exact day the bull cycle will end, based on the cycles.
If the cycle structure holds and doesn’t break, we’ll keep dropping until October.
Estimated bottom: $24k-$35k.