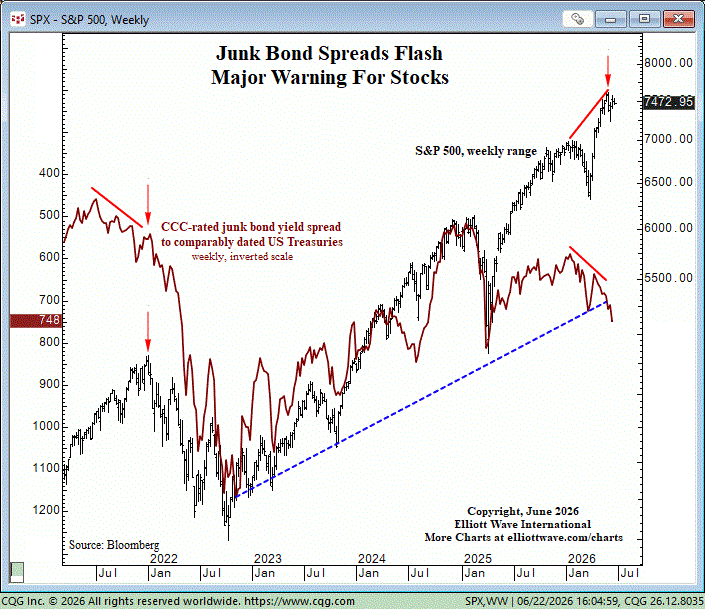
Junk bonds are flashing a warning signal.
While the S&P 500 pushes toward new highs, CCC-rated junk bond spreads are moving in the opposite direction.
When the trend between the two sectors diverge, it is almost always meaningful.
This is just one of several warning signs we're tracking. See more - free: https://t.co/AgZ2eyc9GY
"As worldwide stock prices trickled lower in March, worldwide bond markets screeched to a veritable halt... By March 23, the seizure in the bond markets was fully reflected in Bloomberg’s Pan-European High Yield Index, which tracks an assortment of junk bonds denominated in six European currencies. After seven months of lethargic trading, yields suddenly spiked to an 11-month high." - European Financial Forecast, April 2
Get forecasts inside the just-published issue: https://t.co/UwHB5mAPVQ
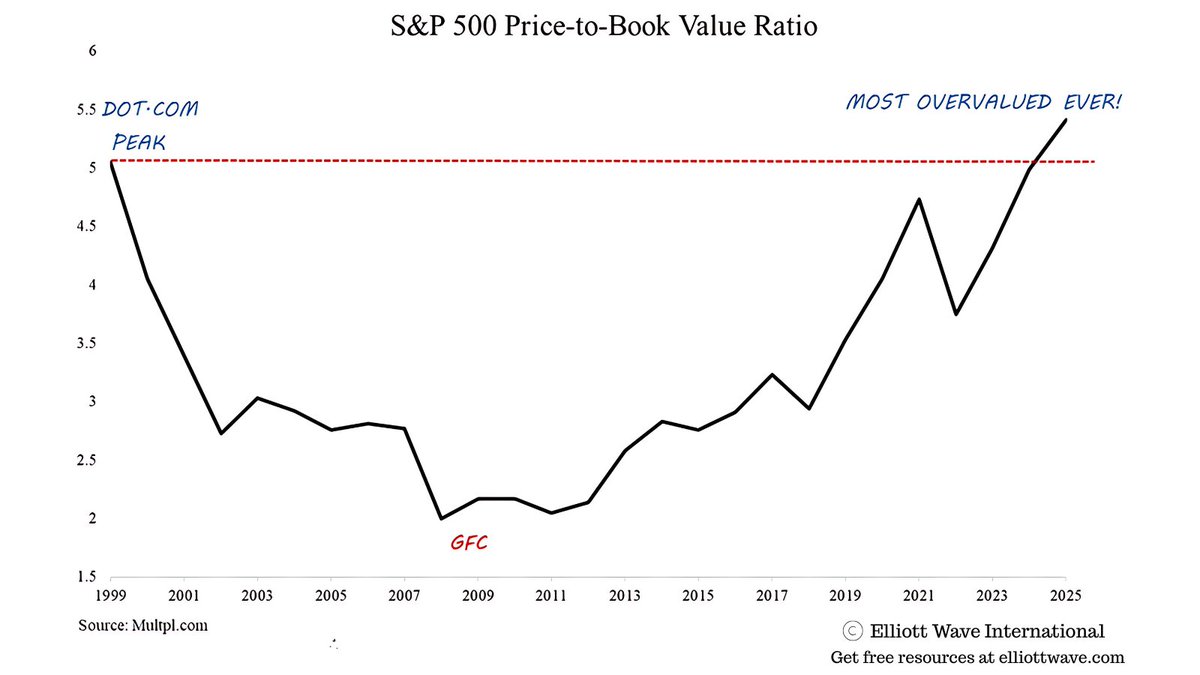
🚨 YOU ARE HERE → at record extremes in stock market valuation.
This chart is just 1 of 18 flashing-red signals revealed in our new report.
Read it now - FREE: https://t.co/Gnq6tjuJ1Z
🚨 Stocks Market More Overvalued Than 1929!
This chart shows the S&P 500 price-to-book value ratio at all-time highs, now above the dot-com bubble peak. At 5.3, the average price of stock is 530% higher than what the average company is worth, based on its book value.
Studies from two sources suggest the book value in 1929 was somewhere between 420-523%.
Get free insights inside the #1 newsletter for Elliott Waves: https://t.co/IYdFEsVQDB
#StockMarket #stockmarketcrash #recession #SP500 #dotcombubble
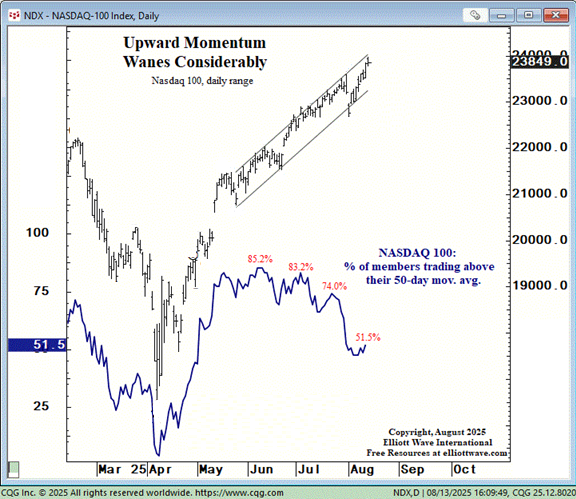
🚨 #Nasdaq keeps hitting record highs - but fewer stocks are joining the rally.
In early June, 85% of Nasdaq 100 members traded above their 50-day moving average. Today, it’s just 51.5%. That's the 4th-worst reading for an all-time high since data became available in 2001.
Could this signal a change of trend is ahead?
Get free insights when you join the #1 newsletter for Elliott waves: https://t.co/brWeGgj0Ua
#NDX #StockMarket #StockMarketRally #bullmarket
For a rundown of the kinds of things that happen when interest rates suddenly rise, look no farther than this chart. It tracks the economic chaos — recessions, bankruptcies, unemployment, corporate collapses — that cluster around significant spikes in Germany’s 10-year yield.
Get the full story, and more, in the August 2025 European Financial Forecast: https://t.co/rLWd8DlFyD
#Stocks #InterestRates #Europe #bonds #Bund #recession #economy #Elliottwave #TechnicalAnalysis
💥The Fed meeting came and went without any fireworks.
Want proof that the Fed doesn’t control interest rates? https://t.co/ioPhekjLX9
History shows that the T-bill market moves first – and the Fed follows.
#InterestRates#FederalReserve#FedMeeting#RateCut#Dovish#Hawkish #economy #Inflation
With the economy weakening and the 3.5-year cycle pointed higher into next year, this junk bond spread should shoot higher, which will reflect stress in the economy.
Get fresh Elliott wave insights! https://t.co/JjvT2qkNGV
#economy#recession#yieldspread#investing
SPX weekly chart, as you can see the downside move stopped at 200-weeks moving average, which holds this move up since January 2010, for the last 15 years. Breaking this support, means that wave (iii) topped and started correction as (iv) wave, which is my primary count now.
Insights from the just-published Elliott Wave Financial Forecast (subscribe here: https://t.co/MGAXvtdBmu):
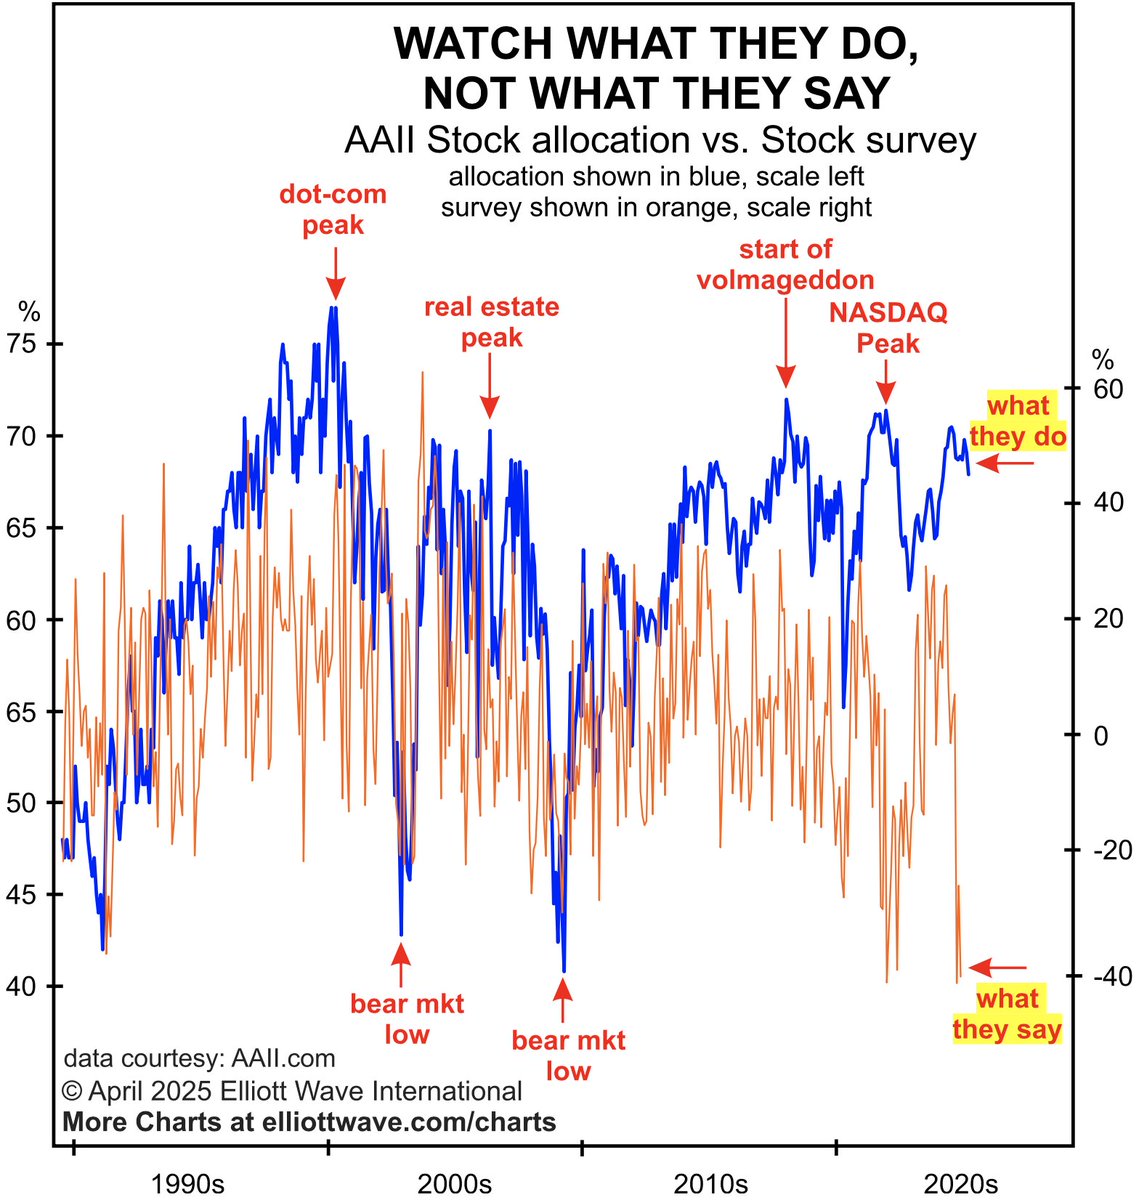
"The orange line on the chart shows that the AAII bull-bear opinion spread dropped to a low of -41.2% at the end of February, historically in “bear market low” territory. Yet the blue line, showing the percentage that AAII members allocate to stocks in their portfolios, reveals what they are doing. The percentage stands at 67.9% as of the end of February, which, as the chart shows, is a historically high level. At the bear market lows in October 2002 and March 2009, the percentage that members allocated to stocks was 42.8% and 40.8%, respectively. In October 1999, a similar set-up led to EWFF’s creation of the Commitment vs. Belief indicator, to 'measure investors’ actual investment against bullish expectations. Basically, it shows how willing individuals are today to ignore their own negative sentiments toward the market and stick to the buy-and-hold-no-matter-what philosophy.'"
#stocks #elliottwave #economy
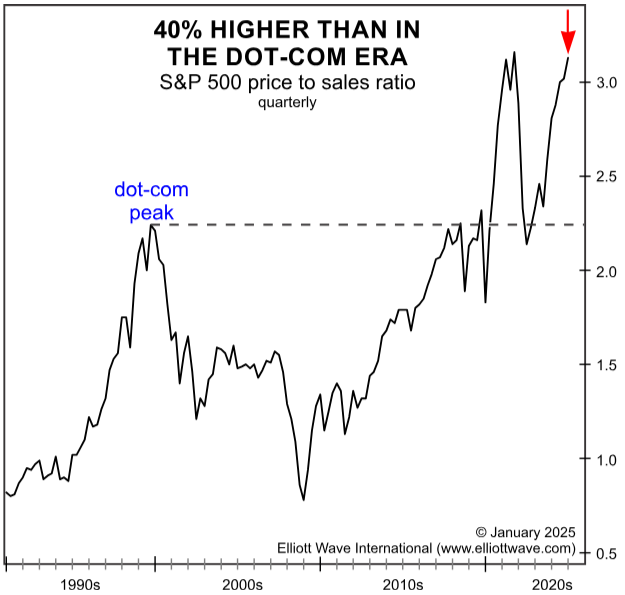
Most of us LOVE to buy stuff when it’s on sale. But our brains work differently when it comes to #stocks. From the February Financial Forecast:
"The chart shows that the S&P 500 price-to-sales ratio is 3.1, meaning that investors are willing to pay over $3 for every dollar of sales generated by the index’s companies. This is 40% higher than at the end of the dot-com boom in 2000."
See how the extreme stock market valuations impact your investments inside this excerpt from @RobertPrechter's Theorist: https://t.co/zn79UXrtw6
#Elliottwave #stockmarket #SPX #investing #investingtips
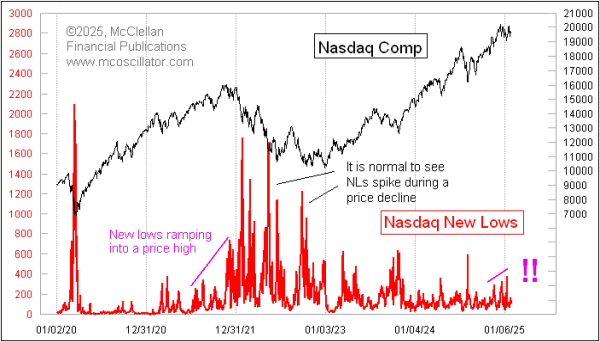
My latest Chart In Focus article, "Rising New Lows In The Nasdaq", is posted at our Home page. Direct link to follow. Please read the article before making any conclusions about the chart.