Sometimes I want to give up on my COVID precautions, but then I realize what I REALLY want is for COVID to disappear. But taking my mask off and returning to “normal” won’t accomplish that, as much as others like to pretend. So I accept the facts, feel my grief, and keep going 😷
PMC COVID-19 Forecasting Model, Oct 21, 2024
🧵1 of 4
Every indication is that the 10th U.S. Covid wave is on the way. Within 2 weeks, expect transmission to be meaningfully higher.
Current estimates from PMC:
🔹1 in 115 actively infectious
🔹Higher transmission than during 43% of the pandemic
🔹Nearly 3 million weekly infections
These estimates are high in the absolute sense, but low relative to the recent summer wave and likely winter surge.
The CDC data show transmission increasing in the Northeast, and a slowing of the decline in transmission elsewhere. Biobot data also show flattening transmission. The raw CDC and Biobot wastewater data are delayed >1 week. Walgreens shows positive cases, testing, and positivity ratios flattening and is delayed only 1 day.
For those unfamiliar with the model, find full weekly reports for the past 14+ months at https://t.co/xmDnq5OkYl
The models combine data from IHME, Biobot, and CDC to use wastewater to estimate case levels (r = .93 to .96) and forecast levels the next month based on typical (median) levels for that date and recent patterns of changes in transmission the past 4 weeks.
Our work has been cited in top scientific journals and media outlets, which are fully sourced in a detailed technical appendix at https://t.co/rO6J6BMNtH
Examples include JAMA Onc, JAMA-NO, BMC Public Health, Time, People, TODAY, the Washington Post, the Institute for New Economic Thinking, Salon, Forbes, the New Republic, Fox, CBS, and NBC. See pgs 10-11 at the above link.
PMC COVID-19 Forecasting Model, Oct 14, 2024
During this "lull" between the 9th and 10th waves of Covid in the U.S., about 1 in 111 people in the U.S. are estimated to be actively infectious with Covid.
#MaskUp#VaxUp 💉💪😷
The lull between waves is likely somewhere between now and the end of the month with transmission levels similar across these dates from a big-picture perspective.
Full Reports and Technical Appendix: https://t.co/uyO9QQmwm1
If you are new to our reports, here's some background I have posted previously.
Our case estimation model combines historical data from the current CDC contractor (Verily), former CDC contractor (Biobot), and multi-faceted case estimation model of the IHME to estimate transmission levels.
Across these three data sets, the intercorrelations range from r=.93 to .96. A correlation of r=1.00 is the maximum possible (perfect), so these correlations are remarkable given the differences in methodology (Verily/Biobot vs IHME) and regional coverage and processes (Verily vs Biobot). It's wise scientists doing fundamental work reaching the standards of excellence. Many correlations in the diagnostic testing literature, for example, are considerably lower, often in the range of r=.40 to .60, so wastewater scientists and other modelers are really doing tremendous work. https://t.co/XK1qjjGeMZ
Working with 3 data sets to develop a composite indicator of transmission also allows us to convert between one metric and another. On the left side of the graph, you'll see what we get if we convert the composite to the metric used on the CDC website. One the right, you'll find the more meaningful metric of the IHME-base estimate of daily infections. These models are based on hundreds of hours of work by our team as well as the teams contributing the underlying data. You can read more about the reports on our website, where you'll find hundreds of pages of reports over the past 14 months: https://t.co/xmDnq5OkYl
The specifics of the model have varied marginally over time, and we also keep a running methodologic appendix: https://t.co/rO6J6BMNtH
You can also read my bio, which includes advanced degrees in behavioral science, medical research, and analytic modeling: https://t.co/CYz5IB4n4C
The model has been cited in peer-reviewed medical journals as well as by many news outlets:
•JAMA Oncology: https://t.co/2Ak6qvDmMi
• BMC Public Health: https://t.co/fFiWPf9Jho
• TODAY:
https://t.co/ALoIj4myg8
• Forbes: https://t.co/RXv7hZwjd4
• Salon:
https://t.co/mLiOZP3tzg
• The New Republic: https://t.co/IEiwbvO74r
• Yahoo! News:
https://t.co/4QmXDa7m7R
• Washington Post: https://t.co/sLj9Bu3zG4
• Time:
https://t.co/HDOE3xAqaN
• Stateline: https://t.co/CdStrdB0qM
• PRISM:
https://t.co/gT1kVnzwwz
• SELF Magazine:
https://t.co/3LhOPow2FK
• TODAY: https://t.co/zD10YVgC6S
• Institute for New Economic Thinking: https://t.co/jmsDaOqpBe
• TODAY: https://t.co/H1X68lCmo9
• NEWSMAX:
https://t.co/etLg6rD3eb
• Yahoo! News: https://t.co/6hH3CNFCWS
• People:
https://t.co/JI7KMCjHWL
• Truthout:
https://t.co/uPamaishEW
• San Francisco Chronicle: https://t.co/JuOQ1ntbKT
• JAMA-NO: https://t.co/NHtK0nljqw
• MSN:
https://t.co/gxRFVDTvn6
• PRISM: https://t.co/FWHmbfs76l
• CBS:
https://t.co/p4ObsCgra1
• NBC:
https://t.co/fNSFkEVRhT
• FOX: https://t.co/5cmmm6Ndk9
• OBR Oncology: https://t.co/RFl3X4lgz0
im not even done but i absolutely adore this piece of work. i was also happy to see black transfeminism, not just as a buzzword, but with genuine explorations of how black trans women and transfems have stood their ground and formed online networks to help each other
Friends on the west coast of Florida
Get ready for a strong hurricane by Wednesday!
Have a plan for accessible evacuation
Take photos of your property before #Milton
Tell friends
Disability & Disaster Hotline 800-626-4959 (call/text) hablamos español
#HurricaneMilton
The pearl clutching about “looting” during a natural disaster is so cruel and nonsensical. Most of that food is getting thrown out. Half that shit will bring ruined. In a society that wasn’t morally bankrupt it would be legal esp since insurance will cover the loss for corps
You are reading this Tweet during the pandemic.
Transmission is higher this time of year than during any prior September.
Many people have not had a vaccine in the past year and are not using other mitigation. Repeat-infection #LongCOVID should concern all.
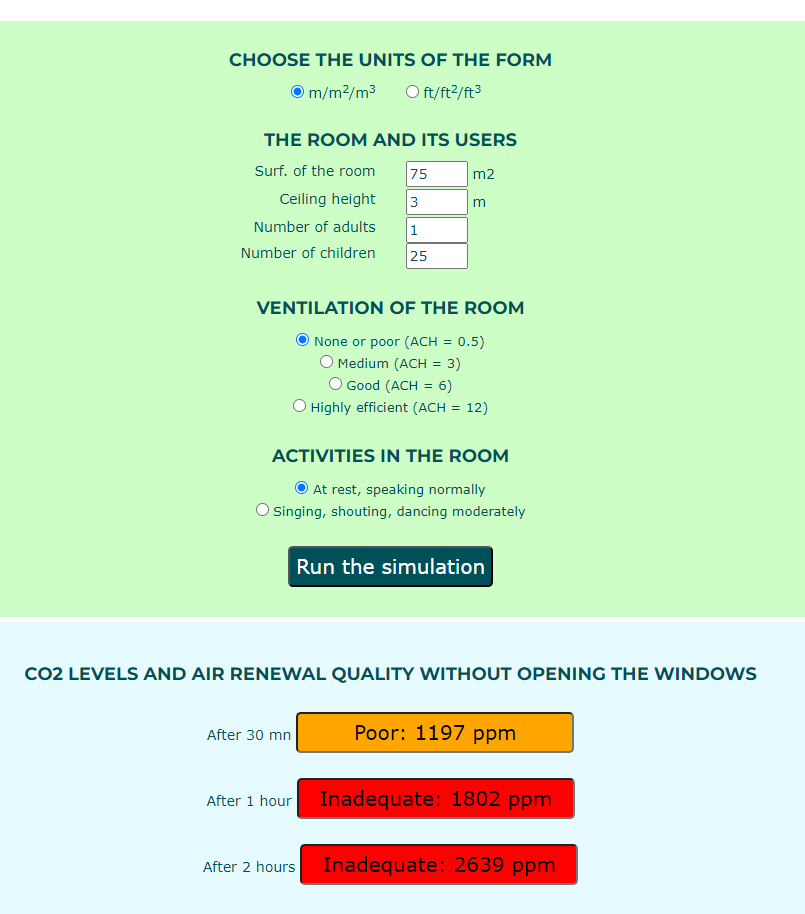
We remind you that you can simulate the quality of a room's air renewal using our simulator, which we've made as easy to use as possible. An advanced mode is also available. The simulator is available at
https://t.co/71LTuAA2PJ
Please stop saying we should wear masks "when appropriate."
COVID surges throughout the year, and other viruses, pollution, wildfire smoke etc. are also significant health issues.
It is ALWAYS appropriate to wear a mask.
NIH has announced it will be shutting down its COVID-19 treatment guidelines website for special populations on August 16 😲 so LCAP has archived all of the PDFs (including each special populations section) for public use 😎 https://t.co/e3sIioHRRD
P.S. this is not ok @NIH
Some people compare the immune system to a muscle that gets stronger with use. Yet some infections leave lasting harm. Viruses are increasingly linked with multiple sclerosis, Alzheimer's, type 1 diabetes, cancer, & more...
My new post: https://t.co/7DwOVexIYU 2/
BREAKING: Version 2.0 of the PMC COVID-19 Forecasting Model, August 12, 2024
🧵1/7
The U.S. now tops 1.3 million daily infections. 2.8% of the population (1 in 36) are actively infectious.
https://t.co/jNhNBzP8kR
Deep Dive on Version 2.0 of the Model...
Welcome to version 2.0 of the PMC Model. The “C” in PMC is for Collaborative, and the work to improve this model is grounded in feedback from readers like you over the past year. Thank you for your support.
What’s New?
In short, the new model has substantial data quality improvements by combining multiple data sources for estimating transmission in unique ways that will hopefully increase forecasting accuracy, provide a truer representation of what has happened and is happening during the pandemic, and linkages to some statistics you will find helpful in day-to-day decision making.
Here is a deeper dive into the changes (skip to next section if desired). The new model is designed to provide a “true” picture of what has happened during the pandemic. It integrates three main data sources: the IHME true case estimation model, Biobot SARS-CoV-2 wastewater surveillance data, and the current CDC NWSS SARS-CoV-2 wastewater data. IHME provided a comprehensive case estimation model through April 1, 2023. Biobot was the CDC wastewater subcontractor through last fall and continues to do extensive non-CDC wastewater work. The CDC NWSS data are currently subcontracted with Verily, a subsidiary of Alphabet, which is the parent company of Google. Over the past year, we have seen Biobot scale back their public data and visualizations, and Verily has made steady improvements in their work with the CDC.
We previously relied solely on Biobot for forecasting and a Biobot-IHME data linkage for case estimation. It was a Biobot-heavy model. The current model is not tied strictly to any data set, but rather the PMC’s best estimate of the truth, a true-case model that uses multiple data sources in the spirit of IHME’s original work in this area. Essentially, we link all three data sources, which have been active over different points of the pandemic to derive a composite “PMC” indicator of true levels of transmission. The indicator is weighted based on which data sources were available and their perceived quality at each point in time. We scale this composite PMC indicator to the metric the CDC uses when helpful for comparisons with their website, and scale it with the true case estimates of the IHME otherwise, as true cases are more relevant than arbitrary wastewater metrics.
A great feature of the model is that it continues to integrate real-time data from Biobot and the CDC. From the perspective of Classical Test Theory, this is a huge advantage, as it provides a much more reliable indicator of what is currently happening with transmission. Both sources often make retroactive corrections for the most recent week’s data, sometimes sizable, and pitting the two indicators against one another reduces measurement error on average, which offers vital improvements in forecasting.
What are the Biggest Improvements in the Model?
· Accuracy in Real-Time Data – In integrating two active surveillance data sources, the real-time data will be more accurate. The biggest predictor of next week’s transmission levels, and the shape of how transmission is increasing or decreasing, accelerating or decelerating, is the current week’s real-time data. If the real-time data are off by 5% or 10%, the big-picture take on the forecast will still be reasonable, but a more precise estimate allows for greater accuracy in estimating the height and timing of waves.
· Regional Statistics – We are already integrating some regional data. Like you, we miss the vast and high-quality regional data and visualizations Biobot provided. We are hoping to take back some of those advantages through the new model and will improve them over time.
· Credibility – Although Biobot and CDC have unique strengths and limitations, a clear strength of adding the current CDC data set is that many people prefer to defer to the credibility of the CDC. The PMC model can be characterized fairly as a “CDC-derived case estimation and forecasting model,” which should lend more credence with those who are not deep enough in the weeds to evaluate the data as critically and prefer appeals to authority. We also provide some statistics that will allow you to draw more useful inferences from the CDC website.
What’s the Same in the Current Model?
The analytic assumptions underlying the forecasting model remain the same. It uses regression-based techniques common across all industries, using a combination of historic data (median levels of transmission for each day of the year) and emerging data from the past four weeks to characterize how transmission is growing or shrinking. Holidays and routine patterns of behavior that map on well to a calendar are “baked in” to the historic data. “New variants” and atypical patterns of behavior are baked into the data on recent patterns of transmission. It’s a top-down big picture model.
What are the Biggest Drawbacks of the New Model?
· Disruptions in Longitudinal Comparisons – You will notice some inconsistencies between the current and prior model that use additional data to form more accurate estimates, which is sometimes frustrating. A few examples. In the early pandemic, we estimated cases linking Biobot to IHME case estimates. Biobot transmission estimates were a bit “hotter” than others during that time period, the IHME estimates “cooler.” Our composite model depicts each of the first 4 waves somewhat smaller, which we believe provides a better picture of the “truth” as we can estimate it, but it is annoying psychologically to re-envision what has happened. This also throws off some of the big-picture statistics; for example, as of August 12, 2024, we estimate that Americans have had about 3.3 infections on average. A few months ago, we estimated nearly 3.5, so this is consistent with “cooler” picture of early-pandemic transmission. Presently, the CDC transmission estimates are running much hotter than those of Biobot, leading to estimates of a larger and earlier peak in the present wave. We would have preferred the CDC re-up with Biobot at the potential contract renewal to promote continuity in the data, but these sorts of changes in model estimation are the expected consequences of such a transition.
· Constantly-updating Historical Data – The CDC updates all of their historical estimates of transmission frequently, any time a new site comes on board, and twice annually to standardize the data longitudinally. This can sometimes create weird issues, where transmission is going up, but real-time values are lower than what was reported in real time the prior week because recent data were corrected downward. It will also throw off some of the helpful statistics we provide. These are minor nuisances, but be aware of them in case you spot something that seems strange.
· Documentation of Accuracy – We have excellent data on the accuracy of the prior model and will submit a report for publication shortly. All prior reports are publicly available. Many report quick facts on longitudinal accuracy, international comparisons, use in news articles, and references to use in peer-reviewed scientific journal articles. We cannot document the real-time accuracy of the new model yet, but know that when using historical data, the model accounts for 98% of the variability in wastewater transmission 1-week into the future, which is 2% higher than our prior model. The vast majority of forecasting errors have been and will continue to be based on inaccuracies in the real-time data wastewater surveillance companies report, and the model changes reduce those issues. We hope you will trust our history and that the methodologic changes represent improvements.
What Improvements Should We Expect in the Future?
There are many improvements we hope to roll out in the future. These include changes based on your feedback, the addition of confidence intervals in some of the graphs, and regional forecasting models. We may incorporate additional data sets if they can improve real-time estimates of current transmission.
if you're losing your mind about project 2025 but weren't losing your mind about the charges against the cop city protestors, i don't know if you are really plugged into what the whole fascism thing is or what it requires
You can find the full PMC COVID-19 dashboard and weekly report for Aug 2, 2024 online.
In the report, I have included a link to the PPT slides from yesterday's Space on the new JAMA-NO #KeepMasksInHealthcare article.
Report: https://t.co/xmDnq5OkYl
PMC COVID-19 Forecast, Aug 2, 2024 (U.S.)
Expect 2 more weeks of very high and stable transmission before the summer wave accelerates.
Currently at an estimated 850,000 daily infections, 1 in 56 Americans contagious, 43,000 resulting Long COVID cases/day.
Deep Dive:
Over the next two weeks, we should see very high and stable transmission, before transmission increases rapidly. Note that transmission estimates are down marginally – of no practical impact – relative to last week. One might be tempted to consider that the summer wave is subsiding. That might be a 5-10% probability.
This is where the model gets interesting. The forecasts are derived from a combination of recent patterns in transmission (levels, change, rate of change, rate of rate of change) as well as historical medians for that date. If only using the recent patterns, a decline in the wave would be reasonable.
However, the historic data capture all of that useful information on variation in human behavior (back to school, end of summer vacations, flights, Labor Day) that focusing only on recent patterns would miss. Because behavioral patterns also fuel viral evolution, these historical data also get, to some extent, at the idea of viral evolution of new variants, which we do not track directly in the model.
When considering the forecast, view it two ways. One, based on current trends and historic data, this is what we would expect. Two, if human behavior defied historic trends, we could see something much different, such as a wave subsiding if everyone were more cautious than average this year, or unfortunately something slightly worse than predicted due to the decline in public health guidance on mitigation.
According to the composite forecasting model, that means hovering between 700,000 to 1,050,000 infections/day over the next month. Transmission is very high, and we may reach a later-summer peak of 1.1-1.3 daily infections around September 11.
Although the forecast is for steady transmission over the next two weeks, the forecast is volatile due to quality issues with incoming data.
Schools, medical facilities, and businesses should now escalate precautions and prepare for the disruption of a high percentage of the population getting sick through the remainder of 2024.
How many people will you interact with this week? Here are the chances at least one of those people is infectious with Covid.
20 people? --> 1 in 3 chance
100-300 on an airplane? --> 85-99% chance
Wear a well-fitting high-quality mask (respirator) to avoid breathing virus.
3/