Apple's new glowing logo is getting wild praise, while Googlebook's actually-functional Glowbar has largely been panned. The double standard is more than a bit silly. https://t.co/PFC0XYCA1R
AI will disrupt residential real estate—here’s how
Speaking at ResiDay, Tomer Dorfan, Endpoint's VP of Revenue, discussed how AI is already impacting the real estate industry—and what comes next
The full session:
https://t.co/azoZet6ZNJ
Among the 400 largest metro area housing markets, these 7 have seen the biggest 12-month home price declines
Punta Gorda, FL -> -7.3%
Cape Coral, FL -> -5.5%
North Port, FL -> -5.3%
Lake Charles, LA -> -5.0%
Panama City, FL -> -3.7%
Houma, LA -> -3.6%
Austin, TX -> -3.5%
Among the 50 largest metro area housing markets, 13 have active inventory ABOVE pre-pandemic levels
Austin, TX
Memphis, TN
Orlando, FL
Tampa, FL
San Antonio, TX
Denver, CO
Nashville, TN
New Orleans, LA
Jacksonville, FL
Phoenix, AZ
Dallas, TX
Oklahoma City, OK
San Francisco, CA
How to build 3M extra homes in 4 years? Increase the supply of developed land. Land brokers in our survey say jurisdictional requirements and delays are the number one impediment to increasing developed lot supply.
The home insurance shock is real—just ask landlords
50% of single-family landlords say home insurance was their expense that increased the most over the past 12 months
Full results to the @Lending_One-ResiClub SFR Investor Survey:
https://t.co/WXAOasTGtj
CHART: 50 housing markets where home prices are down the most from peak
Major markets on the list 👇
-18.5% ---> Austin
-13.4% ---> New Orleans
-9.6% ---> Boise
-7.6% ---> Provo
-7.1% ---> San Francisco
-6.8% ---> Phoenix
Chart via @ResidentialClub
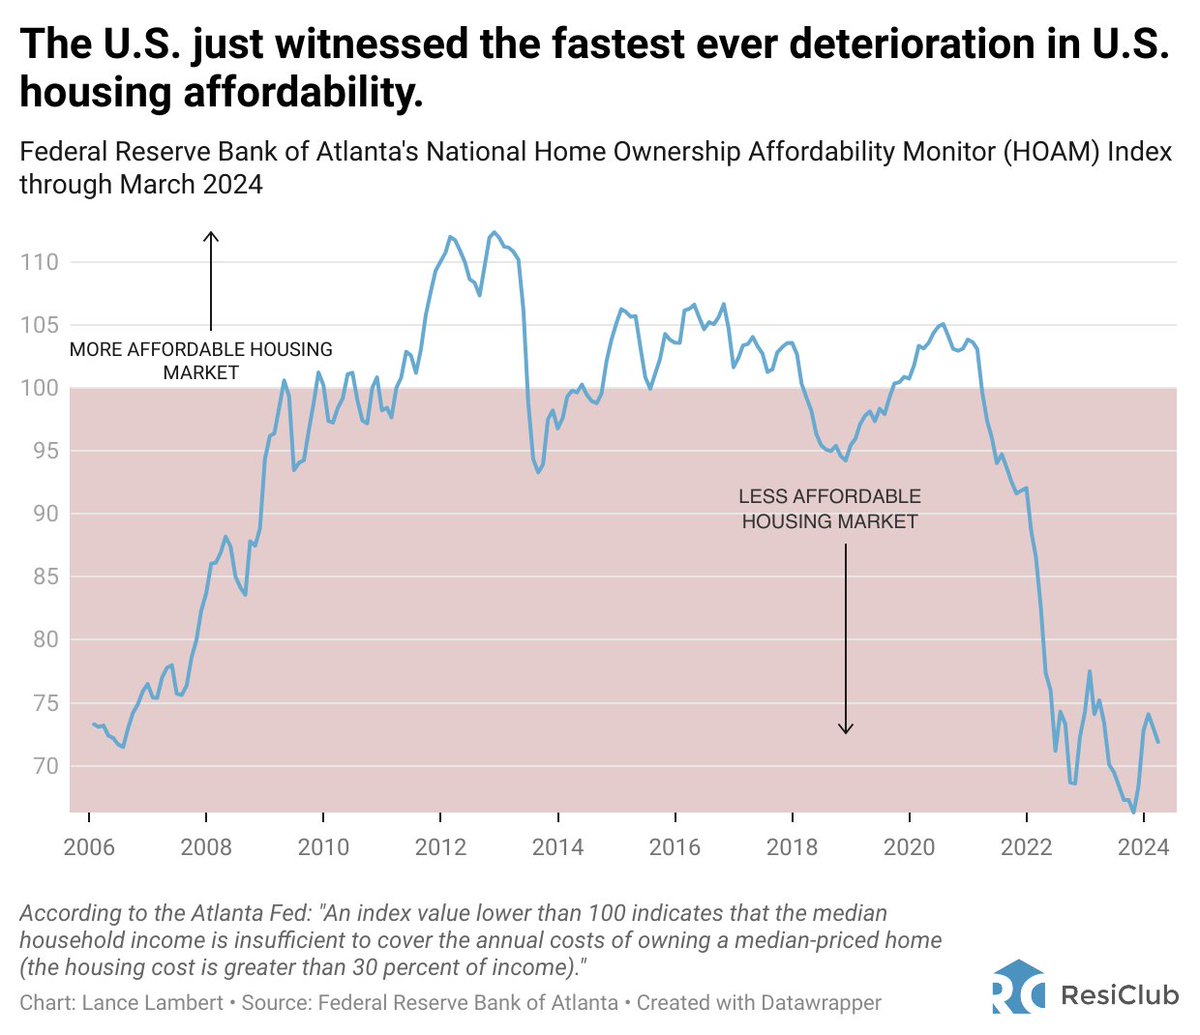
The U.S. just witnessed the fastest ever deterioration in housing affordability
That’ll happen when national home prices overheat, followed by a historic mortgage rate shock (3% to 7%)
Data via @AtlantaFed
Share of current mortgage borrowers with an interest rate at or below 5.00%:
77% - Silent Gen
79% - Baby boomers
80% - Gen X
80% - Millennials
52% - Gen Z
My latest for @ResidentialClub: https://t.co/RlcYFzijub
A GLOBAL PUNCH TO HOUSING AFFORDABILITY
Price overheating. Spiked rates. Incomes didn't keep up.
As of today, we AREN'T on a path to pre-pandemic housing affordability
--
IF U.S. incomes spiked 69%, we'd return to pre-pandemic housing affordability levels
IF U.S. home prices fell 41%, we'd return to pre-pandemic affordability.
IF U.S. mortgage rates fell 4 percentage points, we'd return to pre-pandemic affordability
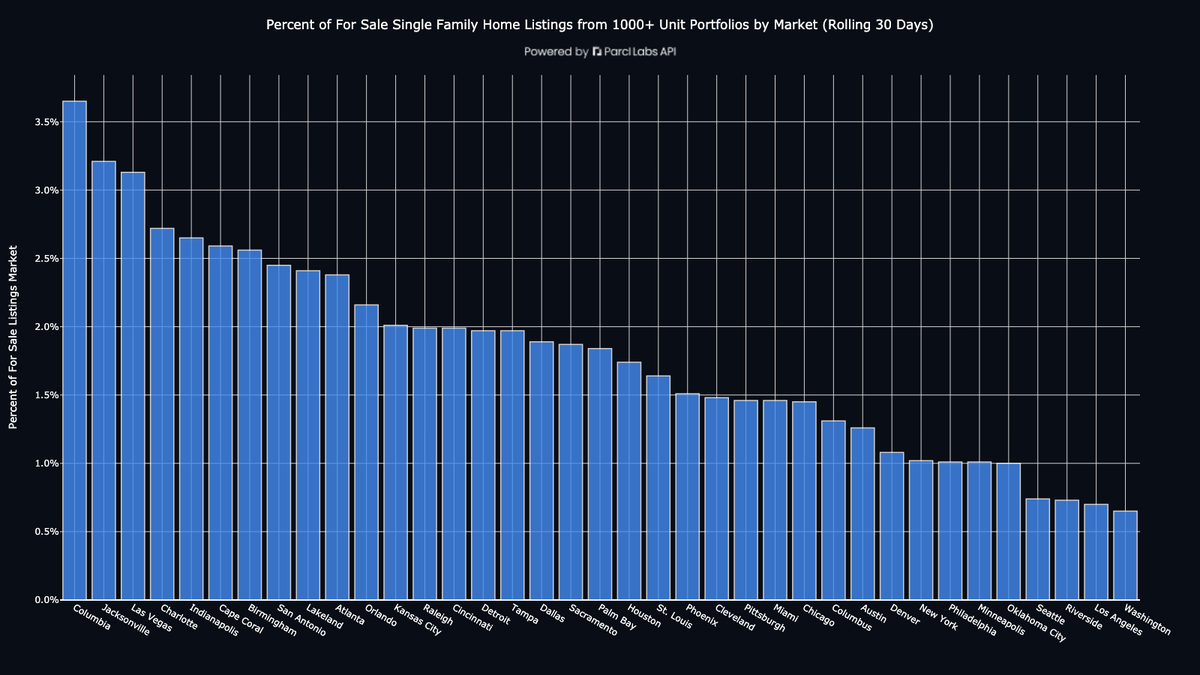
Have you ever wondered what percent of all single family home listings activity is coming from 1000+ unit portfolios right now?
So did we, let's dig in.
The top metros over the last 30 days with the highest share of institutional listings in order:
1. Columbia: 43 units, 3.6% of market
2. Jacksonville: 115 units, 3.2% of market
3. Las Vegas: 161 units, 3.1% of market
4. Charlotte: 114 units, 2.7% of market
5. Indianapolis: 76 units, 2.6% of market
6. Cape Coral: 55 units, 2.6% of market
7. Birmingham: 53 units, 2.6% of market
8. San Antonio: 113 units, 2.5% of market
9. Lakeland: 38 units, 2.4% of market
10. Atlanta: 294 units, 2.4% of market
11. Orlando: 92 units, 2.2% of market
12. Kansas City: 82 units, 2.0% of market
13. Raleigh: 39 units, 2.0% of market
14. Cincinnati: 54 units, 2.0% of market
15. Detroit: 113 units, 2.0% of market
16. Tampa: 120 units, 2.0% of market
17. Dallas: 254 units, 1.9% of market
18. Sacramento: 44 units, 1.9% of market
19. Palm Bay: 26 units, 1.8% of market
20. Houston: 202 units, 1.7% of market
21. St. Louis: 72 units, 1.6% of market
22. Phoenix: 110 units, 1.5% of market
23. Cleveland: 27 units, 1.5% of market
24. Pittsburgh: 29 units, 1.5% of market
25. Miami: 84 units, 1.5% of market
26. Chicago: 123 units, 1.4% of market
27. Columbus: 35 units, 1.3% of market
28. Austin: 57 units, 1.3% of market
29. Denver: 44 units, 1.1% of market
30. New York: 72 units, 1.0% of market
31. Philadelphia: 44 units, 1.0% of market
32. Minneapolis: 54 units, 1.0% of market
33. Oklahoma City: 28 units, 1.0% of market
34. Seattle: 28 units, 0.7% of market
35. Riverside: 38 units, 0.7% of market
36. Los Angeles: 50 units, 0.7% of market
37. Washington: 27 units, 0.7% of market
We will be 👀
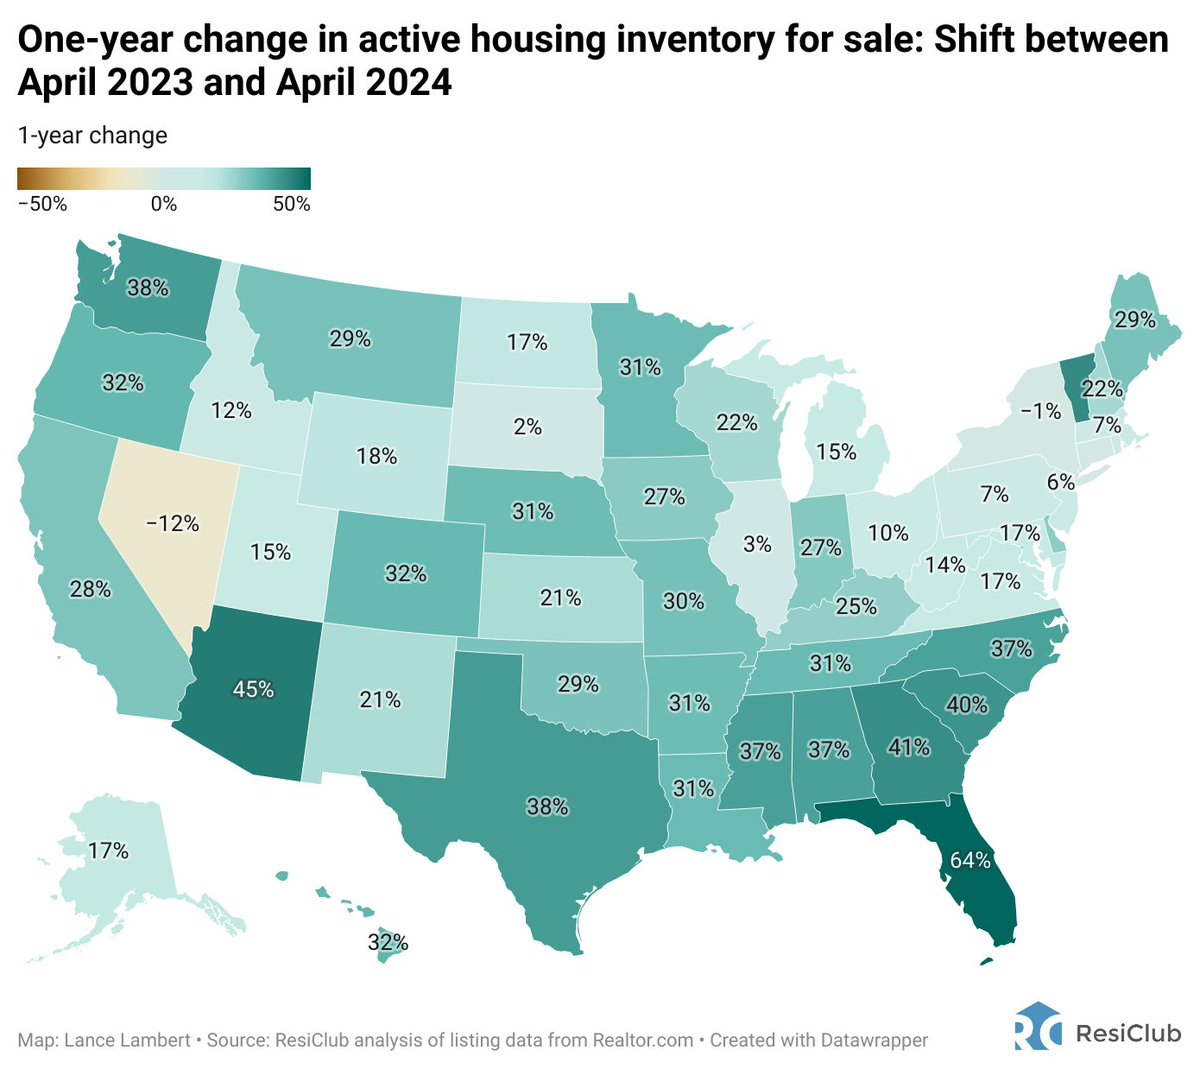
Housing market sees 30% inventory increase, yet still 35% below pre-pandemic
LEFT: 1-year change in active housing inventory for sale (April '23 to April '24)
RIGHT: Active inventory compared to pre-pandemic levels (April '19 to April '24)
https://t.co/QwRLlvXAZx
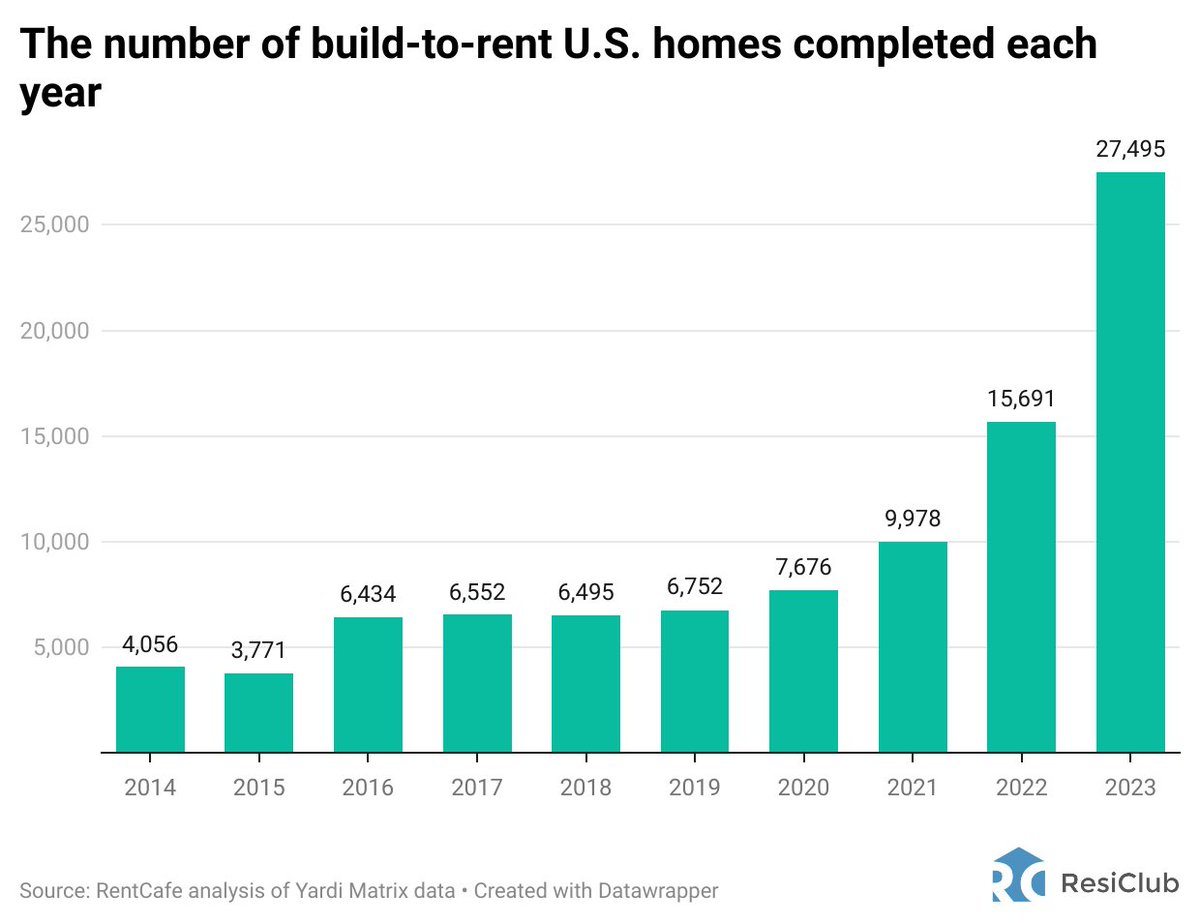
Build-to-rent deliveries triple, up by 307%
In 2023, there were a record-breaking 27,495 build-to-rent homes completed, up 75% from 2022 and a staggering 307% since 2019.
Source: @reachbyrentcafe / Yardi Matrix
https://t.co/1foGCncEKE
Among the 50 largest metro area housing markets:
These markets are ABOVE pre-pandemic active inventory levels:
San Antonio, TX
Austin, TX
Memphis, TN
Just a hair below:
New Orleans, LA
Almost there/moving up quickly:
Tampa, FL
Orlando, FL
Lance Lambert is one of the top residential real estate reporters in the country.
This segment is a perfect example why Lance's work is so important right now while housing affordability is dropping so aggressively.
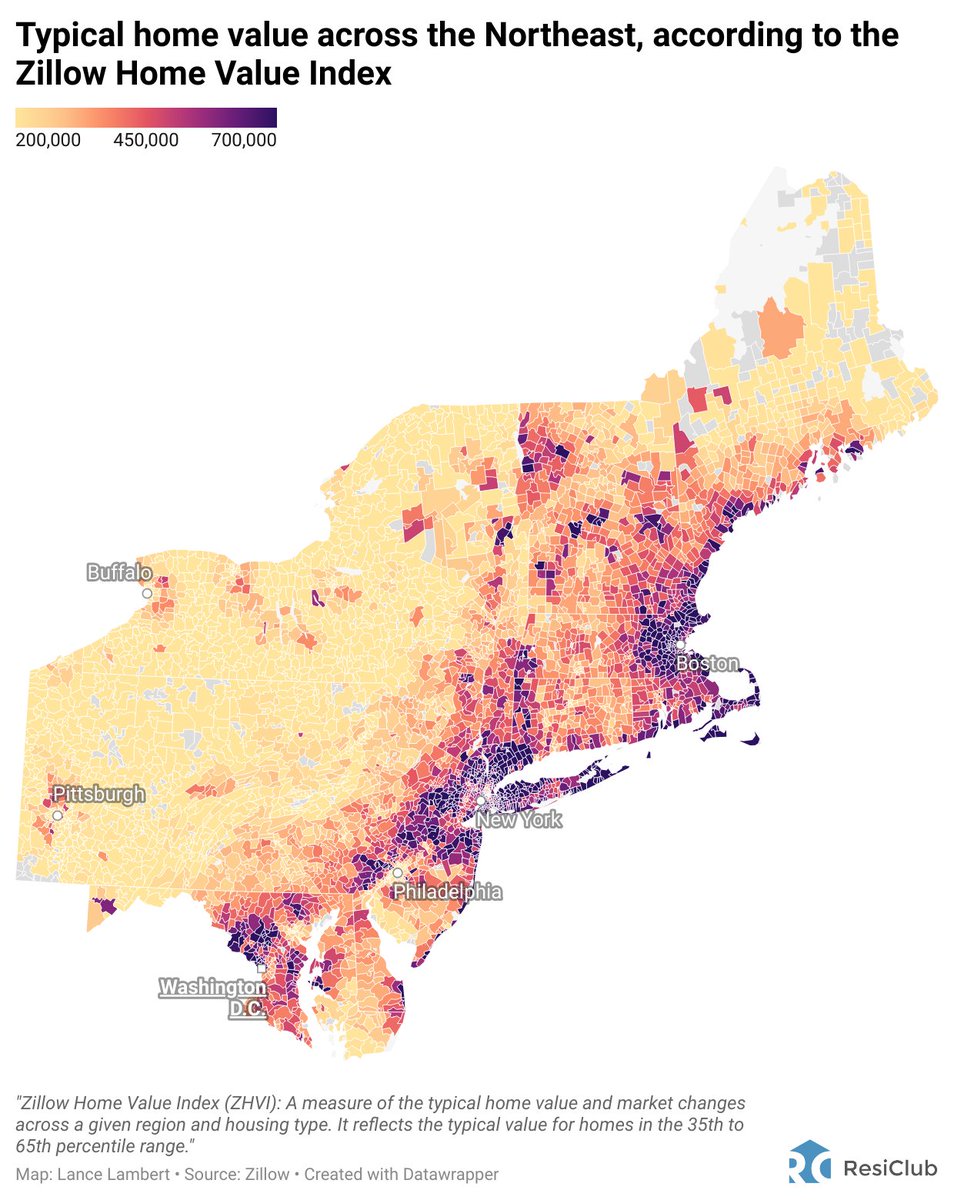
How home prices vary across the country, as told by 6 interactive maps
Home prices data for +26,000 ZIP codes 🏡📊👇
My latest for @ResidentialClub
https://t.co/bZnLIvFHDp
Institutional landlords play a smaller role in the housing market than perceived
According to a new paper published by researchers at @philadelphiafed@ASU and @USC
'we find no evidence that SFRs crowd out residential home-buyers or increase home prices'
https://t.co/PUxM9joTPU