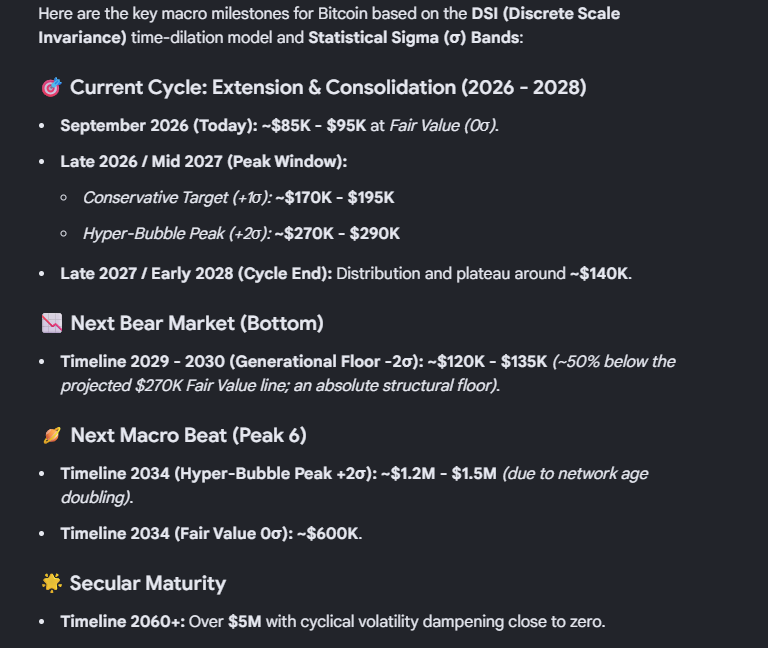
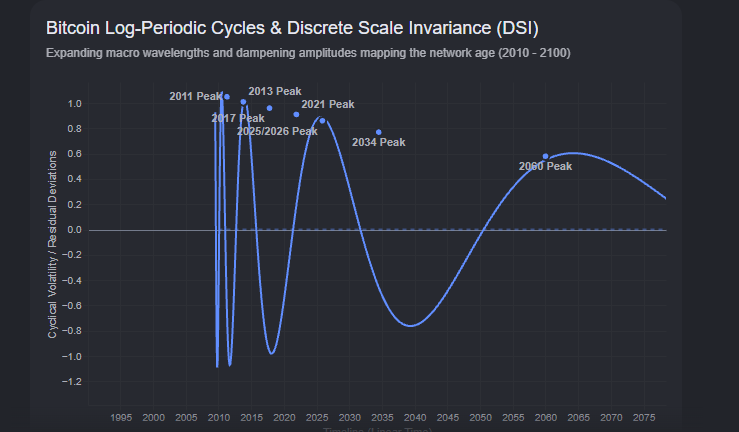
DiscreteScaleInvariance(DSI).Unlike a strict linear cycle (such as t standard 4y halving narrative), t system displays autosimilarity at fixed scaling ratios (λ≈2.05).This causes each successive cycle to consume a wider window of linear time to complete a full phase oscillation.
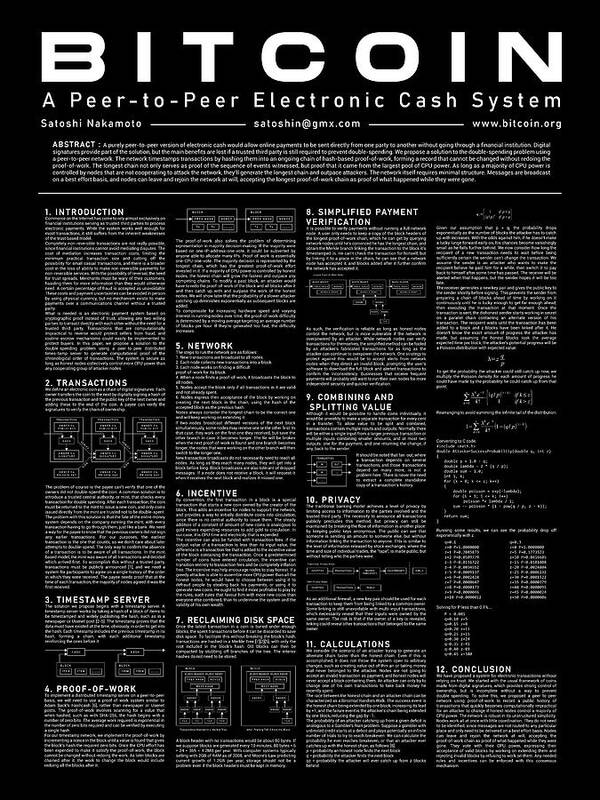
A surprising amount of people are bulltarded on Bitcoin but have never read the whitepaper, it's 9 pages
Here is the TLDR for you
The problem: every digital payment needs a middleman. The middleman can block you, reverse you, or debase you.
The solution: a public ledger everyone holds a copy of, so no single party controls the record.
The catch: who gets to write the next page? If writing is cheap, cheaters can spam fake history.
The fix: make writing expensive. Miners burn real electricity to add each page. Rewriting old pages means redoing all that work, alone, faster than the entire network combined. Honesty becomes the profitable strategy.
crazy to think satoshi airdropped 9 pages of straight sauce that solved a problem computer scientists had chased for decades
DiscreteScaleInvariance(DSI).Unlike a strict linear cycle (such as t standard 4y halving narrative), t system displays autosimilarity at fixed scaling ratios (λ≈2.05).This causes each successive cycle to consume a wider window of linear time to complete a full phase oscillation.
DiscreteScaleInvariance(DSI).Unlike a strict linear cycle (such as t standard 4y halving narrative), t system displays autosimilarity at fixed scaling ratios (λ≈2.05).This causes each successive cycle to consume a wider window of linear time to complete a full phase oscillation.
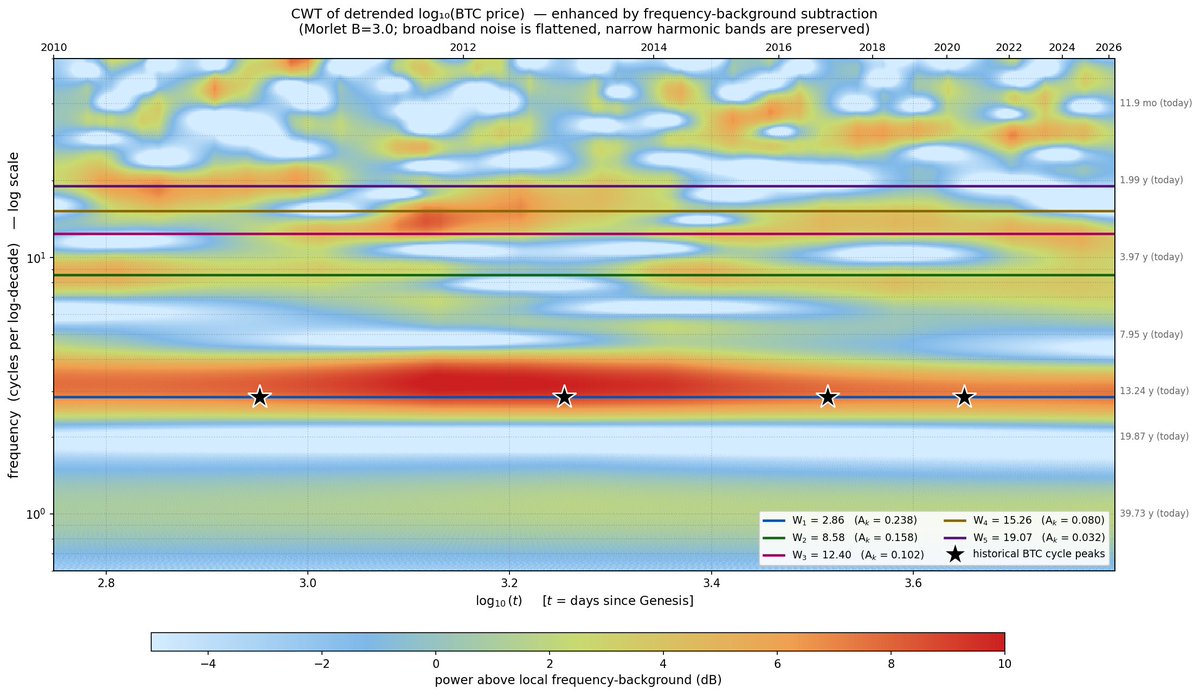
What this chart is
This is a time-frequency picture of Bitcoin's entire price history, from July 2010 to April 2026. The horizontal axis is log of time since Bitcoin genesis. The vertical axis is frequency, measured in "cycles per log-decade" of time, shown on a log scale. Red means a strong oscillation is present; blue means very little. The four black stars mark the four real bull-market tops: June 2011, December 2013, December 2017, and April 2021.
What a log-periodic cycle means
Normal cycles repeat every fixed number of days. Stock market business cycles, for example, show up at the same frequency whether you look at the 1970s or the 2020s. Log-periodic cycles are different. They repeat at a fixed rate in the log of time, which means each cycle lasts longer than the previous one by a constant ratio. In Bitcoin's case the ratio turns out to be about a factor of 2.2 per cycle. The 2011 top came about 2.5 years after genesis. The 2013 top came about 5 years after. The 2017 top came about 9 years after. The 2021 top came about 12 years after. Each cycle is longer than the previous one, but by a fixed log-space step. That is the signature of log-periodicity.
What the red band on the W1 line actually means
The blue horizontal line marked W1 sits at 2.86 cycles per log-decade. The red band running along that line all the way across the chart is the wavelet transform of real BTC data saying: "across Bitcoin's entire history, the strongest periodic component is at exactly 2.86 cycles per log-decade."
This is not a fitted curve. This is what a neutral signal processing method finds when you give it the raw price data with the trend removed. The four stars above line up with the same band, confirming that the real market tops are being produced by this oscillation.
Why this is interesting
This pattern appears in physical systems that undergo phase transitions with discrete scale invariance: earthquake fault networks, failing materials, financial bubbles in general. It was first applied to finance by Didier Sornette in the 1990s, who used it to describe crashes in equity markets.
The fact that the same mathematical structure fits 16 years of Bitcoin data suggests Bitcoin's price dynamics are driven by the same kind of positive feedback loop that governs other critical phenomena. Investors pile in, price rises, the rise itself attracts more investors, but the system has limits. At a certain point the feedback breaks down and the price corrects. Then the whole process restarts on a longer timescale.
What the harmonics above W1 tell us
The fainter bands at W2 (8.58), W3 (12.40), W4 (15.26), and W5 (19.07) are overtones of W1. In music, overtones give an instrument its character. Here they give the Bitcoin cycle its shape. A pure sinusoid at W1 alone would produce smooth round bumps in the detrended price. The overtones are what make the actual tops sharp and the bottoms round. They also explain why the tops do not line up perfectly with the W1 maxima. Real peaks happen when W1, W2, and sometimes W3 happen to align constructively at the same moment.
Bottom line
The fact that a neutral method, applied to unfiltered price data, finds the same dominant frequency that an analytical model finds, and that this frequency happens to be the one that produced every major bull cycle in Bitcoin's history, is the kind of thing physicists would call a signature.
It does not prove the pattern will continue, but it is a strong statement that the past 16 years of Bitcoin price action were not random.
There is structure in the noise, and the structure has a specific mathematical form with a long history in other critical systems.
The "B-print"
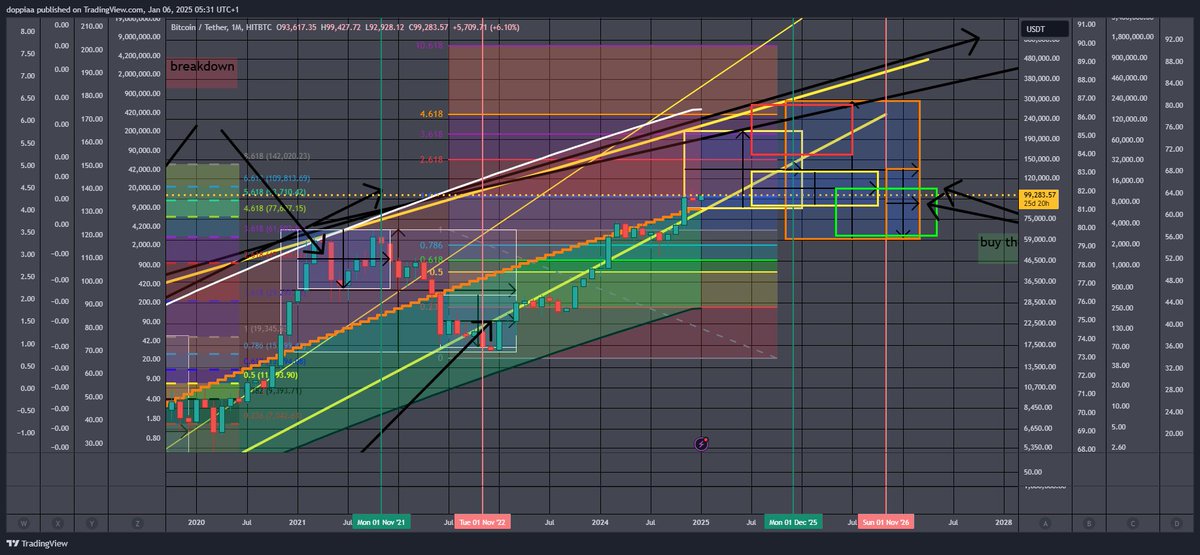
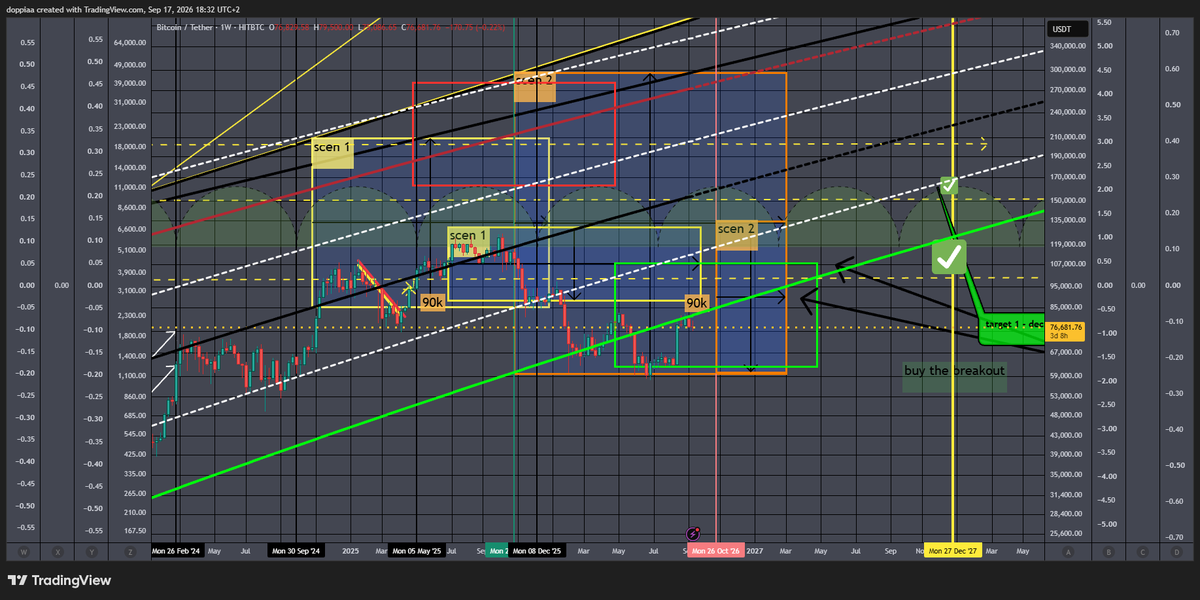
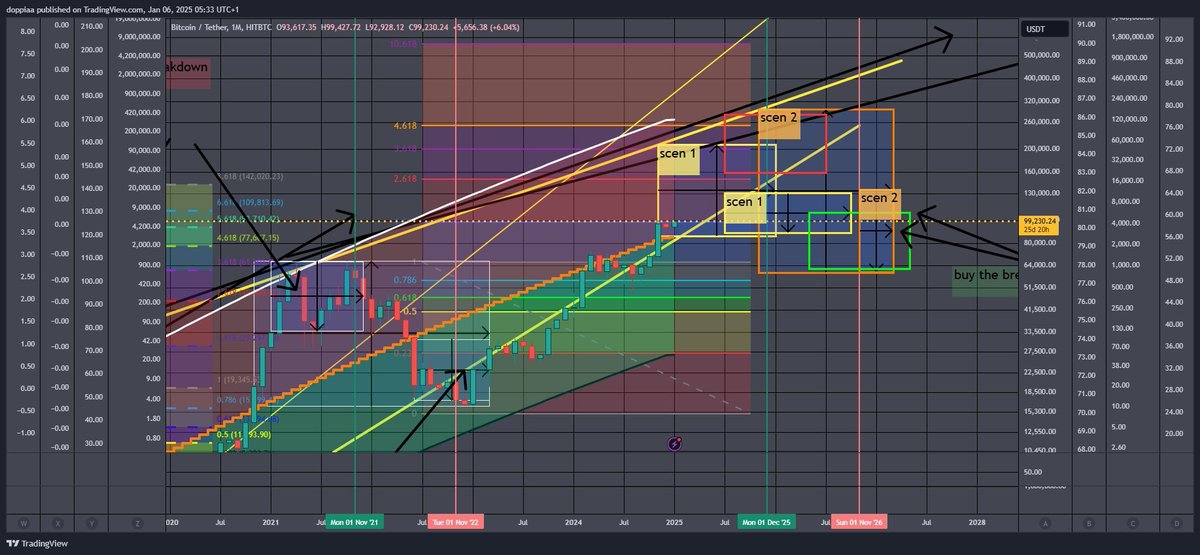
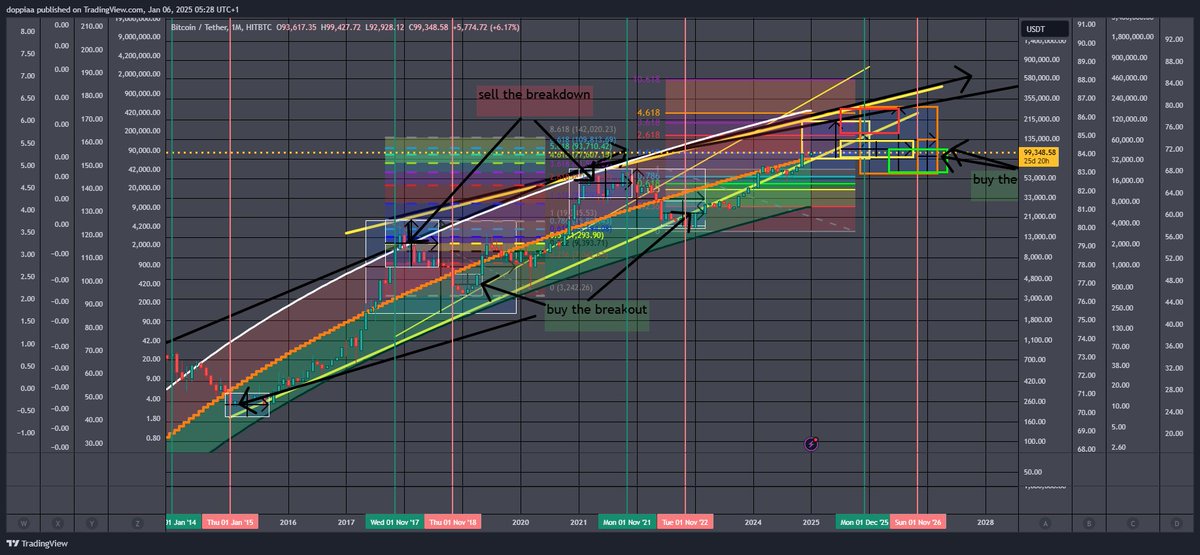
using Giovanni's power law. How to spot the best entries for the next cycle:
scenario1, top 210k bottom 85k (safebuy ≤108k)
scenario2, top 296k bottom 59k (safebuy ≤88k)
when we reach the top we'll have only one accurate scenario.
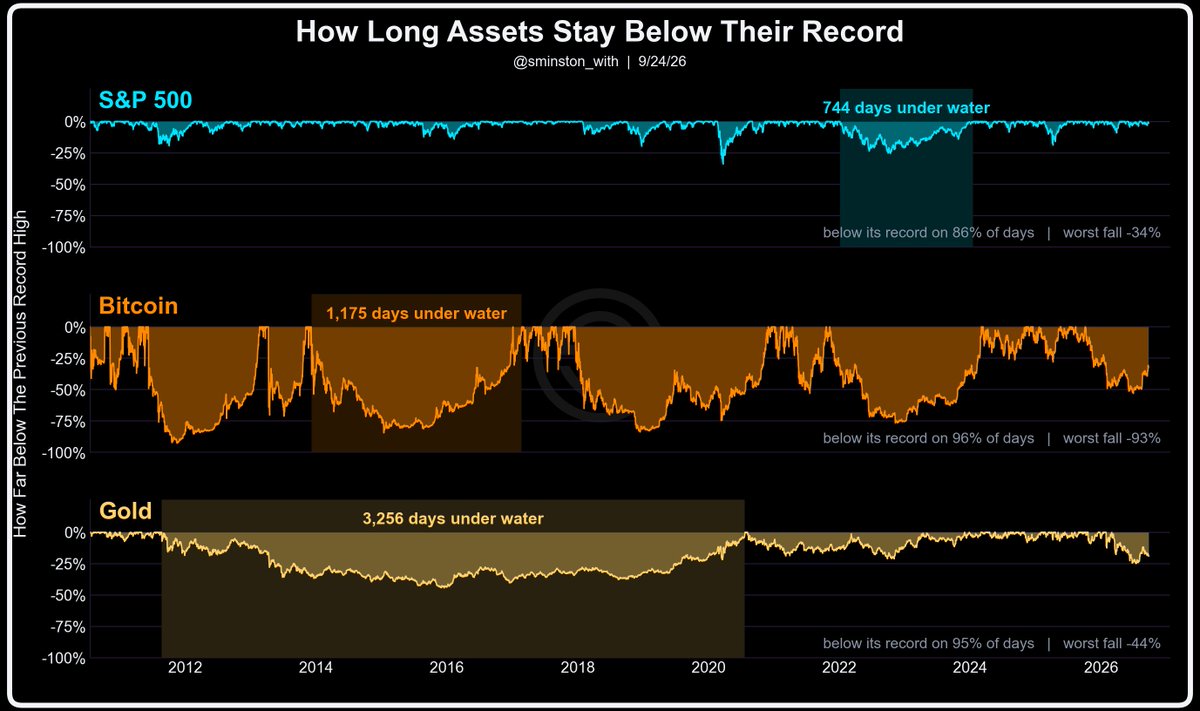
Comparing gold, Bitcoin and the S&P500, which has the record for the longest stretch underwater (price sitting below its all-time high)?🤔
- - -
This kind of blew my mind.
If you take a look at depth and breadth of drawdowns for each, Bitcoin obviously takes the prize for depth 🟠
But, it ranks 2nd in terms of time spent underwater - a record of 1,175 days (~3.2 years), compared to
🔵 S&P's 744 days (~2 years), and
🟡 gold's 3,256 days (~8.9 years)
Gold fell less than HALF as far as Bitcoin, and took almost 3x longer to recover from it.
I'll take the violent drawdown that ends over the shallow one that just sits there, especially as Bitcoin's path seems to be fairly predictable.
With 360 Bitcoin wrench attacks cataloged, it's time to take the archive to the next level. Over the weekend I clanked out this interactive dashboard; feedback is welcome!
https://t.co/bty25Jo05Z
Retire on 1 BTC by 2037?
-> How every 0.2 Bitcoin retires you 3 years faster.
-> Why you should deploy now, not wait
-> The exact individual math to BTC
A true legend @LastCoinStandng
Every rolling four-year window in bitcoin's history has been positive - all 4,447 of them. The worst, April 2021 to April 2025, still returned +32%.
Today's reading is +313%.
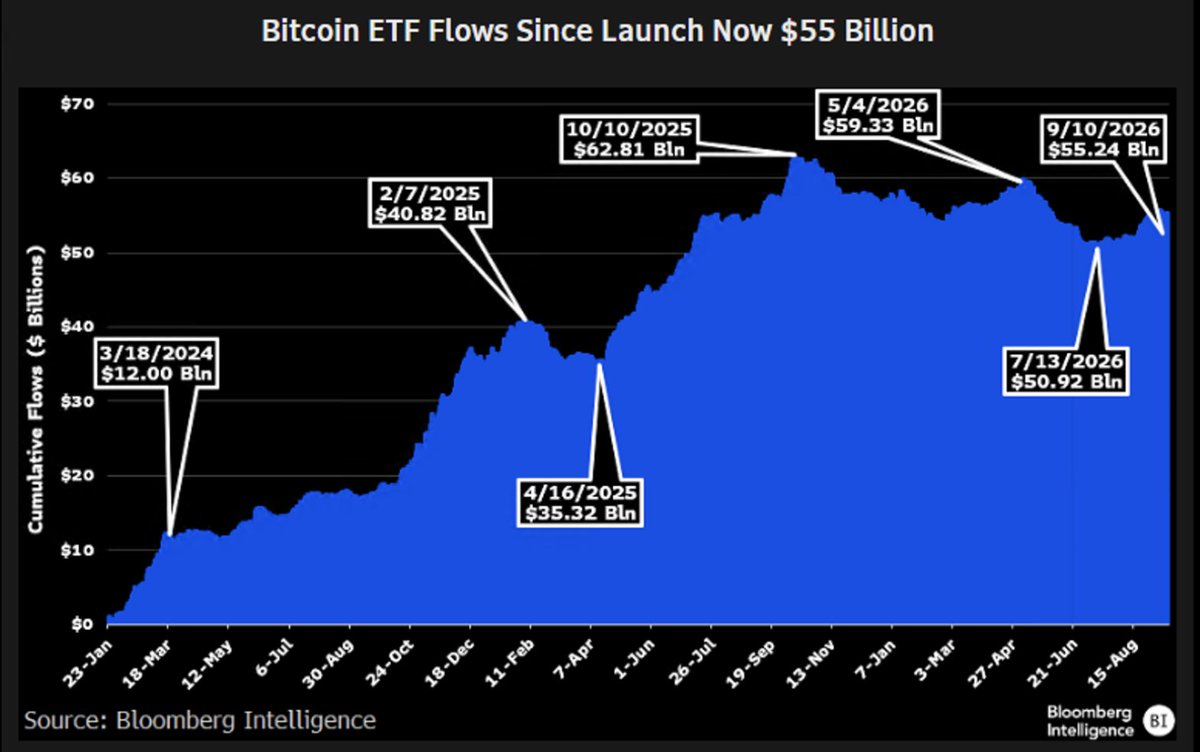
Nice look at the most important chart for bitcoin ETFs which is cumulative net flows lifetime which are curr at $55b, down from peak of $63b but up from low of $50b. Again, incredible intestinal fortitude from the Boomers given they saw a 50% drawdown. Stocks being up during that time prob helped but still.. via @JSeyff
*the reason this is most imp chart is bc it is excludes price appreciation so it's pure measure of investor interest vs assets which bake in price
FRUIT FLY BRAIN MINES BITCOIN AT POTENTIAL 10X ASIC EFFICIENCY
Introducing HashFly by @FutureBit, an experimental Bitcoin miner based on a reconstructed fruit fly brain using 2,914 real neuron connections to run SHA-256.
The team says that if the system could be scaled using actual organic neurons, it could theoretically hash at roughly 1 W/TH, around 10x more energy efficient than leading 3nm silicon ASICs.
For now, it’s an experiment. But biologically inspired Bitcoin mining is officially a thing.
We will have another episode of the Physics of Bitcoin at 3:30 PM CET, 9:30 AM EST.
The agenda is below, join us on X, YouTube and Twitch.
The links are in the comments.