The package covers three main areas of precision agriculture: yield monitor, satellite, and weather data.
repository: https://t.co/8uoTYMBZka
bug reports: https://t.co/XgWedwcN5R
I am happy to share that our newest paper is published! We developed an R package to provide support for precision agriculture applications.
https://t.co/D4QBvjCTBT
I was preparing a lecture on Brazilian agriculture for this week and I came up with these maps to show agricultural area dynamics over time in Brazil. I thought others might find it useful as well. Check out the Soybean area over time (1990 to 2022):
I had the opportunity to present my research at the 2023 ASA-CSSA-SSSA meeting this week. We discussed how we can use nonlinear statistical models and remote sensing to estimate crop planting and harvest dates.
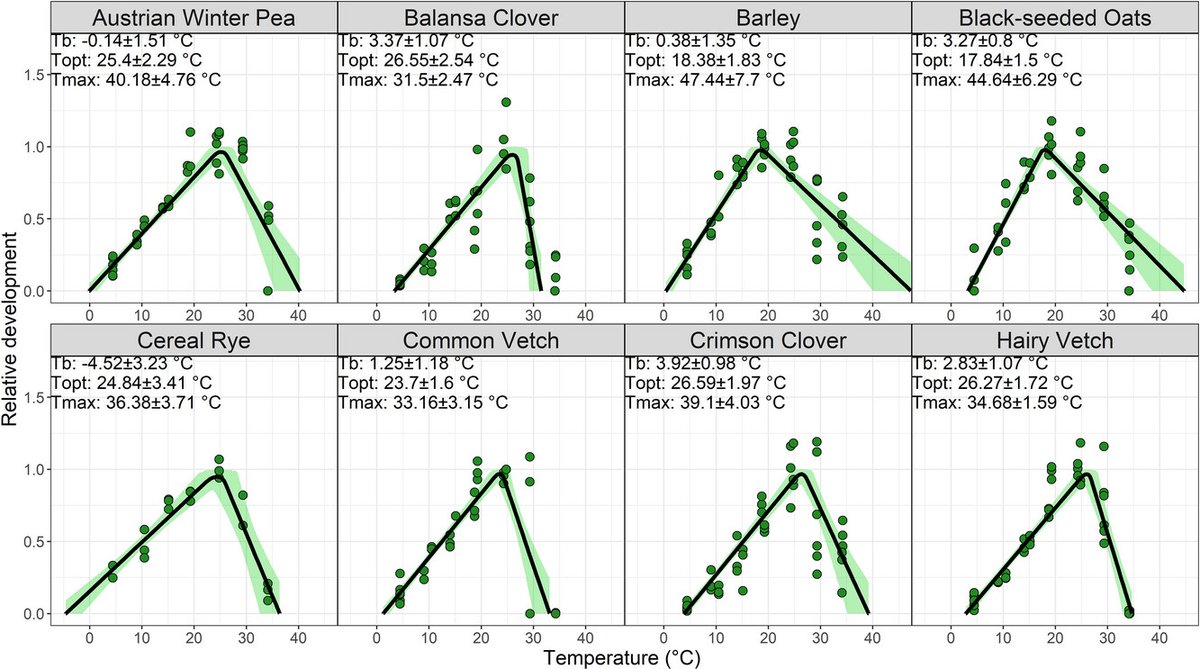
For most cover crop species, cardinal temperatures are not well defined in the literature, leading to inaccurate growing degree days. The objective of this study was to determine the cardinal temperatures of 8 common cover crop species: https://t.co/xzwCnLGtHc
My first master’s paper is out!
We’ve determined the cardinal temperatures for 8 cover crop species. Thanks to all collaborators!
https://t.co/cvdcSCztdN
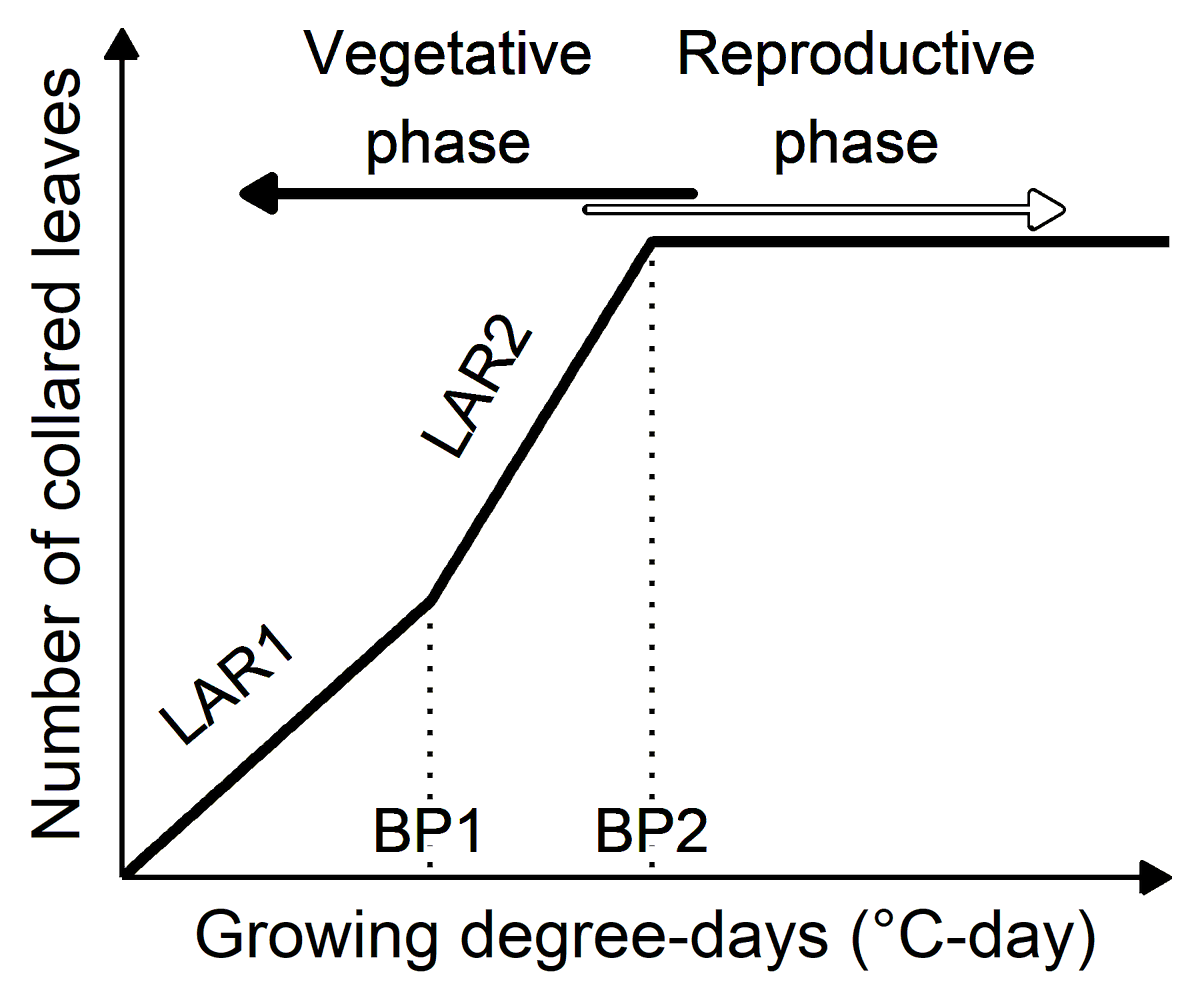
Our new paper showed that four decades of maize breeding has indirectly affected the rate at which maize produces new leaves. Other phenological traits were affected too. Give it a read to find out more:
https://t.co/M19brGWnj1
Thanks to all the co-authors!
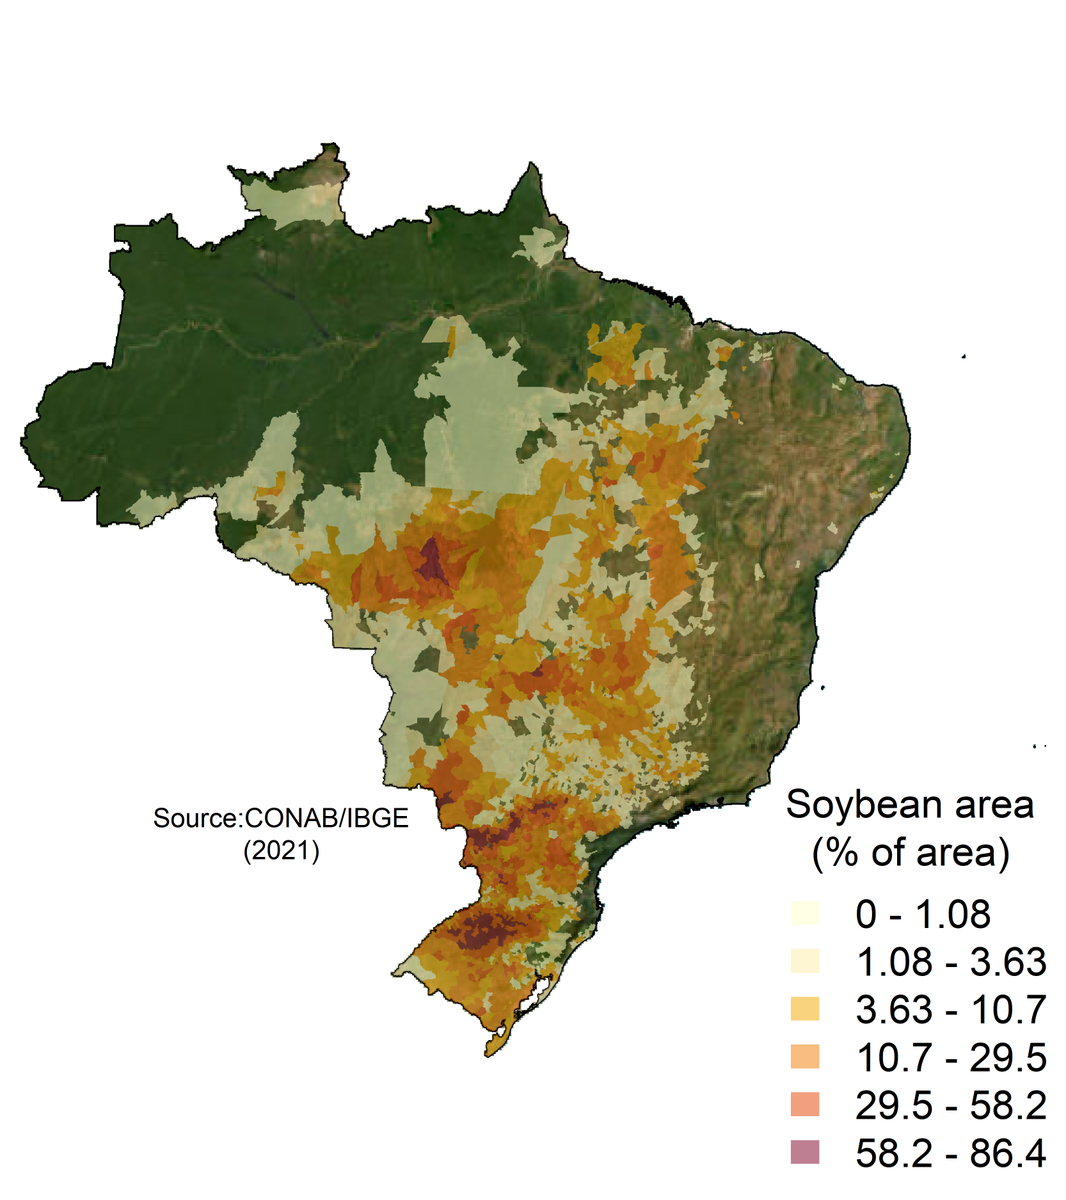
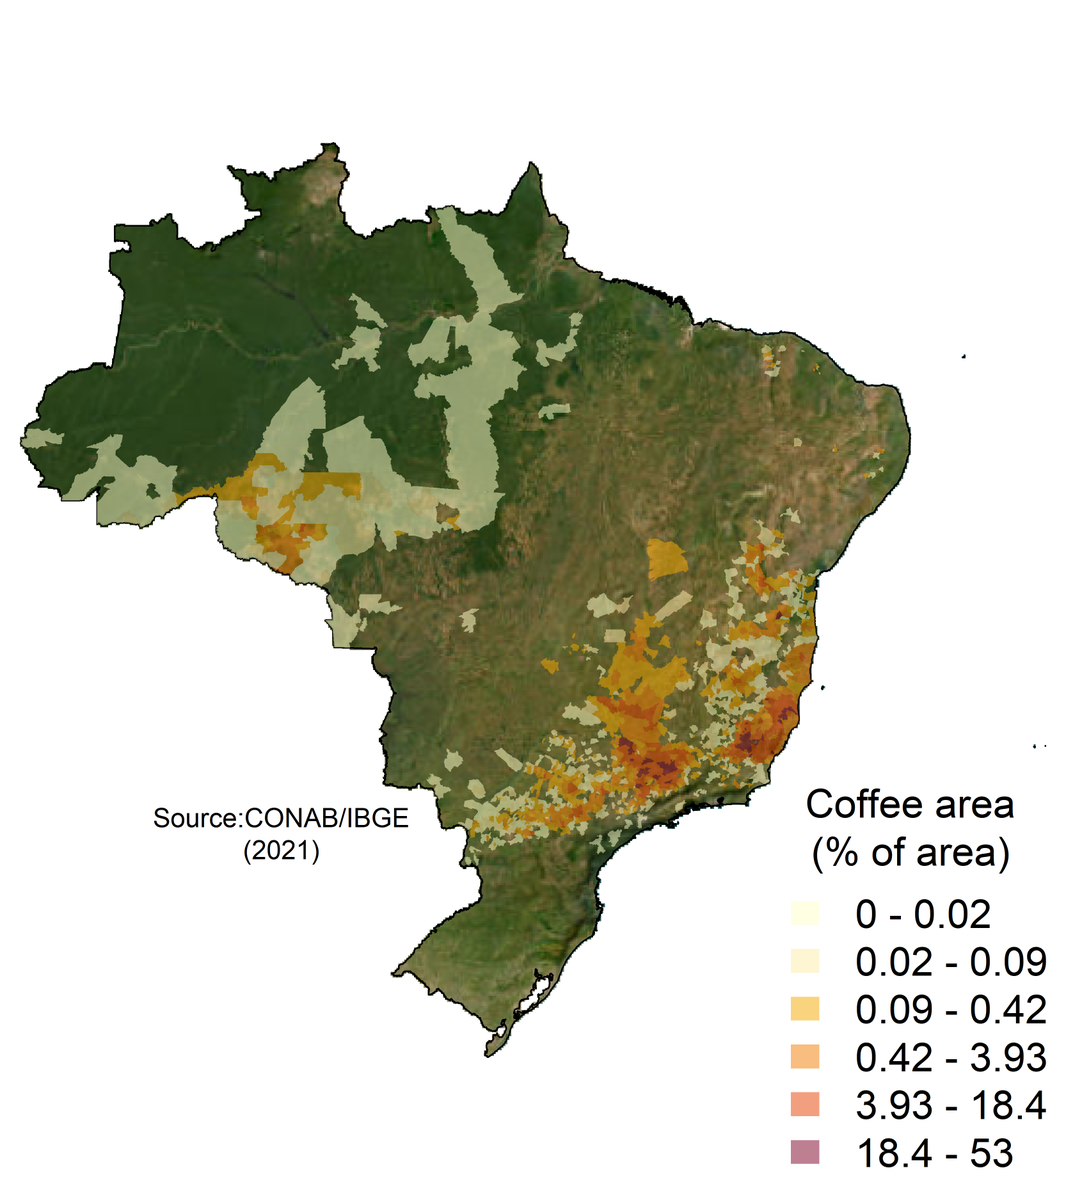
I made these for a class that I am teaching this week and I thought they might be interesting for others too. They show where some of the main crops are produced in Brazil. The units are fraction of the municipality taken by the crop). Check out the soybean area:
As I was planning a class on the interaction between photoperiod and soybean development, I came up with this map and I thought others might find it useful as well:
@pappu817 The photoperiod calculations followed this paper. https://t.co/CLwjacenrA.
Then raster and terra packages for geospatial processing. ggplot2 for the map (365 maps, actually). magick for the GIF.