#XAUUSD
🚨 99% OF TRADERS WILL GET TRAPPED TODAY – HERE’S WHY (CPI $GOLD ANALYSIS)
THE OPERATOR OF $XAUUSD 🥇
https://t.co/6oC7SRZG0F
Hello everyone, hope you all are doing well. ❤️
Today is CPI Day, the first major red-folder news event of the week. The market is currently trading in a very interesting area and is already building what looks like a beautiful trap setup. Let’s break it down step-by-step with market psychology and price action to understand what could happen during the CPI release.
📊 Weekly Expectation – Why $5200 Liquidity Was Important
As per our weekly analysis, we were expecting the market to give a breakout above $5200. The reason behind this expectation was the structure formed last week.
After the sharp fall last week, the market created a retracement around the $5200 area. Every time price approached this level, it showed rejection and reversal. Because of this repeated reaction, many traders who follow price action started noticing a lower high structure, which encouraged a lot of traders to enter sell positions around $5200 expecting further downside.
THE OPERATOR OF $XAUUSD 🥇
https://t.co/6oC7SRZG0F
However, in the market, major moves rarely happen without liquidity hunts. That’s a basic rule of the market. Before continuing lower, the market often traps the traders positioned in the obvious direction. That’s why our expectation was clear: before any further downside move, the market would likely trap the sellers positioned around $5200.
Last week the market was also influenced by war-related news, which made many traders strongly bullish biased. When the sudden drop happened on Tuesday, very few traders were able to sell. But once the market retraced back near $5200and started falling again, many traders entered late selling positions.
And exactly those late sellers were the liquidity the market needed to trap. This is the movement we expected — and we started seeing it unfold on Tuesday.
⚡ Monday’s Aggressive Drop – NFP Liquidity Trap
When the market opened on Monday, we saw an aggressive drop. In my view, this move was mainly designed to remove traders who were holding buying positions from NFP day.
If you remember my weekly analysis, I clearly explained a common NFP logic:
The high and low formed during NFP often get trapped the following week, especially when the market is moving inside a range. During NFP, many retail traders enter random trades due to fast price movements and then hold those positions.
THE OPERATOR OF $XAUUSD 🥇
https://t.co/6oC7SRZG0F
So when the market opened this week, we saw that random buyers getting trapped first. After that, the market showed a tough fight between buyers and sellers.
However, the unfinished task was still there — trapping the sellers around $5200. Slowly and gradually, we started seeing this process play out.
Interestingly, after Monday’s aggressive drop, very few traders had the courage to buy, because sharp moves usually scare traders away from taking the opposite position. Despite that, we can now clearly see liquid buying entering the market, which actually supports our analysis — because liquid buying often becomes the next liquidity trap.
📈 Trendline Breakout – The New Buyer Trap
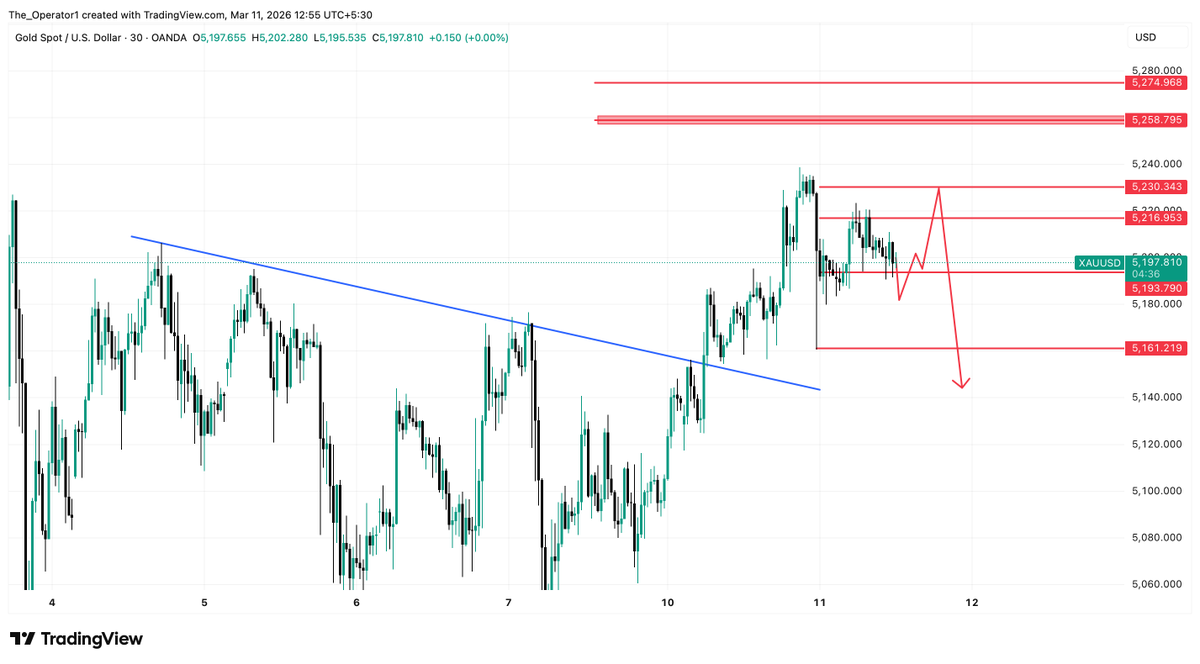
On the chart, I have drawn a trendline connecting higher lows.
When price was trading below this trendline, many traders were selling. But once the trendline broke, the breakout looked strong. After that breakout, the market repeatedly took support around the $5160 area yesterday.
Because of this repeated support, many traders have now entered buying positions.
If we look back at history:
In January, a strong buying move started from this area.
Around two weeks ago, when $5200 broke out, the market also showed a strong upside move.
Because of this historical reaction, many traders are now confident about buying. But from every angle, this still looks like a trap forming.
THE OPERATOR OF $XAUUSD 🥇
https://t.co/6oC7SRZG0F
On major news days like CPI, the market often breaks a level, attracts traders, and then traps them instead of continuing the move. Considering the current structure and the volume coming into the market this week, most of the upside buying looks very liquid — and liquid buying often becomes the next trap.
🧠 Psychology Around the $5000 Level
Another important factor is the $5000 psychological level.
Last week’s fall stopped near this major psychological number. When the market shows a reversal from such a strong level — especially when important news is coming — many traders feel confident enough to take buying risks.
This week, after the market opened on Monday, we saw a drop that created a low near $5014. Many traders likely placed their stop losses near $5000 or below last week’s low around $4997.
But based on my study, when the market drops directly to a major psychological level like this, it usually does not continue a straight upside trend immediately.
So considering all these factors, let’s understand my CPI trading plan.
🎯 CPI Game Plan – Key Levels to Watch
For me, $5180 – $5215 is a No Trading Zone.
In this range, the market is already showing choppy price action, which indicates strong liquidity generation and a tough battle between buyers and sellers.
My plan is simple.
30 minutes before the CPI release, I will observe where the market is trading.
Scenario 1 📈
If the market is trading above $5206–$5210, we might see a quick upside push first to attract even more buyers and collect liquidity.
From the red zone area, the market could then reverse sharply and we might see a strong downside move, potentially pushing the market below $5160.
Scenario 2 📉
If the market is already trading below $5206 during CPI, we could see a direct breakdown of $5160.
The $5160 level is extremely important this week because after the trendline breakout, the market repeatedly took support there. That means major liquidity is sitting below this level, which the market may target during the news event.
🚨 Bigger Picture Bias
As long as the market stays below $5260 – $5275, the overall bias remains strongly bearish.
Until this zone breaks, every rally should be viewed as a potential selling opportunity.
💡 Final Thoughts for CPI Day
I hope you liked this CPI psychological market analysis and gained some useful insights along with the trading plan.
Right now the market has good volume, which is great for trading. But in these conditions, timing and price are everything.
So remember:
Trade with patience
Wait for confirmation
Avoid random entries
Wishing you all good luck for CPI Day.
May your trading day be profitable and disciplined. 📈💰
THE OPERATOR OF $XAUUSD 🥇
https://t.co/6oC7SRZG0F
सोशल मीडिया पर पेट्रोल और डीज़ल की कमी को लेकर फैल रही खबरें पूरी तरह निराधार हैं। भारत में ईंधन का पर्याप्त भंडार उपलब्ध है और आपूर्ति व वितरण नेटवर्क सामान्य रूप से कार्य कर रहे हैं।
इंडियनऑइल निर्बाध ईंधन आपूर्ति बनाए रखने के लिए पूरी तरह प्रतिबद्ध है। नागरिकों को आश्वस्त किया जाता है कि किसी भी प्रकार की चिंता करने की आवश्यकता नहीं है।
कृपया पेट्रोल पंपों पर अनावश्यक भीड़ न लगाएँ और सही जानकारी के लिए केवल आधिकारिक स्रोतों पर ही भरोसा करें।
Reports on social media suggesting a shortage of petrol and diesel are baseless. India has sufficient fuel stocks, and supply and distribution networks are functioning normally.
IndianOil is committed to maintaining uninterrupted fuel supply across the country. Citizens are requested not to panic or crowd fuel stations and to rely only on official sources for accurate information.
@HardeepSPuri@PetroleumMin@neerajmittalias@secretary_moPNG@ChairmanIOCL@sahneyas
BRAHMINS Kisiko padne nahi diya ??
Adam's Report, 1835 say-
60% Students in BENGAL were from Lower Castes.
I am Adding one more interesting DATA from Adam's report.
Murshidabad district, Bengal,1830
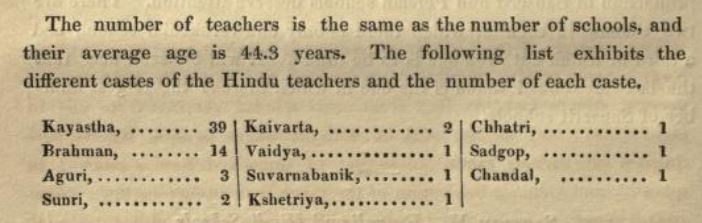
out of 66 teachers only 14 were BRAHMINS.
AND 5 teachers were SC.
Thanks @MumukshuSavitri for her brilliant research,
this thread is a Gem.
This rascal is eradicating humans & eating babies, & our government is inviting him & signing an MoU to use Indians as guinea pigs. Dear @PMOIndia, Shri @narendramodi ji, it is very sad that a pedophilic, immoral, evil person is allowed to have direct access to our healthcare, cows, & agriculture
GATES OF INDIA SHOULD BE CLOSED FOR BILL GATES AND HIS FOUNDATION.
Leave Epstein, his illegal clinical trial of HPV vaccine on tribal girls alone should have made him a persona non grata in India.
What's happening in India. Looks like all #EpsteinFiles criminals are headed to India. After Bill Gates, Rothschild enters India.
India’s biggest Stock Exchange appoints Rothschild & Co. as independent advisor for long-awaited Initial Public Offering. We Hindus are screwed
Tired of conspiracy theories? Here’s one that’s not.
India's National Stock Exchange (NSE) appointed Rothschild & Co. on Feb 12, 2026, as independent advisor for its IPO.
Rothschild will managipulate India’s Stock markets now.
Why is a shady family group Rothschild allowed a front seat at NSE.
The world knows Epstein Rothschild Group’s connection.
What’s happening in India. Who’s idea is it to let NSE IPO be managed by shadowy global advisor. Is India now controlled by the U.S. & Israel ?
This is harmful to our country’s financial stability and security.
#EpsteinFiles
3 year old Arman died because of Stray Dog bite.
One day Armaan came back crying, family thought he must have fell down. Few days later, he started fearing drinking water. He was scratching his body and hiding under a blanket. Water was dripping from Arman's mouth.
Arman was constantly itching his head. When family checked, there was mark of bite.
They took him to hospital but hospital said they won't be able to save him. Arman died a painful death.
His family has requested to get Stray Dogs removed so that nobody faces it.
I am sure dog lovers and milords will call them Dog Haters.
#XAUUSD
🧠 THE SMART MONEY TRAP AT $4000 – 95% TRADERS WILL MISS THIS! 😱
Hello everyone, how are you all doing?
Before we begin today’s analysis, let me remind you about the 1,400-pip swing trade I shared yesterday — we’ve already captured around 500 pips from it! 🔥
You can see in the repost below that I gave two key levels — $3940 and $3957, and from these levels, we got a perfect pinpoint bullish reaction in gold.
I hope you all are still holding your trades and riding this beautiful bullish move in gold confidently. Because both psychologically and technically, gold is still very bullish — and there are no signs of weakness yet.
So, relax, ride the momentum, and make big profits in this bull run.
Now, let’s get into the analysis 👇
⚡ Join The Winning Side!
Before we begin, if you’re still not part of the THE OPERATOR OF $XAUUSD Telegram Community, you’re missing out big time!
Join now and start your profitable gold trading journey with thousands of traders who get institutional entries and well-researched targets every week. 🚀
THE OPERATOR OF $XAUUSD 🧿🥇
https://t.co/Nm11omkLEV
🧠 Market Psychology – Smart Trap For Retail Sellers
As I mentioned yesterday, gold has been repeatedly trapping sellers with a very clear pattern.
Every time gold moves close to a psychological level, it creates a false sell setup, forcing retail traders to short the market.
The truth is, most retailers don’t understand proper support and resistance near all-time highs. So, they sell blindly — and the market takes full advantage of that.
If gold really wanted to fall, it would’ve done so before $3900, but it didn’t. That’s a clear signal that big players have different plans — they’re aiming to push the market straight above $4000, similar to the massive bull run we saw last December from $3000 to $3500.
🚀 History Repeats Itself
Back then too, everyone thought gold couldn’t sustain above $3000 — but it did!
Many traders held swing sells from $2950–3000, expecting a crash, and they were all wiped out as the market kept pushing higher.
This time, I see the same setup repeating.
Today, gold dropped from $3977 and made a high near $3991, sitting just below the key psychological level — $4000.
Now, no doubt — a lot of tra of traders are selling here, hoping for a correction.
But that’s where retail psychology fails again.
🔥 The Big Bullish Breakout Ahead
Gold is preparing for a massive breakout above $4000, because just above this zone lies the cluster of stop losses from swing traders and sellers.
Market makers know this — and they will trigger those SLs with a strong bullish candle soon.
If you study history, you’ll notice one thing — gold never turns bearish unless we see a daily candle closing more than 3–4% lower.
So far, all we’ve seen are minor dips — just small traps to shake out weak buyers.
That means the market is still bullish, and is manipulating sellers before the next push.
🎯 Key Levels To Watch
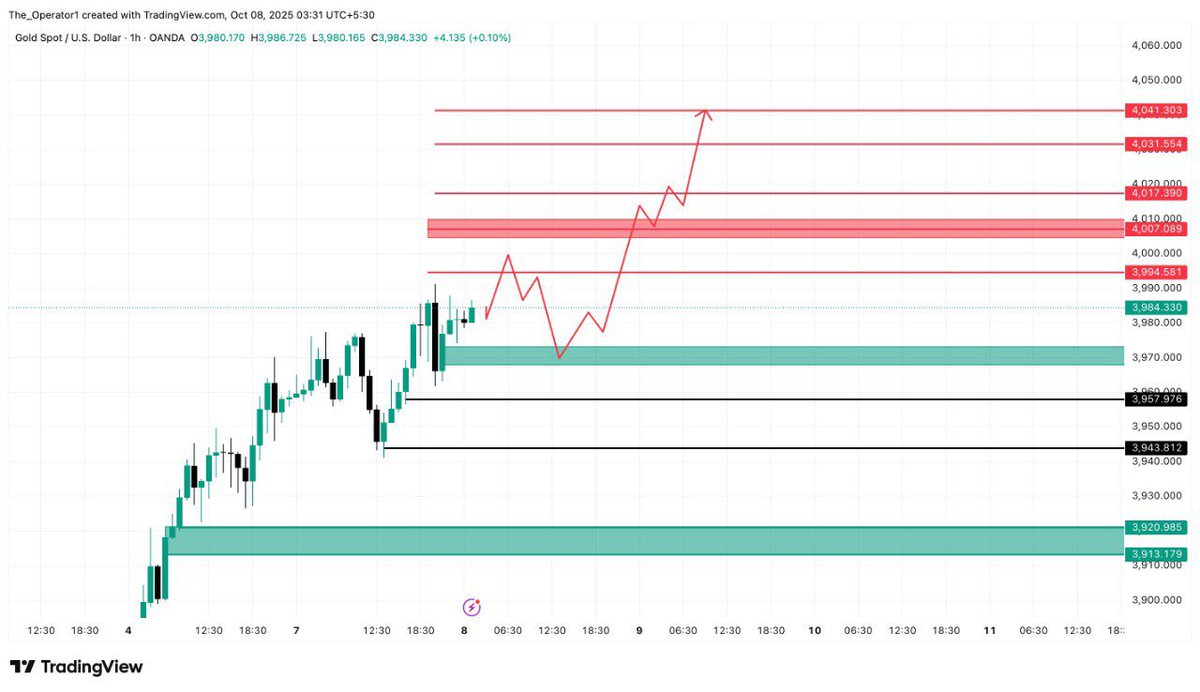
$3940 – Key Support (Institutional Zone)
$3957 – Major Demand Area
$3965–70 – Mid-Zone / Bullish Defense Zone
As long as gold stays above these levels, we remain safe in long positions.
My personal view — we could see a slow grind towards $3994 → $4007, followed by a small pullback to trap both late buyers and aggressive sellers.
But eventually, I expect a strong breakout above $4000, leading to targets at:
👉 $4017 → $4031 → $4040
💎 Conclusion – Stay With The Trend
I’m already holding my big swing trades, sitting on great profits, and so is my community.
Remember guys — the trend is bullish.
Gold might show small intraday dips, but don’t get manipulated.
Trade what you see, not what you think.
I hope you liked this simple yet powerful analysis.
If you’re still not part of THE OPERATOR Telegram group, you’re missing massive opportunities — so join now and start trading with confidence and precision. 🚀
THE OPERATOR OF $XAUUSD 🧿🥇
https://t.co/Nm11omkLEV
> Chalk powder in atta
> Brick powder in chili
> Detergent in milk
> Sand in pulses
> Poisonous Diethylene glycol in kids cough syrup
The fact that some people are doing this fully knowing it can kill others shows how far we’ve fallen as a society
A profound decay of humanity!