Here is what you all need to understand.
I'm going to explain this in detail for you so you know where we are, and why this is nothing like 2021.
Bitcoin, and the rest of the market, are liquidity vessels.
Their cycles are NOT dependant on an arbitrary 4 year number.
But they ARE dependant on the wider liquidity and business cycle, which is totally different this time.
And you can see here on this chart that BTC mirrors exactly the:
- COPPER/GOLD chart
- ISM/PMI chart
So what are these?
The COPPER/GOLD chart is one of the best indicators to understand that state of the economy.
COPPER is one of the most widely used metals on Earth for almost all form of building and development.
When COPPER is pushing higher, it is because the economy is expanding and the demand for it is high.
GOLD, is used as a hedge and safety trade, and when that is expanding, it is because the global market is shaky and people are keen for too much risk.
What this means overall is that when COPPER/GOLD goes up, COPPER is stronger because the demand for that is higher(expansion globally) and GOLD is trending lower, because everyone is more risk on.
You can see very clearly that when COPPER/GOLD goes up, BTC moves at the same time and always has.
At the bottom of the chart we have the ISM/PMI, which is the index used to understand whether the economy is expanding or contracting.
Historically, when this is below 50, like it is now, the economy is contracting.
When this happens, as you can see, COPPER/GOLD goes down and so does BTC.
Literally in unison.
And right now, we are in the longest contraction of PMI ever recorded.
When PMI ticks over 50, we enter expansion and COPPER/GOLD also goes up... and yes, so does BTC.
So what does this tell us?
Well, look at 2021.
COPPER/GOLD had been expanding for months and was topping out, just like PMI.
In 2021 we were at the peak of the business cycle and only massive contraction lay ahead.
Right now, COPPER/GOLD is bottoming and PMI is grinding up towards 50+.
All at the same time as we are about to come out of the longest liquidity contraction ever, and into easing.
Ask yourself...
Do you think this is all a coincidence?
That this has been the longest contraction cycle, and the longest COPPER/GOLD and PMI contraction also?
No, it is not.
And that is because ALL of this is linked.
The expansion phase of this liquidity/business cycle has not even properly got underway yet, and you can see this with your own two eyes looking at this chart.
The fact here is that BTC has been pushing higher in an overall contracting global environment, and as i keep saying, the only thing that has been pushing it higher has been institutions and government adoption.
The reason it is weak, totally different to any other bull market, and cannot sustain a true pump, whilst the altcoin market has been down only is because of what I have just told you here.
Todays conditions could not be more different to 2021...
I have made this crystal clear for you in this and many other of my posts.
If you think you are gonna get a 2022 bear market from here and you can sell or your bags now, add a massive 50x short, ride it easy, then chuck your profits into BTC at 75% down...
You're fucked.
Massive expansion is what lies ahead.
Not a deep bear market.
What goes down 👇 must come up 👆
🧵
- - -
(1/2) Lots of great work coming out lately on the correlation of Bitcoin with the ISM PMI (Purchasing Managers' Index).
I analyzed the full dataset of the PMI from 1948 - today, and found that we are currently in the LONGEST running contraction (defined by PMI < 50) in the index's history! 🤯
The AVERAGE contraction length is 1.1 years, and we are now 2.92 years into the current one, making this a 3-sigma event (an extreme outlier, by definition occurs <0.3% of the time).
What does this imply? For cyclical time series data, the force of mean-reversion tends to be stronger, the more extreme the outlier is.
To me, this, along with several other macro indicators and political/news headlines, all suggest that we soon move to RISK-ON... with Bitcoin - the king - being a primary beneficiary. WE GO HIGHER.
It’s official - the Fed is likely to begin expanding its balance sheet again soon.
For the first time since 2022.
Bad takes will likely abound on X.
Is this "liquidity positive" on the margin? (yes)
Is this "QE"? (no)
So, what's going on?
And, more importantly, what does it mean for risk asset markets?
Warning - this is a LONG post
The first step
Recently the Fed announced that QT is coming to an end.
The Fed has confirmed it will stop unwinding Treasury (Government bond) holdings off its balance sheet, but will continue to unwind its portfolio of MBS (Mortgage Backed Securities).
As the MBS continue to mature and “roll off” the Fed’s balance sheet, the Fed will then reinvest the proceeds into Treasury bills.
This would imply that the Fed balance sheet would remain roughly flat (essentially "liquidity neutral").
This process will start on December 1.
The second step
However, the Fed cannot just keep its balance sheet flat over the medium-term.
This is because of bank reserves.
Bank reserves cannot fall too low, relative to the size of the US economy - because if they do, the whole banking system starts to break (this happened in September 2019).
As the US economy grows, the financial system needs more and more bank reserves to be able to function properly.
So, at some point, the Fed will be forced to actually start expanding its balance sheet again (which will increase bank reserves).
And this “second step” (balance sheet expansion) may arrive a lot sooner than many expect.
Recently, Fed Chair Jerome Powell said:
“At a certain point, you’ll want… reserves to start gradually growing to keep up with the size of the banking system and the size of the economy.”
Also, New York Fed President John Williams made similar remarks last week.
FED'S WILLIAMS: FED MAY SOON NEED TO EXPAND BALANCE SHEET FOR LIQUIDITY NEEDS
A lot of analysts from across the banking world are now expecting this balance sheet expansion to come as early as Q1 2026 (this makes me think there’s been some “forward guidance whispers” behind closed doors).
Marco Casiraghi, of Evercore, said:
“We think the Fed will start buying enough Treasuries to grow the balance sheet again in the first quarter of next year.”
Most analyst estimates put the expected pace of this balance sheet expansion at around $20bn per month, or around $240bn per year.
To be honest - this is balance sheet expansion for ants.
$20bn might seem like a big number - but in the grand scheme of things, it’s a tiny number.
To put it in perspective - between March 2020 and June 2020, the Fed increased the balance sheet by more than $3 trillion - or more than $800bn per month.
If the Fed were to continue to expand the balance sheet at a pace of $20bn per month - it would take roughly ten years just to return to the balance sheet highs of early 2022.
These developments are not a surprise.
Fed guidance has been laying this out for years.
The plan has always been to grow the balance sheet slowly, at the same pace as GDP growth.
This is not intended to stimulate the economy or asset markets - it’s to ensure that the banking system has enough reserves as the economy grows.
Here’s a chart showing balance sheet projections from a Fed paper in early 2024.
Bills, bills, bills
Notice - the Fed has explicitly stated it is planning to purchase Treasury bills (short term - one year or less).
This is a very important distinction in terms of any potential impact on risk asset markets.
The Fed purchasing Treasury bills is somewhat liquidity positive, on the margin.
But nowhere near as liquidity positive as if the Fed were to buy Treasury coupons (2-30 year).
Technically, it’s not really “QE” unless the Fed is buying coupons.
It’s more accurately described as "reserve management” - some people may label it as “QE-lite”, but I think even this is a stretch.
In previous waves of “real QE” - like 2020 and 2021 - the Fed hoovered up huge amounts of Treasury coupons.
So, the Fed was “removing duration risk” from the market.
This is really the key asset price boosting power of “real QE” - this “removing of duration risk”.
While the Fed buying bills is still liquidity positive on the margin - it is nowhere near as “potent” as previous “real QE” waves in terms of its impact on risk asset markets, because it doesn’t affect duration.
So we have:
🔘 Balance sheet expansion for ants ($20bn per month)
🔘 “Less potent” balance sheet expansion (buying bills instead of coupons)
In my view, this very slow buying of bills will have minimal direct positive impact on risk asset markets.
But due to the avalanche of bad takes that will likely abound - the positive psychological impact may be larger.
It's likely a bearish factor for the Dollar Index (DXY), on the margin.
But wait a second...
We can now get really nerdy.
There is a plausible (and sneaky) way that this wave of balance sheet expansion could have similar effects to previous episodes of “real QE”.
And that is all to do with what the Treasury is doing.
The Treasury is constantly issuing new debt (Treasuries) to finance the Government’s ballooning debt pile.
It can choose how much of this new debt is bills, and how much is coupons.
In recent years, starting with previous Treasury Secretary Janet Yellen in 2023, the Treasury has heavily shifted issuance away from coupons and towards bills - so the “debt mix” has become much more “bill heavy”.
This does have similar market effects to “real QE” - because it’s essentially “removing duration risk” from the market (“liquidity positive” overall).
This tactic has been described as “Treasury QE”, “stealth QE” and “Yellen-omics” - and it has helped to power risk asset markets upwards in recent years.
If, in the coming quarters, the Treasury decides to push overall debt issuance even further towards bills (thereby issuing less coupons) - essentially “removing more duration risk from the market” - while the Fed is also buying bills, this would technically have similar market effects to “real QE”: the Fed expanding its balance sheet and duration risk being removed from markets.
So, to determine whether this might potentially happen - we need to watch the Treasury’s QRA (Quarterly Refunding Announcement).
The latest QRA (released last week) signals that this further curbing of coupon issuance is not likely to happen - in fact, it hints at the opposite.
Here’s the key line:
“Treasury has begun to preliminarily consider future increases to nominal coupon auction sizes”
This means the Treasury is considering increasing issuance of coupons - or “adding duration to the market” (“liquidity negative” overall).
Now, Treasury officials may be “considering” increasing issuance of coupons and they might talk big - but whether they actually do or not is another question.
If they do - this would not be good news for risk asset markets, all else being equal, and would likely completely counteract whatever the Fed is doing and then some.
It could mark the end of the “Treasury QE” gravy train.
Arguably, watching what the Treasury is doing is much more important than watching what the Fed is doing.
Here’s what we know is likely to happen:
🔘 QT stops on December 1
🔘 The first step is to keep the balance sheet flat
🔘 Then, probably not long afterwards, the Fed will start to expand the balance sheet again
🔘 This will be achieved through buying bills (not coupons) and is therefore not technically “QE” and nowhere near as “potent” as “real QE”
🔘 It will also occur at an extremely slow pace ($20bn per month)
🔘 Arguably, the more important factor here is what the Treasury is doing
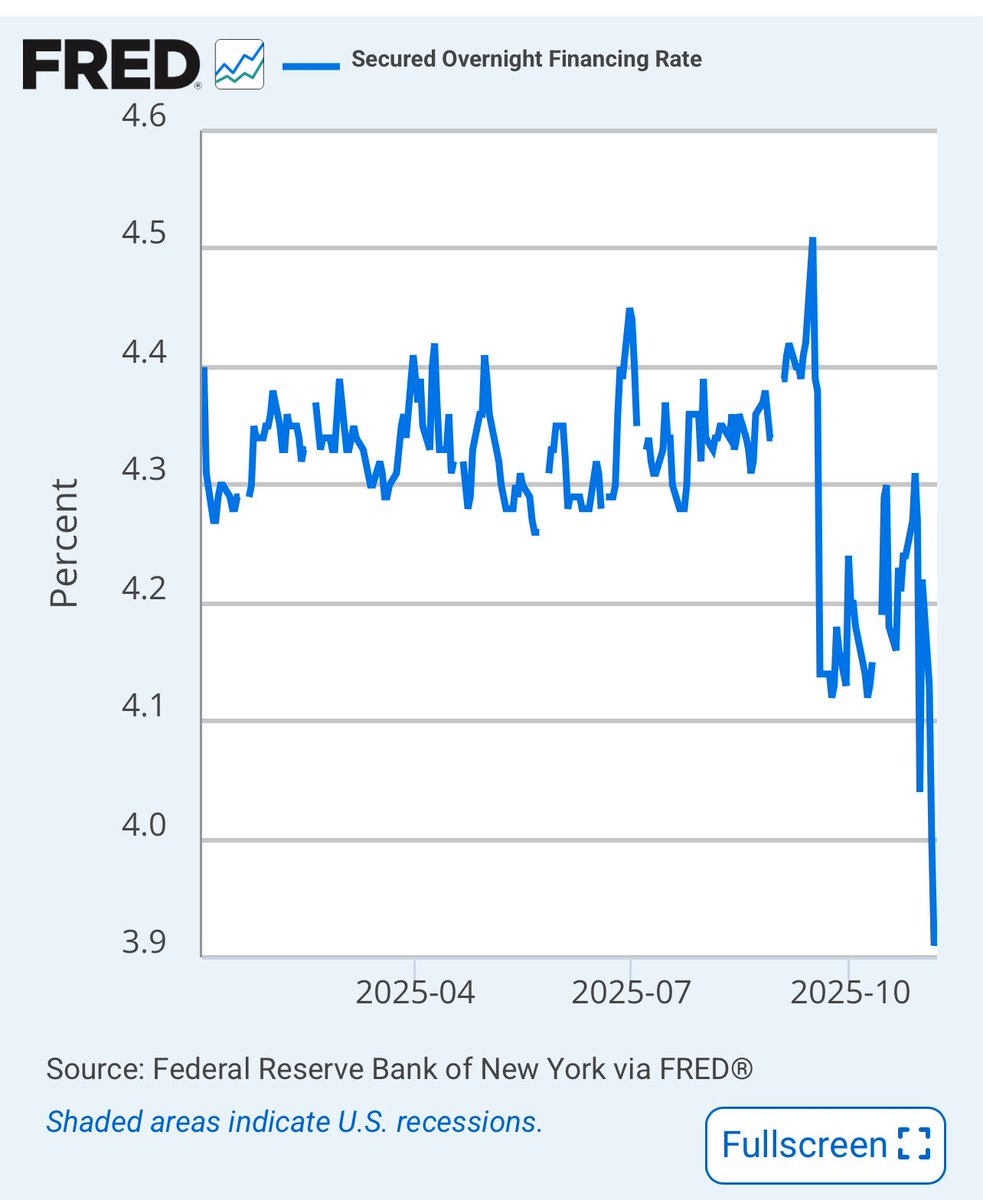
SOFR’s Drop Is The Market Front Running the Fed
That sharp plunge in SOFR is the money markets reacting before the headlines. The system is already adjusting to what’s now effectively policy: the Fed cutting twice this fall, announcing an end to balance sheet runoff on December 1, and redirecting maturing assets toward the short end of the curve. Liquidity is being rerouted. And that change matters.
What’s Actually Happening
SOFR, the rate for borrowing cash overnight against Treasuries, just collapsed because there’s suddenly more cash than collateral. That’s what happens when the Fed stops shrinking its balance sheet and starts reinvesting every maturing security. Reserves rise, collateral gets absorbed, and the cost of short term money drops.
The Fed isn’t expanding its balance sheet, but it’s changing what it holds:
•Treasuries: Every maturing note will now be rolled over, freezing the size of the portfolio and halting QT.
•MBS: Mortgage holdings will be allowed to run off, with proceeds redirected into Treasury bills, the most liquid assets in the world.
•Result: The balance sheet stops shrinking, but its liquidity velocity increases. That’s not QE by name, but it acts like it.
How It Ripples Through the System
Front End (Bills & Repo)
With the Fed buying T bills, collateral scarcity disappears. Dealers find funding easier, repo rates (and SOFR) drop, and short term yields sink toward the floor of the policy range. The one to three month space becomes the new carry trade.
Banks & Funding
Cheaper overnight money eases funding stress and cushions balance sheets. Liquidity ratios look healthier. But easy funding always reignites leverage…basis trades, structured credit, and synthetic duration quietly return.
Credit & Risk Assets
Lower funding costs tighten credit spreads and boost valuations. It’s not a full blown stimulus, but it behaves like one. Corporates refinance, junk issuance rises, and equity multiples expand on the illusion of easier conditions.
Housing & Mortgages
The Fed’s pivot away from MBS means mortgage rates won’t follow the front end down one for one. Refinancing improves slightly, but housing won’t get the same liquidity tailwind. The liquidity flow is going to markets, not Main Street.
Long End of the Curve
The 20 and 30 year yields holding near 4.7% reveal the underlying truth…fiscal supply remains massive, inflation expectations sticky, and global buyers cautious. The short end can ease, but the long end keeps reminding us where the real strain sits.
The Calm Is Manufactured
Dropping repo rates look like stability, but this calm is engineered. The Fed isn’t stimulating demand, it’s suppressing stress. By managing where liquidity goes rather than how much there is, the system stays orderly on the surface while leverage quietly expands beneath it.
Markets love this version of control. Funding gets cheap, volatility fades, and asset prices levitate. But it’s not organic growth, it’s sedation.
What To Expect Next
•An anchored front end around 4%, as T bill demand absorbs new supply.
•Rising hidden leverage,
more carry trades and balance sheet stretching.
•Falling cash yields, the 5% era for money market funds is ending.
•A softer dollar. cheaper U.S. funding trims its global carry premium.
The Bottom Line
SOFR’s drop is the first tremor of a familiar pattern: re-liquifying the system without saying it out loud. It stabilizes markets, props up valuations, and stretches the cycle but it doesn’t fix the imbalance beneath it.
Liquidity always feels like safety on the way in. But underneath, it’s still leverage waiting for a spark.
When you factor in the definitional changes for H.8 Loans to Nondepository Financial Institutions (NDFIs)🔴, approximately 80% of Total Loans⚫️ originated by the Banks since SVB failed have been to NDFI's - not direct to consumers or businesses