Next month, @timdugganbooks will publish my big climate book, The Uninhabitable Earth, in which I try to take a very broad, and very long, view of the state of the climate crisis and all the ways it promises to transform how we live on this planet—all of us. (1/x)
This piece from Charlie is excellent on our bizarre political economy where everything is kinda propped up by Jensen Huang's contradictions not spiraling out of control
Human-caused climate change has nearly doubled the likelihood of extreme fire weather in the Canadian Shield forests in 2025 and increased the likelihood of a third record-breaking year in terms of area burned by a factor of 10, new State of Wildfires report finds.
Read more: https://t.co/OSgJjT980U
NEW: The @nytimes confirms that ICE deliberately electronically "disappeared" tens of thousands of people in detention and ordered contractors to refuse to reveal where they're held to family or lawyers.
30% of all immigrants detained in ICE jails now have their location hidden.
It’s wild to hear Amodei talk about being a company that “society trusts” to “get the risks right,” when Anthropic is racing toward recursive self-improvement and superintelligence in flagrant defiance of the public’s will.
In 1931, American sociologist F.A. Woods made a remarkable observation: Historically, "literary and artistic" men ended up having very few kids and were often childless. Voltaire, Bacon, Raphael, Michelangelo, Kant, Locke, Alexander Pope, Samuel Johnson, Hume, Gibbon, Pascal, Hobbes, Swift, Leonardo da Vinci, Carlyle, and J.S. Mill were all childless, and many never even married.
Furthermore, Woods looked at a sample of prominent Englishmen in an encyclopedia (Who's Who of England) and saw that "artists and authors" had half as many kids as the average notable.
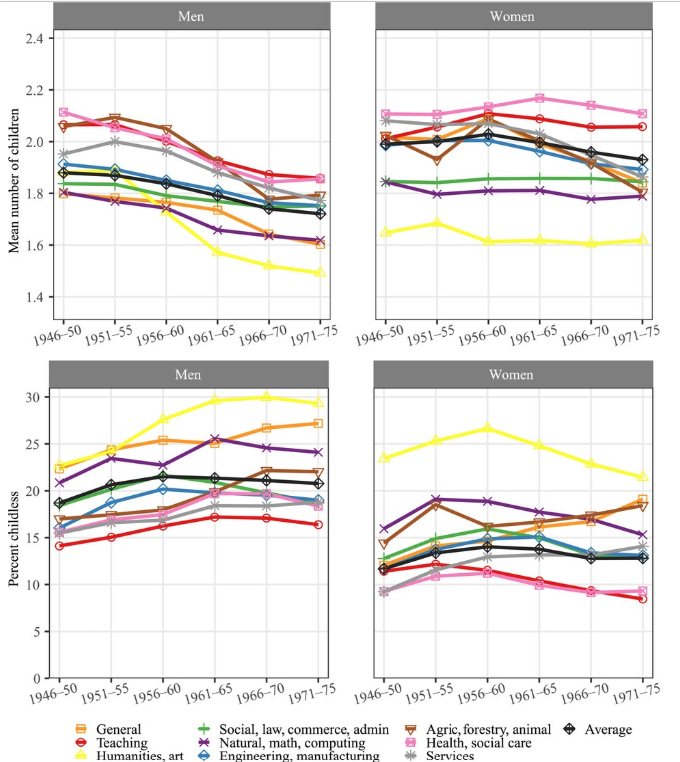
Woods's preliminary observations, made almost a century ago, seem to be confirmed by this massive study looking at the completed fertility of over 600,000 Swedes by educational field. Men and women who studied art and humanities have a much lower number of children and much higher rates of childlessness than people in any other field of study.
The “I believe that in X months there is a Y% chance that we’re all dead” genre of post is getting really tiresome. there should be, at the very least, social consequences for the people who were spouting this nonsense when we look back a few years from now and it revealed to have been ridiculous. Falling back on “hey hey I said it was only 30%” shouldn’t be able to save them.
"Miami-Dade saw the third-largest numeric population decline among US counties in 2025, data show, following LA & Pinellas counties, which saw the largest & second-largest declines, respectively" https://t.co/JjFJjhN6IM
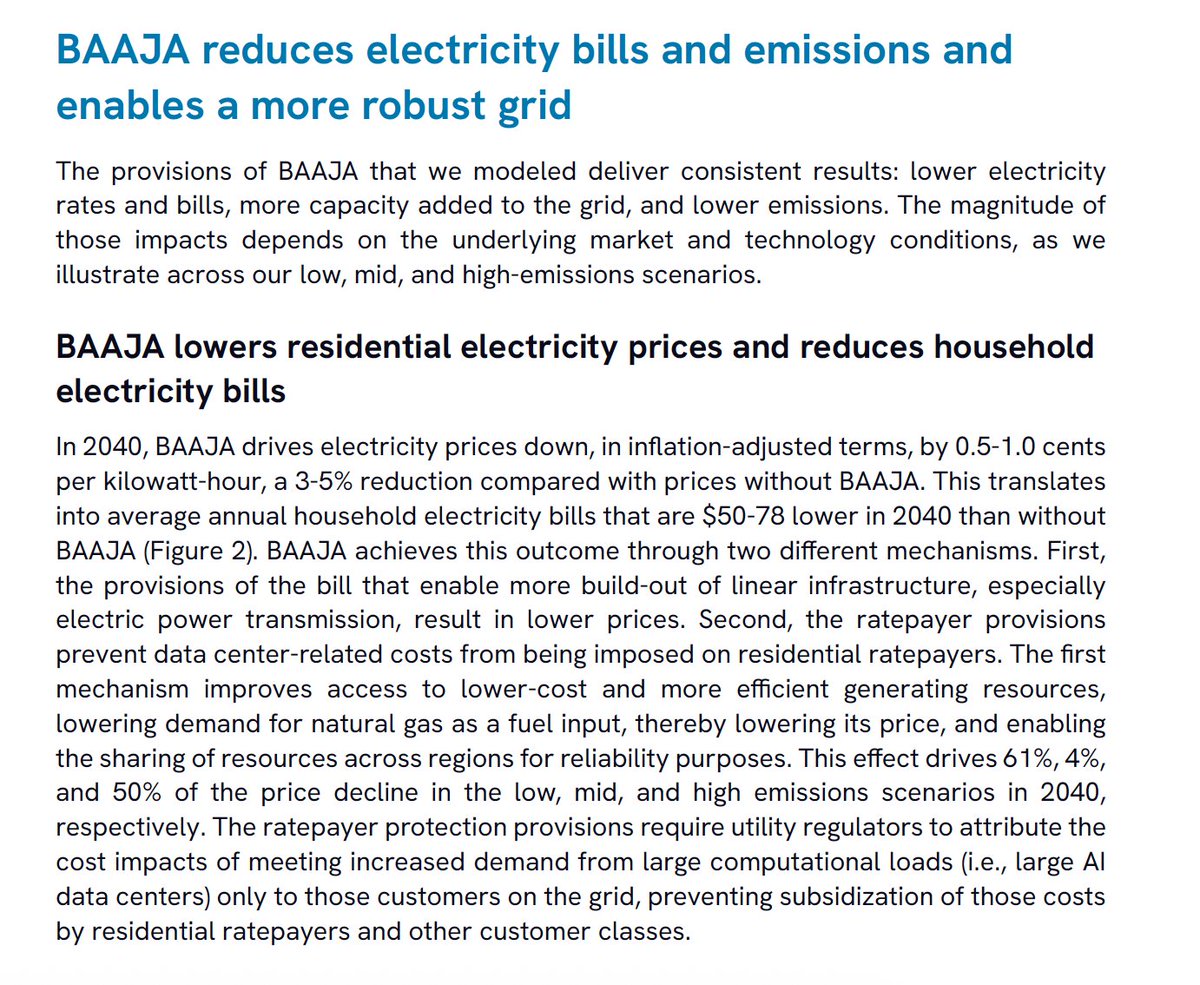
Many debates about this bill aside—have seen good arguments on either side—I'm a bit mystified by the framing of it as a critical test of Dems' willingness to deliver affordability to voters, esp. relative to 2028. Rhodium modeling shows it'd lower bills by ~$4-7 a month in 2040
Lot of the people throwing money at the "you'll all get puppies and rainbows" guy like to jeer at healthcare and housing for all as a ludicrous pipe dream
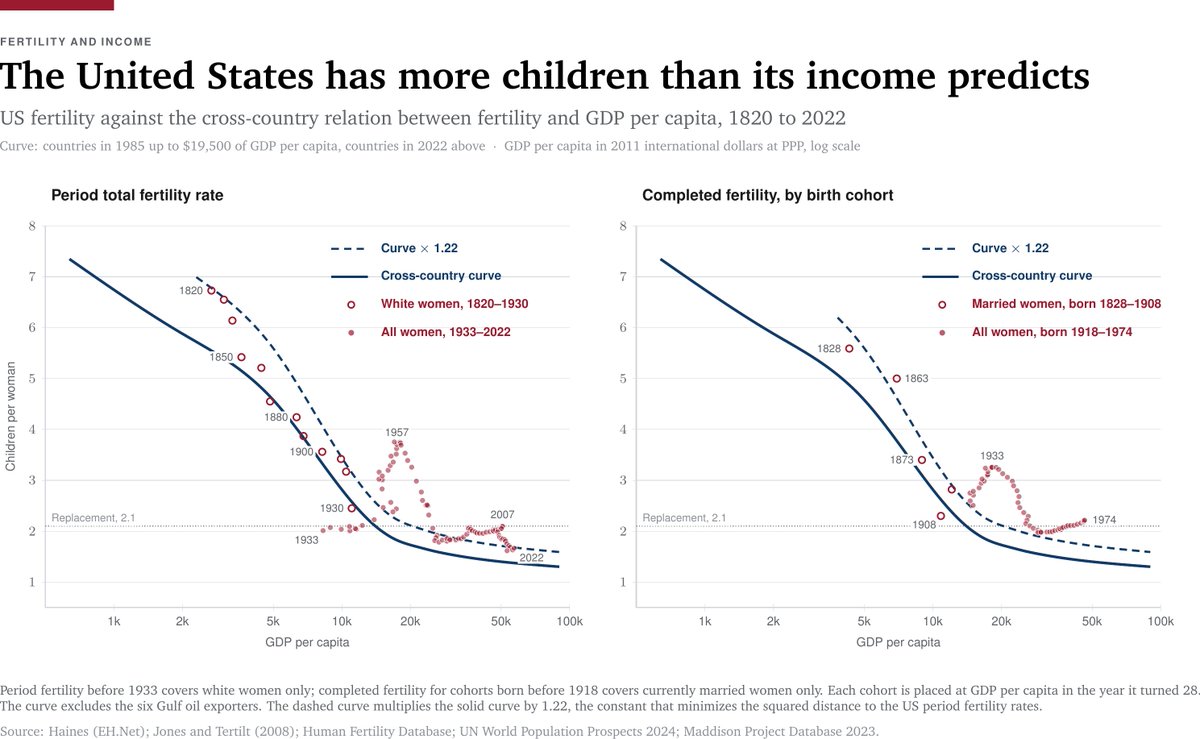
The United States has a total fertility rate of 1.57 children per woman. Many people ask why it is so low. That is the wrong question. The right question is why it is so high. At American income levels, the typical country has about 1.34. In fact, the United States has always had exceptionally high fertility given its income.
Let me explain. You can decompose a country’s fertility rate into three components: an income curve, a country-specific component, and a timing component. The income curve shows the fertility rate of the typical country at a given GDP per capita. That is, we look at all countries and calculate the average fertility rate for a country with, say, $10,000 in income per capita (in purchasing power parity, to control for differences in price levels). The country-specific component shows how much a country sits above or below that curve because of its own features: religiosity, family structure, social values, etc. The timing component captures the booms and busts that move births from one year to another (e.g., an economic boom, a depression, or a war).
To build the income curve, I use the 1985 cross-section of countries up to $19,500 in GDP per capita and the 2022 cross-section above that level (both in 2011 dollars, that is, controlling for inflation). The two curves meet almost perfectly at $19,500: the same fertility rate and the same slope. I drop the six Gulf oil exporters because their wealth comes from oil rents, not from economic development.
The curve uses no time-series data for the United States. It comes from a cross-section of 157 countries in 1985 and 2022, with the United States as just one more point. I use 1985 data because, last Monday, I showed that the relationship between fertility and income across countries, which had barely changed for many decades, shifted after 1985. I use 2022 data for very rich countries because, in 1985, there were almost none, making it impossible to accurately predict a “typical” fertility rate.
For the United States, I use two series. The first is the period total fertility rate (TFR) from 1820 to 2022 (for white women before 1933, from Michael Haines, and for all women after 1933, from the Human Fertility Database). The second is completed fertility, the number of children women in each birth cohort actually had over their lives, for cohorts born between 1828 and 1974 (for married women before 1918, from Jones and Tertilt, and for all women after 1918, from the Human Fertility Database). I place each cohort at the GDP per capita in the year the cohort turned 28.
In the figure, you will see that the cloud of points for the United States is nearly always above the income curve. So I multiply the income curve by a single number, 1.22, to best fit the US data. With that one number, the curve predicts 6.8 children per woman at the US income of 1820, when white American women had 6.7, and 1.68 at the US income of 2022, when American women had 1.67. Two centuries apart, and the same curve, scaled by the same number, gets both ends right. The United States has followed the income curve remarkably well for over two centuries, but it has stayed 22% above it!
That is, if I tell you that the average country on Earth was doing in terms of fertility in 1985 at $10,000 (none of which was the United States), and you multiply that number by 1.22, you get the United States’ fertility when US income per capita was $10,000. In 1985, the average country with $10,000 of GDP per capita had 2.82 children per woman. Multiply by 1.22, and you get 3.44. In 1910, when US GDP per capita was $9,916, white American women had 3.42 children. You got to love econometrics!
What do I learn from this?
First, nothing about the United States’ fertility is exceptional in terms of its movement along the income curve. The United States has followed the fertility pattern it was supposed to follow.
Second, what is exceptional about the United States is that American women have had about 22 percent more children than women in the typical country at the same income, and they have had them since at least 1820. My guess is that the reasons are cheap land (first the frontier, now suburbs and housing far cheaper than in Europe or East Asia), relatively high religiosity, and an economy where having a third child does not end a career. Given the United States’ income, its fertility rate should be around 1.34, not 1.57. The extra 0.23 is the United States’ country-specific factor.
Now the timing component. In the TFR, the Great Depression puts the United States at 2.0 children per woman below the scaled curve in 1933, and the baby boom puts the country 1.5 children above in 1959. But a lot of this is just timing. In completed fertility, both gaps shrink: women born in 1908, who had their children during the Depression, sit 0.9 below the scaled curve, and women born in 1934, the mothers of the baby boom, sit 1.1 above. Much of what looked like a collapse of fertility in the 1930s and an explosion in the 1950s was American women postponing births and then catching up (with some under- and overshooting).
So, if you think that either the Great Depression or the baby boom somehow contradicts the downward-sloping income curve, you are confusing a high-frequency movement with a low-frequency one.
In summary: the United States is not exceptional in how its fertility responds to income. The United States has followed the same income curve as every other country, with a higher level. The big swings everyone remembers (the Depression and the baby boom) were short-run deviations that one should expect given historical events.
I find it amazing that we are supposed to carry on with our professional and personal lives as if the tech insiders telling us we are all going to die or be slaves "pretty soon" is not, you know, a thing that might stop us in our tracks and demand immediate, collective politics.
Terrific @TheAtlantic piece on archaeologists' and anthropologists' slowly dawning realization that now-submerged areas on the coastal shelf--swathes of land drowned when the glaciers melted--may be where much of our species' early history took place. (Link in reply)
Silicon Valley types are seriously under-estimating the financial and legal risks they face for openly engaging in what they themselves frame as behavior that can place an enormous number of human beings at risk of various sorts.
Is AI progress accelerating? 🧵
1. Frontier AI rate of improvement on ECI has been fairly consistent. Fable 5.2's non-final ECI is a bit above trend. The big change is that Anthropic, in purple, has come from behind to take the lead.