Ever struggled to get the cumulative emissions point across to your cranky uncle? @johnlangab's latest #infographic introduces a new climate character, 'Brick', so that task can become a touch less onerous. Inspired by @KHayhoe. @johnfocook
https://t.co/HKU6j1YGIs
If a picture is worth a thousand words, a 750,000 word IPCC report is logically worth 750 pictures.
Net Zero Tracker lead @johnlangab's third visual instalment of the latest #IPCC#AR6 reports:
https://t.co/RTZLBLw0MT
Check out this cool @NetZeroTracker infographic that clearly explains the recommendations of our UN Expert Group to ensure the integrity of net zero pledges of business, financial institutions, cities & regions! Thanks @johnlangab!
Today's all about climate #finance at #COP26.
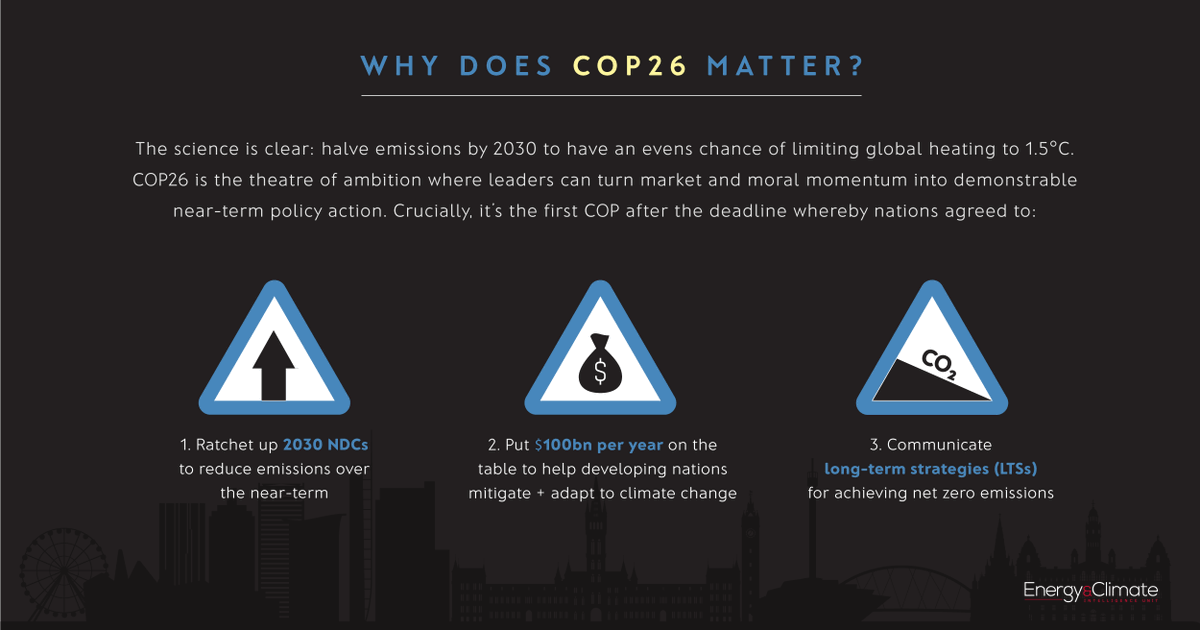
Wondering what it's about and why $100bn is the magic figure? Check out @johnlangab's latest #infographic for more 👇
https://t.co/bVwzqti9Ic @ECIU_UK
The Heat is On🔥🌍
A world of climate promises not yet delivered
Today we’ve publish the @UNEP#EmissionsGap report
Good news:
we are doing increasingly better closing in on 2°C
Bad news:
it is still far from meeting the goals of the #ParisAgreement
A short thread (1/n)
Here's the #COP26 infographic from @johnlangab @ECIU_UK mentioned at the end of this week's episode: https://t.co/ASRzgGM8Bt
Listen to the first in our series on COP 26 at https://t.co/BrVgmsAbmJ
Lovely to see @ECIU_UK’s @johnlangab getting a bit of love for his genius #COP26 infographic and, well, the rest of his infographics too https://t.co/cqQqMCJeHS @CIWEM https://t.co/HBJZ7ztewm
John Lang: we interview the man behind the game-changing, #COP26 infographic. Need a cheat sheet to the @UNFCCC's annual climate event? This is it!
Read more and view the infographic here: https://t.co/2b5QXjoTng
@johnlangab @e_nviro@ECIU_UK@ClimateTrunk@ConsultClimate@ucl
ANNOUNCEMENT 📢 Alongside our new partners @OxfordNetZero@newclimateinst and @datadrivenlab, we’ve begun working on a project to bring clarity to the *quality* of #netzero targets globally. Countries, regions, cities and companies. Please watch this space! 👀
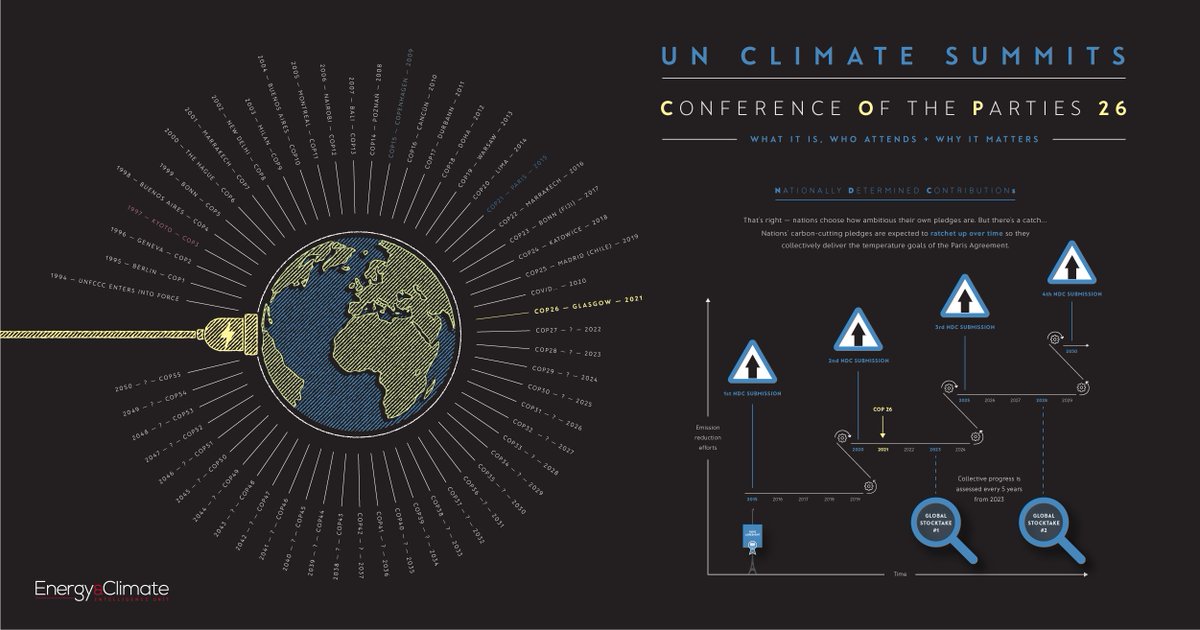
UK hosts #COP26 in November, the most important climate summit since #ParisAgreement, critical to keeping 1.5°C goal alive & for rich countries to stump up $100bn/yr for poorer nations' #ClimateAction. But what is COP? See @johnlangab's excellent guide 👇🏻
https://t.co/95FM1iQXiy
.@ECIU_UK's @johnlangab puts the @COP26 in a wider context using an infographic and explains: what a COP is, who attend, and why the #COP26 matters.
Just amazing!
#NetZero#ClimateAction
https://t.co/F9ZjuiSabv
What is #COP26 all about OR how I learned to hate climate change and love incredible infographics (by the one and only @johnlangab and @ECIU_UK)
https://t.co/nq0M8vKzRU
Six months until the UK hosts #COP26 - but what is COP, and why is this one so important? @johnlangab explains all in this infographic:
https://t.co/sXg5TXA9nc
#COP26: A visual guide
@johnlangab puts COP26 in its wider context and provides a visual explanation of what a COP is, who attends it and why this one matters.
See the guide here https://t.co/LWwIfspbih
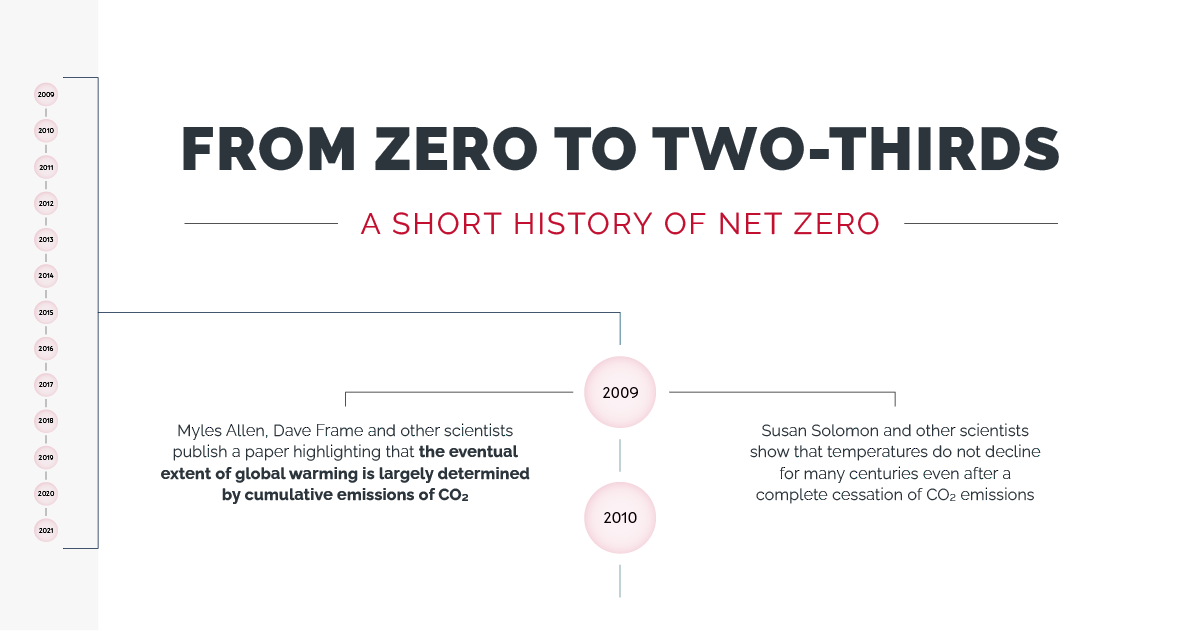
Our latest #infographic provides a short history of #netzero. Plucked from our latest report, Taking Stock, this 12-year timeline starts in 2009 with the publishing of a scientific paper... https://t.co/EbZzOPEeGN by ECIU's @johnlangab
Now in the 6 UN languages, IPCC Working Group I’s infographic from #SR15 explores what kind of world we could be living in in 2100.
Take a tour into three possible futures depending on the action we take today.
Explore here 👉 https://t.co/T4KXYLbrpX
#ClimateChange