Official channel of {easystats}, a collection of #rstats 📦s with a unifying and consistent framework for statistical modeling, visualization, and reporting
🤯📈 TAKE YOUR STATS SKILLZ TO THE NEXT LEVEL WITH THIS #R PACKAGE
🔥The @easystats4u {modelbased} package (the successor of #ggeffects) is now published in @JOSS_TheOJ
https://t.co/A897NTJMzZ
Check it out for a demystification of marginal means, contrasts and effects #rlang
@viv_analytics @SophieStats10 Yes, you may look at the {parameters} pkg: https://t.co/xdodfdHKZb
Tidies output, if desired, but also prints nicely and offers a lot more features (standardizing, robust standard errors, effect sizes, ...)
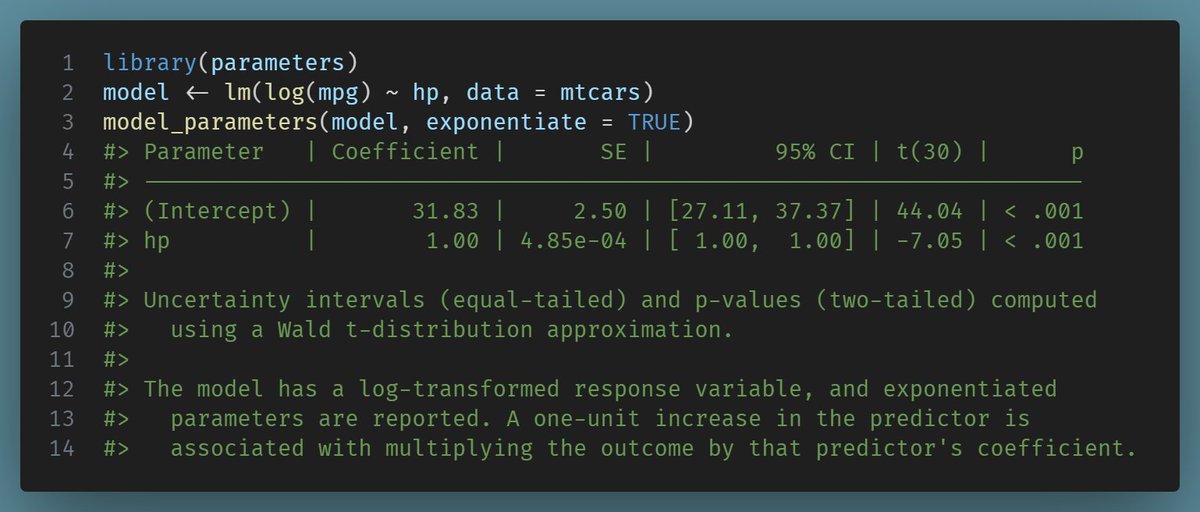
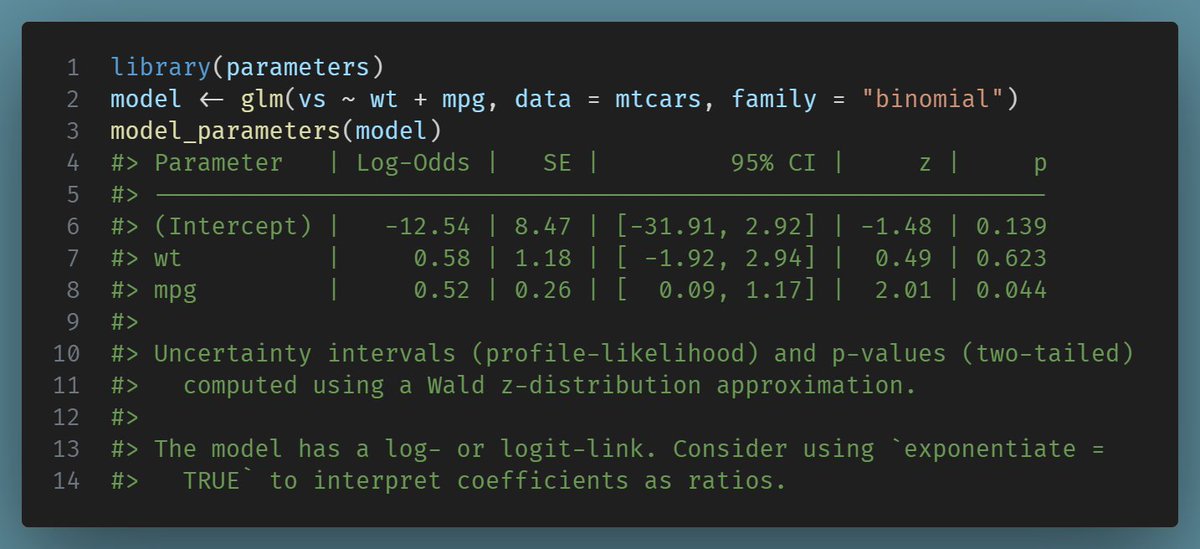
We're working on revisiting and homogenizing outputs from our #easystats packages. This includes consistent coloring of information/warnings/messages, but also: which information is useful in the output, which information should just go into the docs? WDYT?
Which of the following information below model output (last paragraph, not that one about uncertainty intervals) do you find useful/helpful and think it's worth printing? It's printed once per session. Should some/all information moved into the docs, or kept in output? #easystats
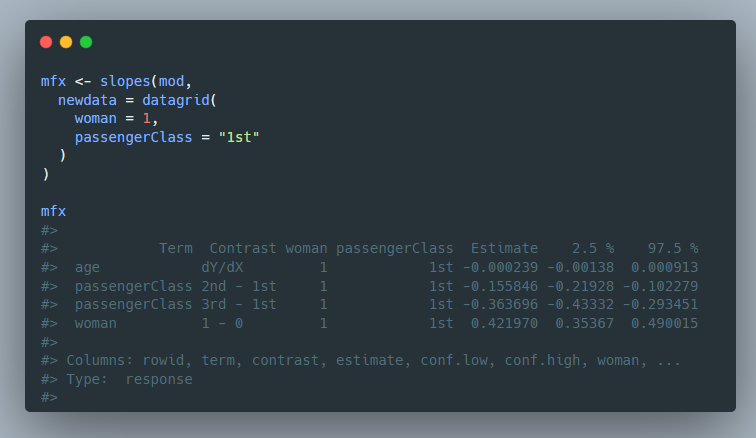
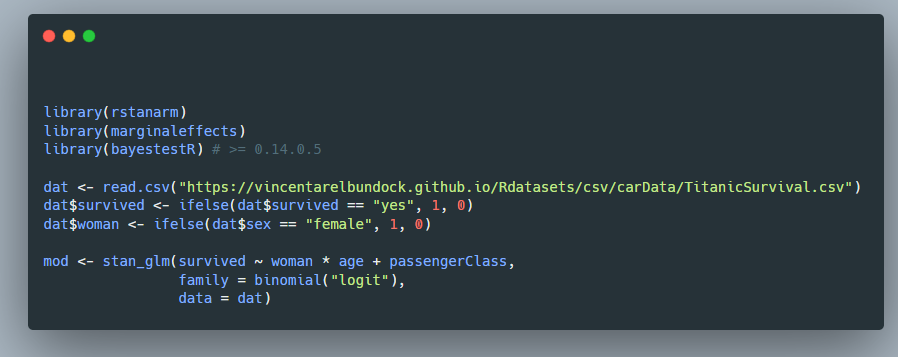
{bayestestR} makes it now much easier to process inputs from packages {marginaleffects}, {emmeans}, or random variable types from posterior draws!
#easystats#rstats
New update to {bayestestR} expands support for a tidy workflow -
working better with tidy inputs, `rvar`s, and post-modeling estimates, and generating tidy outputs!
@easystats4u#rstats
🧵
https://t.co/i95bgVxfKI
@schneidysenses@dp_moriarity When you install the easystats-package from CRAN, and then run `easystats::install_latest()`, does that resolve the issue for you?
NEW to {bayestestR} dev version - support for #marginaleffects!
Take it for a test drive: remotes::install_github("easystats/bayestestR")
@easystats4u#rstats
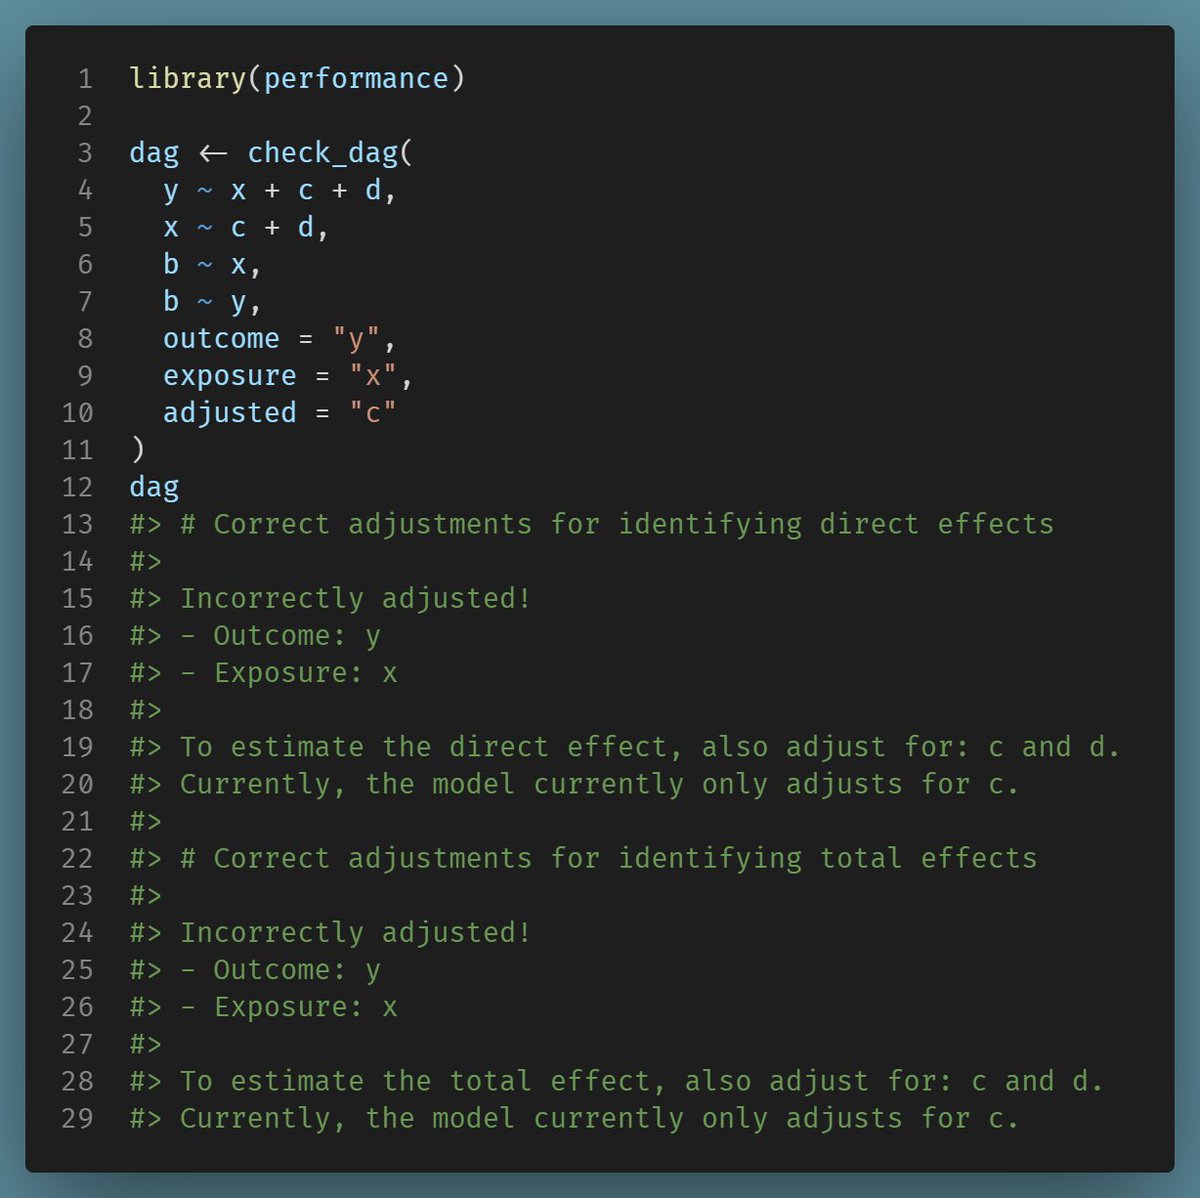
A new feature that *might* be added to our #rstats#easystats packages soon: checking models for correct adjustment by using DAGs! `check_dag()` (working title) makes it so easy to check the causal paths of your model and tells you how to address misspecifications!
A new feature that *might* be added to our #rstats#easystats packages soon: checking models for correct adjustment by using DAGs! `check_dag()` (working title) makes it so easy to check the causal paths of your model and tells you how to address misspecifications!
Are you working with mixed (multilevel) models in #rstats and wondering how to calculate R2? Grab the latest updates of our #easystats {performance} and {insight} packages from CRAN and try out "r2_nakagawa()" (or simply "r2()" for mixed model):
https://t.co/WG374eDB43 /1
We improved the accuracy for many new model families and validated the results against examples from the paper that has proposed this method: https://t.co/b0S99cIWEp
"r2_nakagawa()" is probably one of the most accurate functions to return R2 for mixed models in #rstats.
Today Tom Geva (from @bengurionu's Statisticas and Data Analysis program) presented the work he's done over the last few months for @easystats4u's correlation package 👏
#statstab #129 Structural Models (EFA, CFA, SEM, ...) w/ {parameters}
Thoughts: Lots of debate about #EFA vs #CFA; very confusing. Once I figure out what to use, this #R package seems to have lots of functionality.
#rstats#factoranalysis#r#stats
https://t.co/gDY41o2g6h
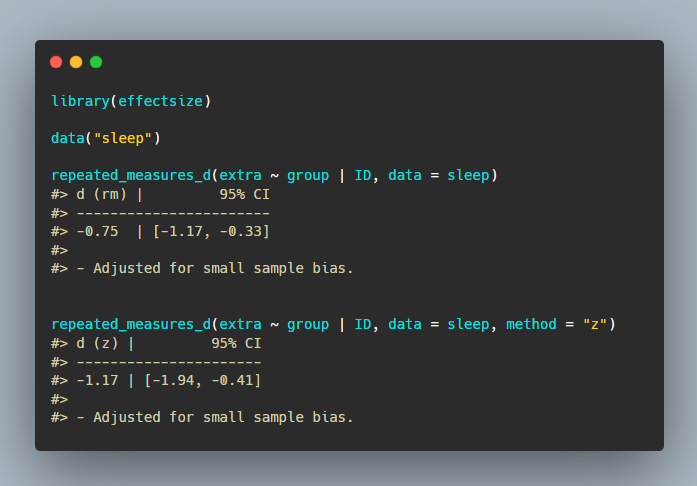
{effectsize} has been updated!
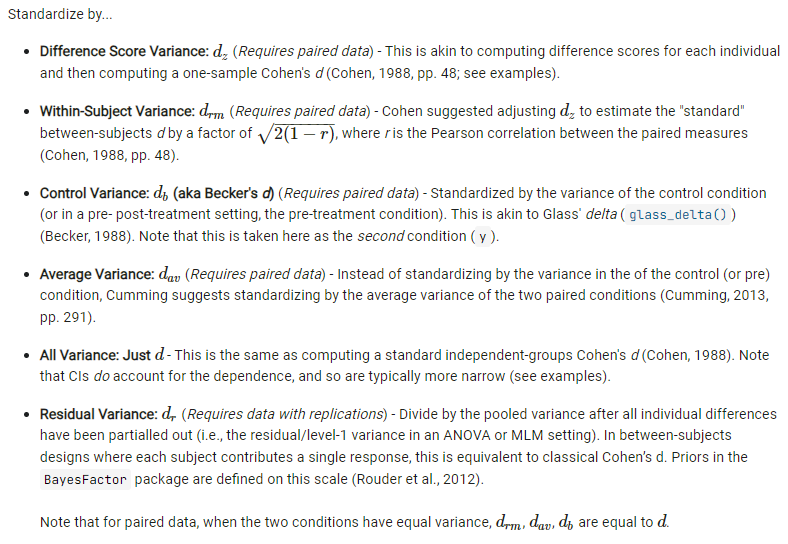
This update includes the new repeated_measures_d() function that can compute not 1, not 2, but 6 (!) types of standardized mean differences for repeated measures.
Try it out:
https://t.co/UuD8QvqPQS #RStats
You may think it's just s small addition to one of our packages, but overall, the many small pieces form a marvelous "R Framework for Easy Statistical Modeling, Visualization, and Reporting" #easystats
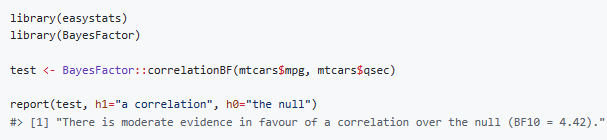
A long overdue little feature just dropped: report() now works with #BayesFactor objects.
Use it to make your stats reports more reproducible and easy to read.
#Rstats@easystats4u
🚨New publication in Behavior Research Methods!🚨
We review outlier detection methods and how to achieve them in R using #easystats' {performance} 📦
📄paper: https://t.co/4RIbfKfCEd
📃preprint: https://t.co/UMD3CEYgAG
💻performance: https://t.co/k8DkbIyG9W
#rstats
read the case study how to arrive at the best model fit (https://t.co/rUdEzG1DJv), using `check_model()` and other tools from the {performance} package. Want to use the latest features? Install the {easystats} package from CRAN, run `easystats::install_latest()` and have fun! /3
Checking model assumptions is important, and doing so requires accurate tests and visuals appropriate for the given model. Hence, we revised our #easystats#rstats packages {see} and {performance}, which now provide methods to simulate residuals for complex models, to perform /1
accurate tests using simulated residuals, and improved diagnostics plots (in particular, Q-Q plots). Check out the two vignettes how to check your model based on simulated residuals (https://t.co/zHsoLiFjCR) and /2