@danielrock Just glanced at the posting, thought I’d let you know that authorship in Econ is almost always alphabetical, so looking for “first author papers” is going to select pretty hard in ways you probably don’t care for
@CiaranB91092310@cremieuxrecueil I think it's a v simple analysis. They look at the people with CF who died in 2008, find the median age, and then repeat that exercise in 2022.
But, agree that because that 66 year old wasn't 26 in 2008, seems like these are different populations and interpretation gets fuzzy.
@TheZvi Anything by Scott Warren. Super strong sci-fi and fantasy writer. Want a nerdy econ-y fantasy story? Dragons banker. Want fantasy mystery? Sorcerous crimes division. Want grungy sci-fi- with mechs? War horses. Want raidery sci-fi where humans are tech scavengers? Vicks vultures.
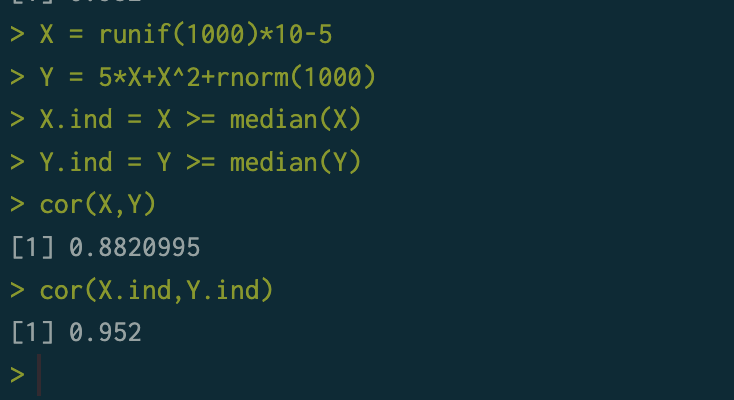
@Tyler_Menzer@MatthewBJane Pushing back on that a bit. The example plotted above is both linear (E[Y|X] = X) and you could drop outliers or winsorize at pretty much any threshold and the indicator correlation is still higher. Spearman doesn't help. It is just that the population indicator correlation is 1.
@SweetLikeGravy@CharlieBaranski So like... the count data is basically non-existent for most of those languages. If you wanted to exclude languages spoken by <15 people in the US, I have no idea how many would vanish. (20? 800? could be either depending on details of how that list got made that aren't public).
@SweetLikeGravy@CharlieBaranski Frankly, was not easy to come up with that number. Because census has prickly views about privacy, "The full list of languages is not available in data products or public-use files" (quote from p. 6 here https://t.co/BqkyJUPjGy)
@SweetLikeGravy@CharlieBaranski Those US numbers appear related to the 380 "language groups" US Census provides details on from its small annual surveys (ACS). But since 2016 the ACS collects data on a list of at least 1,334 different languages -- based on the ones it has observed.
https://t.co/KJA6cyA1jE
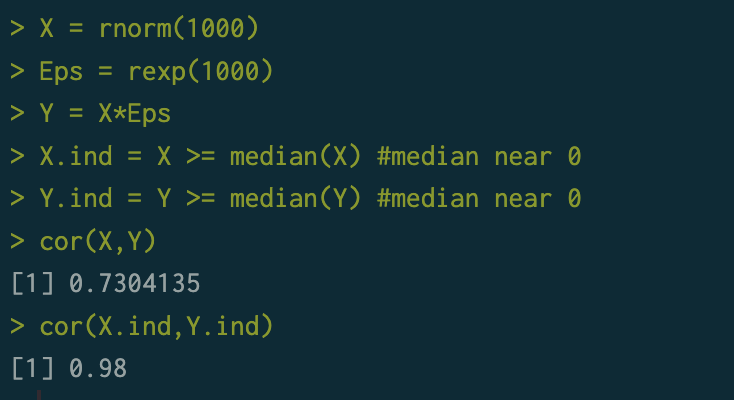
@MatthewBJane@Tyler_Menzer I think the following would increase the correlation with median cutpoints:
X ~ N(0,1), Eps ~ Exp(1), Y=X*Eps. R code of example below
@SolomonKurz Everyone else is making this too complicated. It is not necessary at all, but normality of the residuals makes it very easy to prove to people with limited math background that the coefficient estimates will be normal (ie you can do it without a CLT or LLN) allowing inference.
It's unclear to me when it became official, but sometime in the last two months I got a PhD!
I'm extremely thankful to many people for their help. I'm pleased that many friends graduated. And it still hasn't really sunk in that I'm done.
Pre-hooding pic featuring @jianfei_cao


![econdowd's tweet photo. @Tyler_Menzer @MatthewBJane Pushing back on that a bit. The example plotted above is both linear (E[Y|X] = X) and you could drop outliers or winsorize at pretty much any threshold and the indicator correlation is still higher. Spearman doesn't help. It is just that the population indicator correlation is 1. https://t.co/Ema9RgelU4](https://pbs.twimg.com/media/GBGum75WoAAwCe-.jpg)