I love the cadence of this chart
Bitcoin % of Supply in Profit/Loss
As I said previously, you start looking for major market cycle bottoms *after* they cross, not before.
They just crossed.
Such a great chart for keeping people on the right side of the market in midterm years
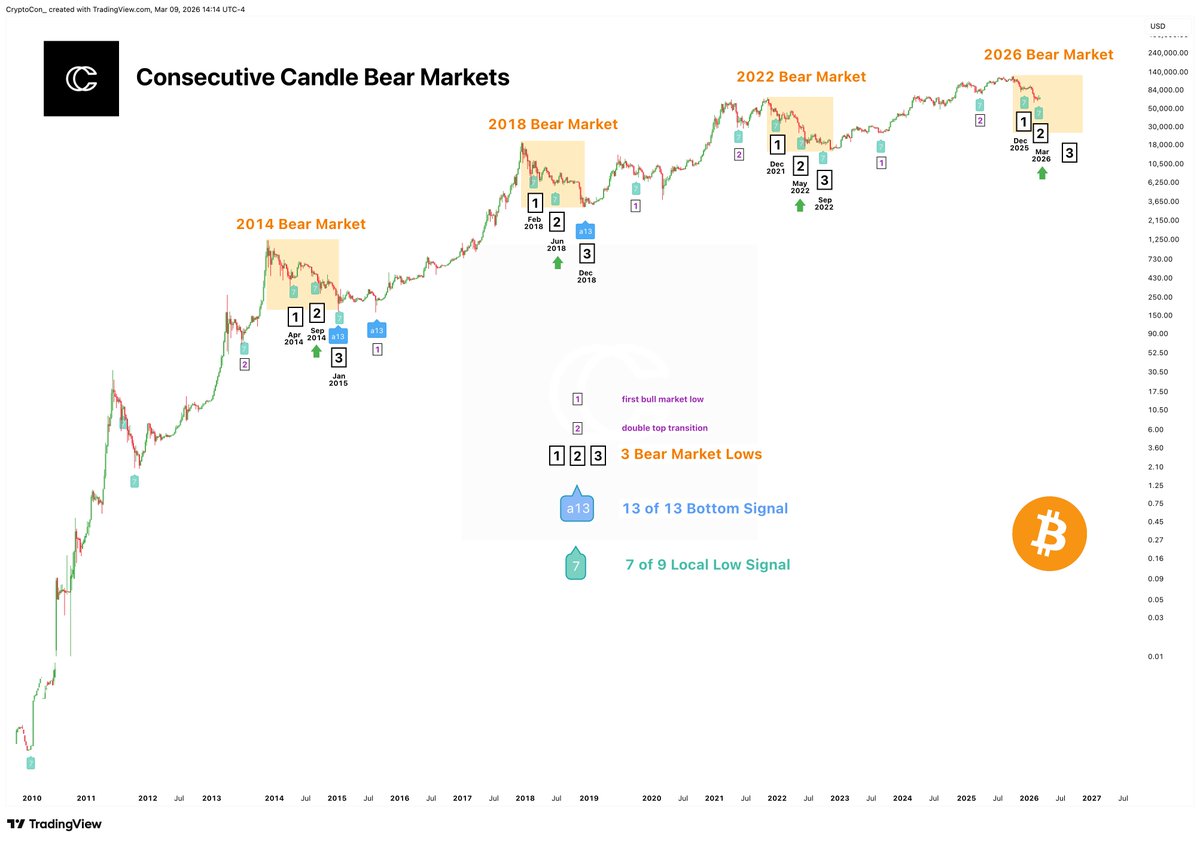
Bitcoin's 2026 bear market performance is now closest to the first bear market in 2014.
The unification zone (where all bear markets have lined up) starts in just 10 days, which means Bitcoin would need to be at least 50k by June 18th.
Everything's right on track.
No closes yet, but it seems very likely that Bitcoin locks in a break below the First Low Bear Band, triggering a move to the Second Low Band at 44.5k.
The cycle bottom target here is on the lower end of my projections at 28.5k.
I am being very patient for the right cycle low conditions, I am not afraid of "missing out".
Especially as returns diminish and the possibility of a lackluster cycle (which most people find impossible) looms, it is more important than ever to wait for the best time to invest.
I think plenty of people will "call" the cycle bottom this go around, because if you do it at every low, eventually you'll be right. Was buying altcoins at their cycle bottom impressive last cycle? For most... not at all. The big "kicker" will be if Bitcoin only reaches... or doesn't reach, ATHs next cycle.
It's the invincible twist, because almost no crypto influencer has a plan for a complete cycle flop.
"So what will you do then, CryptoCon?"
At this point, I am very uninterested in buying Altcoins in the upcoming cycle. I think they are being challenged as a viable sector, like NFTs.
I do think Bitcoin still has potential. Even a run from low prices to near previous ATHs is a good return.
I also believe this would be temporary. And once the losers have been obliterated, a select few crypto will rise to maturity to continue more modest growth.
Diversifying seems smart. Stocks, Index Funds, and ETFs have become more interesting. I'm still waiting for good buying opportunities there too, before I allocate.
According to the Quartercent Cycles Theory, a major pause/recession is not projected until 2034, making it a great candidate for diversification.
The cycle bottom target for the Golden Ratio Multiplier is dropping, currently at about 36k.
We're watching Level 1, which has been very accurate for previous cycle bottoms.
This is slightly below the Realized Market Cap bottom of 42.5k. I think the real answer is probably something in between.
S&P 500 / M2 is repeating the dot-com fractal.
Not a coincidence. It's structure.
Dividing S&P 500 by M2 removes monetary noise and reveals the market in real liquidity terms.
The 2000 peak and the 2026 peak are nearly identical on this metric. Same extension. Same momentum. Same denial at the top.
The market didn't change. The narrative did.
In 1999 it was "the internet changes everything."
In 2026 it's "AI changes everything."
Both statements are true. The valuations are not.
The dot-com bubble didn't burst because the technology failed. It burst because expectations drifted too far from reality. Speculation assigned a weight that fundamentals couldn't support.
Same structure. Same behavior. Different story.
The chart projects a return to the 0.382 Fibonacci level as the first real support, a zone that aligned with the 2002~2003 lows in the previous structure.
Below that, 2009 marked the definitive bottom of the S&P 500 / M2 crash. Coincidentally, that's when Bitcoin was born.
Global liquidity will determine the speed. Not the direction.
The question is not whether this is a bubble. It's where in the cycle we are.
History doesn't repeat.
It rhymes.
This doctor has been carnivore for almost 9 years, reversed his pre-diabetes & lost 70+ pounds without counting a single calorie.
Here are 9 crazy truths about fat loss and health mainstream medicine has lied about (#3 will shock you):
1. Calories don't exist inside your body:
Bitcoin Cycles Haven’t Changed. You’re Just Ignoring Them.
The cycles of Short-Term Holders vs Long-Term Holders have masterfully defined the end of bear markets and the beginning of bull markets.
You might say this time is different due to liquidity, TradFi, the U.S., or whatever narrative is trending.
But most likely, Bitcoin will continue to behave exactly as it always has.
Focus on Alpha. And Alpha is On-chain.
SOPR profit is low, but not cycle bottom low.
The metric continues its journey to high loss territory, set to take place later this year according to the Halving Cycles Theory.
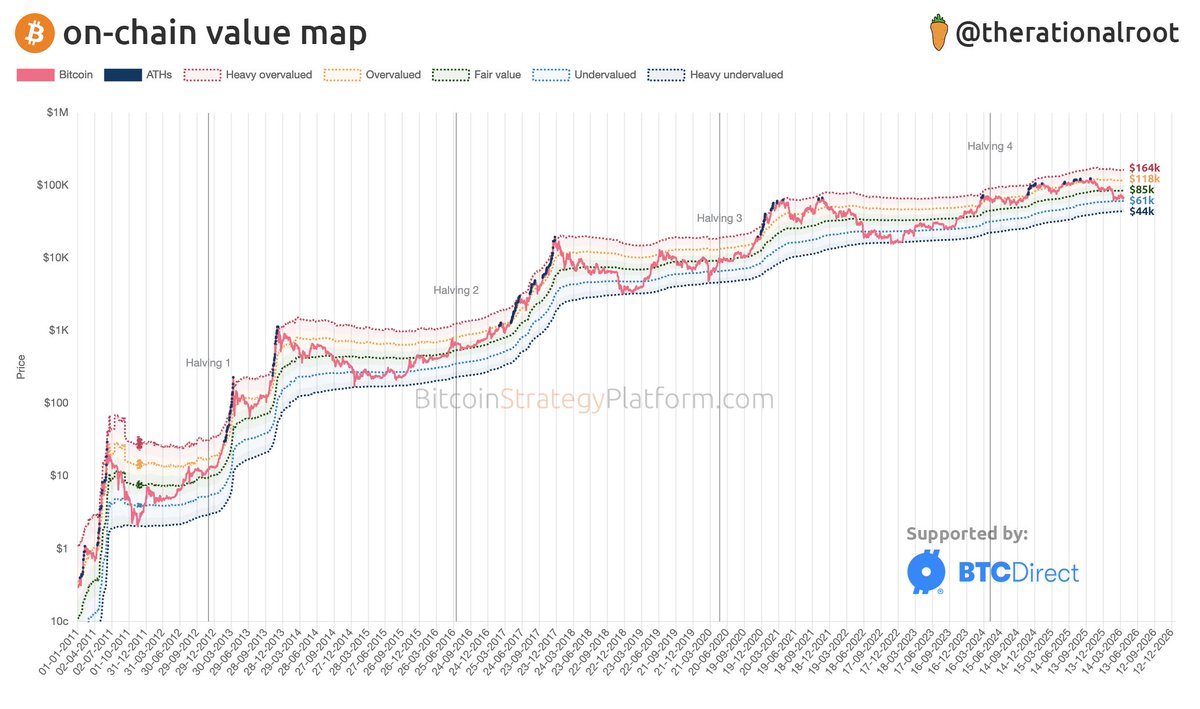
Using Realized Market Cap, I've created the simple bands, different from the Magic Bands, which use Volume and are more specific.
It's nice to have easy, effective price models, which this does well. A cycle bottom band, a top band, and a midline.
Price just broke below the mid-line, which is standard for halfway through the bear market. That's a common theme of current data.
The cycle bottom band is usually visited twice, and it's currently at 42k. A plausible cycle bottom price.
Metrics like this almost make it look too easy; it's the narratives (super cycle and super doom) that keep it running.
When Bitcoin becomes 50% older, its price gains another 10x.
This rule has remained constant due to following a power law.
Bitcoin age today = 6276 days
BTC fair price today ~ $100k
6276 x 1.5 = 9414 days / 365 = 25.8 years
25.8 years + 2009 = 2034
$100k x 10 = $1M
$1M in 2034
$BTC ENTERING RELIEF PHASE OF THE BEAR MARKET
Expect sideways range between $60k-$80k
Liquidity is building before next leg down
We are repeating the 2022 structure:
· ~52% drop from ATH - done ✅
· Relief rally / sideways phase - now ⏳
· Final capitulation - upcoming months 👀
Key levels to watch:
· $57k-$60k -> range bottom
· $85k-$88k -> relief rally zone
· $44k-$50k -> bear market target
Follow + notifs ON, I will keep you updated
The age old saying is "Don't fight the trend." In this case, I think that's the Halving Cycle.
People fought tooth and nail for a breakdown of the 4 year cycle all the way up in the last bull market (2023 - 2025), and it turned out just as it always did.
Now the bear market is underway and at every low, unsurprisingly, people are calling for it to end early.
The Consecutive Candles has just put in its second "7" of the bear market with one more to go (or a13), and many months before that can happen.
"The 4 year cycle is too obvious!"
Yet it always finds a way to hide in plain sight.
If you’re not studying the 1970s right now you’re not paying attention.
Oil shock. Stagflation. War in the Middle East. Weakening dollar. Rising unemployment.
Gold went from $35 to $850.
Oil went from $3 to $40.
The S&P went sideways for a decade.
Sound familiar?
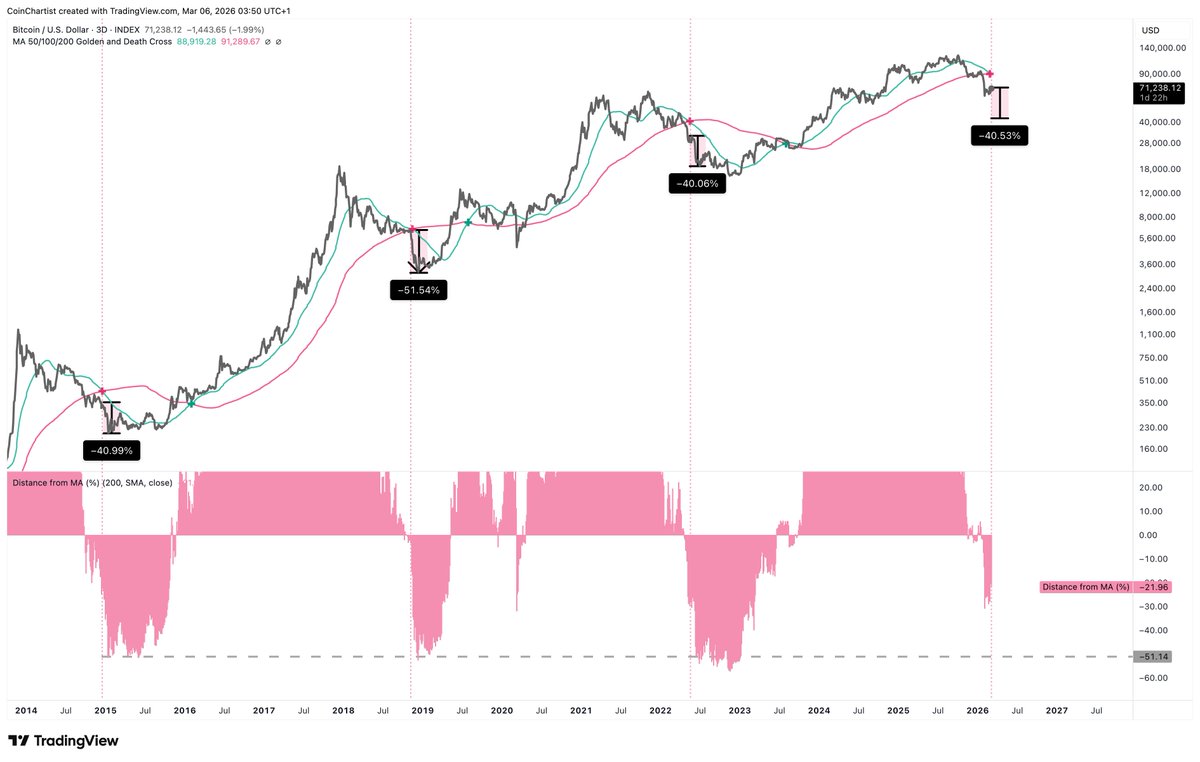
Bitcoin recently death crossed on the 3-day
This is something I warned about months ago
Based on historical data, we've got roughly another -40-50% drop coming very very soon
Distance from MA shows just how far we typically move away from the average before bottoming
$BTC (3D) – Death cross confirmed
The cross just happened.
This is the same setup we saw in previous cycles:
→ Death cross forms
→ ~30 days later: Major bottom
In previous cycles, that bottom came almost exactly 1 month after the cross.
If history rhymes:
👉 That puts the window around March 29
Historically, the cross tends to happen before the final leg down leading into that bottoming window.
So if anything…
this suggests more downside in the coming weeks.
What I’m watching:
🔹 Continued weakness into late March = aligns with cycle behavior
🔹 Signs of seller exhaustion near that window
🔹 Reclaim of key levels after = confirmation, not anticipation
Most people react to price.
I’m watching historic patterns.
Let’s see if BTC respects it again.