When Fiat forces you to wage wars you've already won to win treasures from castles you've already stormed, Bitcoin will give you the keys to keep what's yours.
@ZynxBTC It's not interesting when the expected move is 80k to 120k, that's not even 2x and AI is delivering 10x or 100x.
But the money that was in gold, and now in AI, will head to BTC next for that slight uplift before the next big thing.
That money can't fit into btc even at 150k
@AdamBLiv This is VERY exciting news, thanks 👍. I remember when the bears came for True North and MSTR went parabolic the following month. Fingers crossed the signal and result repeat 🤞
@BitcoinMagazine@Duelbits All the ups are parallel, all the downs are parallel. Looks like we party Sep 2027 to Sep 2028. I love to predict my life based on wiggles on a graph :D
@AdamBLiv importantly for stats to add context .
Now - less than 1M fresh available (rest you have to bribe hodlers for)
35 years - time until mining is less than 1BTC per day
Soon - MSTR has more BTC than available fresh ever again
In a week or so there will be a shift.
999,999BTC remaining to be mined over 100+ years.
So if you want some you need to go convince someone to sell you theirs, but the only people who have it already know this which is why they already own it.
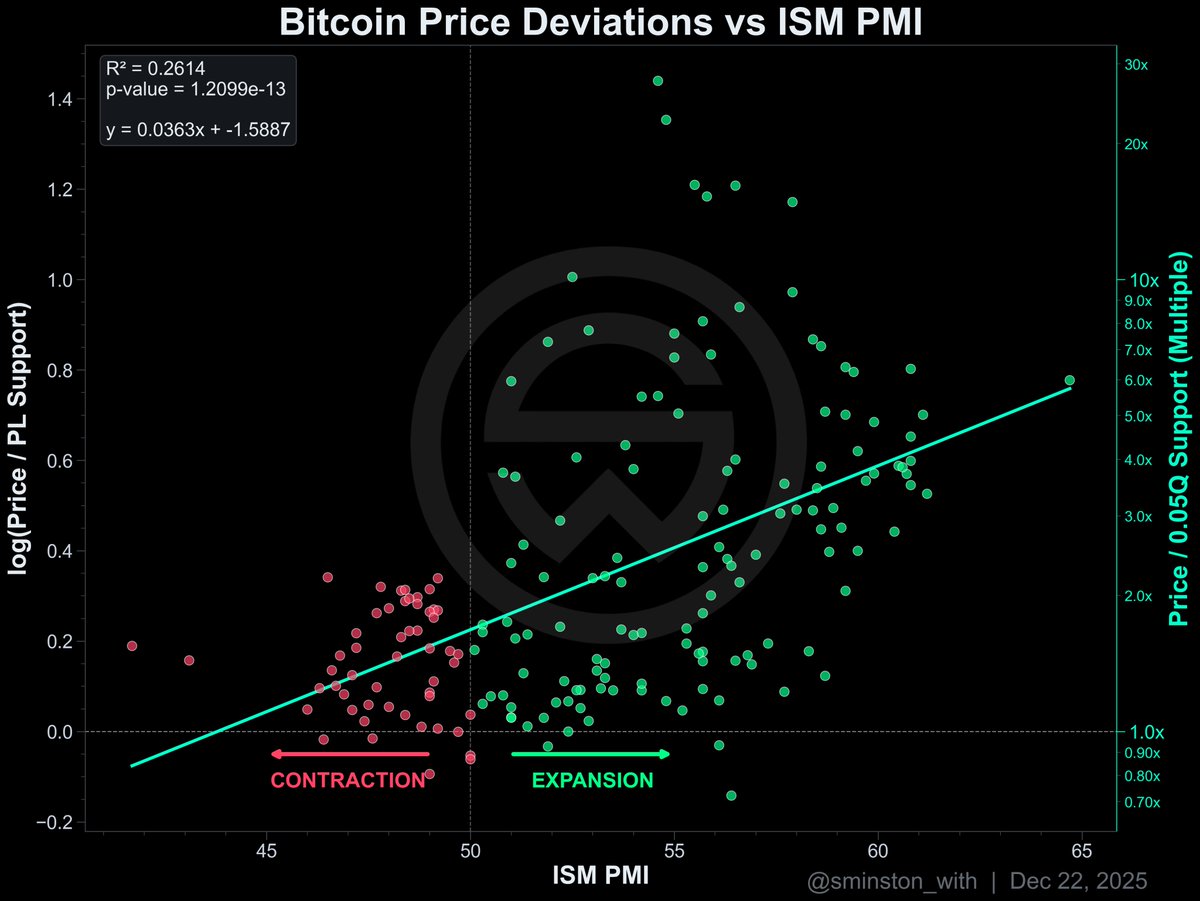
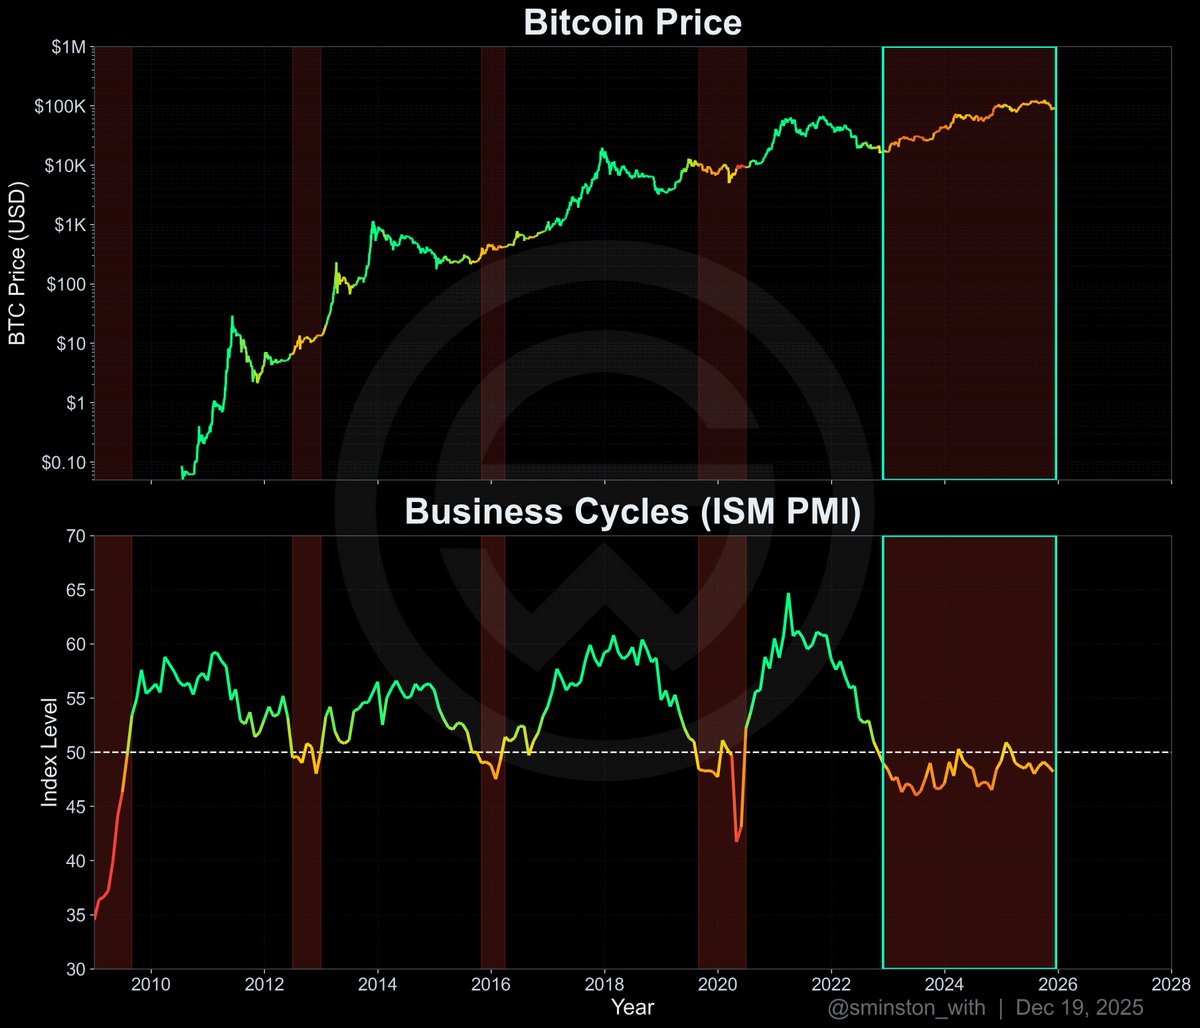
You may not like that Bitcoin bubbles are tied-in to the Macro cycles, but no matter how you skin it, it appears to be a strong driver.
- - -
Just take a look at THIS - BTC price has NEVER done more than a 2.5x off its power law support line when PMI was below 50 (contraction).
... I finally finished a regression analysis where I compared the raw ISM PMI value (50 is the threshold, below is a contraction and above is an expansion) to Bitcoin's price deviations FROM its support level (by convention I tend to use the .05 quantile PL).
The statistical results even surprised me:
R² = 0.26, p-value = 1.2e-13
That R² means PMI ALONE explains 26% of Bitcoin's valuation variance...that's massive for a single macro indicator, actually. The p-value is essentially zero, meaning this correlation ain't a fluke.
Halving cycles are nonsense. Let's use some parsimony, people; Bitcoin bubbles expand more when the economy is expanding.
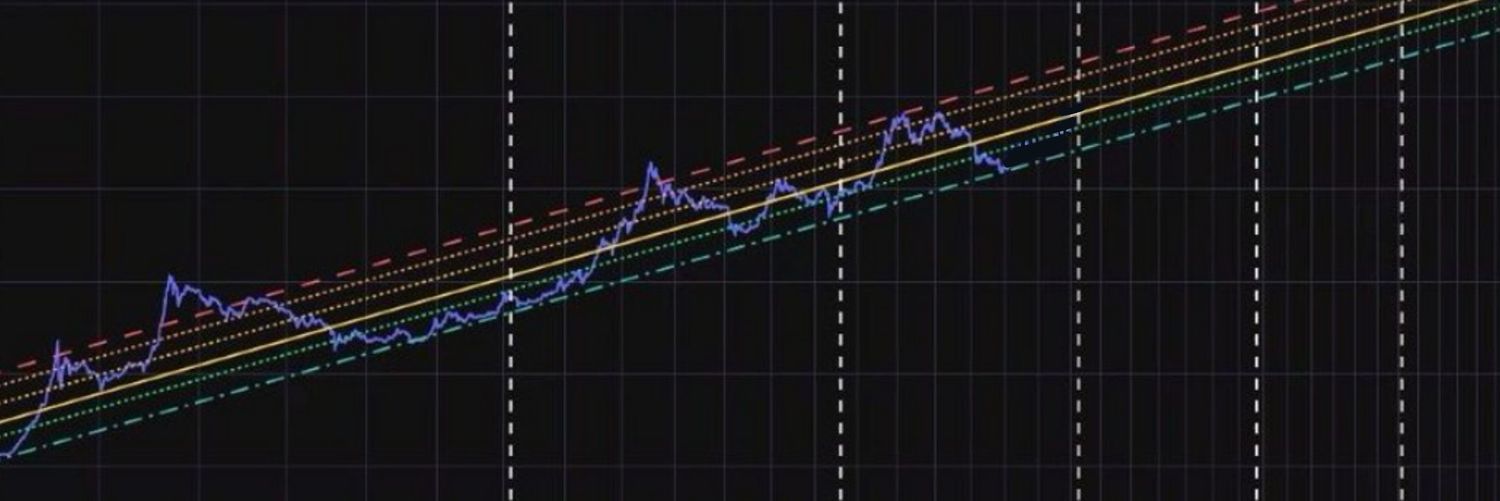
While prominent Bitcoin analysts like Arthur Hayes and researchers at K33 argue that the traditional 4-year halving cycles are dead due to institutional adoption, ETF inflows, and shifting monetary policies, this root-scale chart tells a different story.
All 5 out of 5 cycle tops (H1 through H5) have been modeled with remarkable precision using a single natural cycle framework tied to Bitcoin's block production. The pattern holds strong, with projections extending into 2028 showing no signs of the cycles fading.
If the data fits this tightly, why declare the end? Cycles aren't over—they're evolving, but still very much alive.
Chart credit: @leomatheart
The wait is over!
Introducing... 🥁
Bitcoin Quantile Model v2.
You’re going to want to bookmark this post—and follow for regular model updates.
After months of research and development, I’m very proud of this model—my flagship quantile framework.
I’m confident it’s one of the best—if not the best—long-term Bitcoin investment frameworks available.
As a full-time, unpaid Bitcoin researcher, I’m often asked how people can best support my free content.
Simply bookmark, repost, and comment on my posts :)
Thanks for all your continued support!
— PlanC
Key Features & Improvements:
1. Quantile lines never cross—mathematically impossible.
2. Cycle-length agnostic.
3. 133,000+ data points and 1,500 lines of code.
4. Fits and stores 999 quantile levels (τ = 0.001–0.999 in 0.001 steps) and identifies which level the last price is closest to.
5. Fits the two leading decay functions (stretched exponential decay & exponential decay) and selects the better fit via quantile-appropriate AIC.
Uses Akaike weights to identify the best-supported model.
Akaike weights (AIC-based):
Stretched exponential decay: 96.4%
Exponential decay: 3.6%
6. Piecewise Quantile Regression — Linear + Stretched Exponential Decay (Nonlinear).
@robprogressive Don't forget to adjust for inflation in the second one too. It's £234k in 40 years at 8% adjusted.
Over the next 40 years I would expect average real world inflation to be closer to that 8%
@apsk32 As BTC calms the price spikes will lessen and the swap to gold for the model will become more apparent.
Has anyone done BTC Vs other some currencies, dollar, gold on the same chart to see when the lines break. Does dollar match the peso from last cycle for example