Handling missing data correctly is essential if you want reliable and unbiased results!
Predictive mean matching is one of the most effective imputation methods for numerical data, and the plot below shows why. Instead of inserting a model prediction directly, the method uses the predicted value only to identify a set of similar observed cases. These cases serve as donors. One of them is selected, and its observed value becomes the imputation.
Because each imputed value comes from an actual data point, the method preserves the original distribution, avoids unrealistic values, and maintains nonlinear patterns much better than purely model-based approaches.
I have created a tutorial that explains predictive mean matching in more detail: https://t.co/wwsXtaq5GQ
If you want to learn how to handle missing data like an expert, explore my online course Missing Data Imputation in R. Take a look here for more details: https://t.co/i99PuXw3TZ
#datavis #DataVisualization #RStats #statisticsclass #R #DataAnalytics #database #datastructure
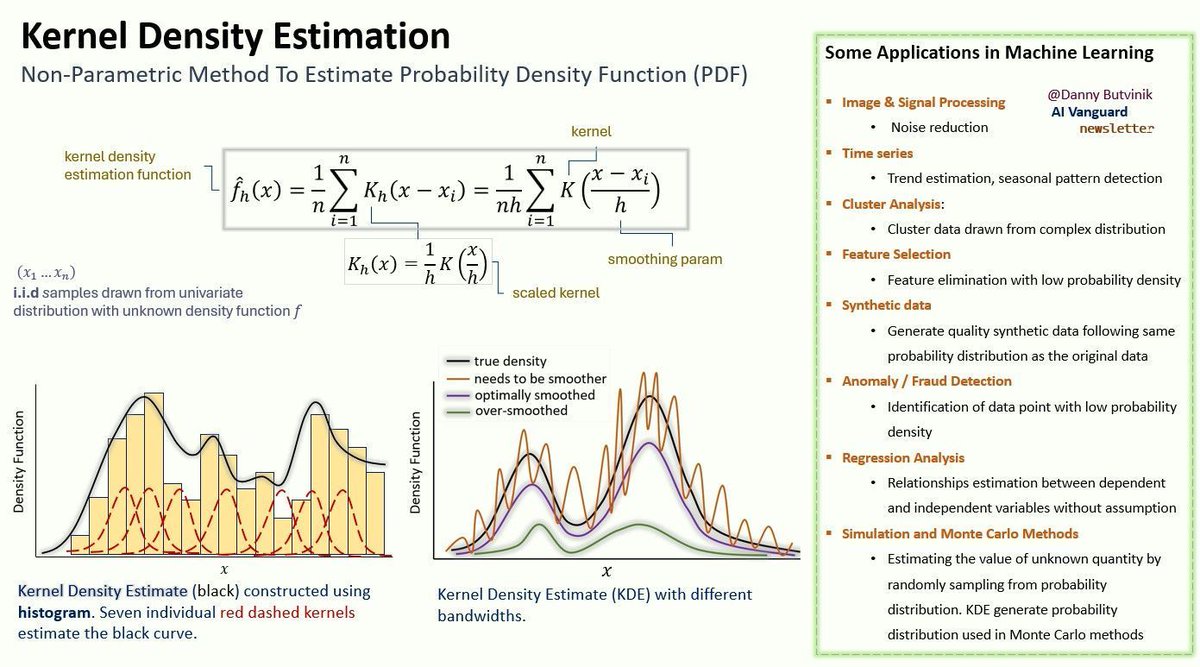
Kernel Density Estimation (KDE) is a powerful tool for analyzing complex data distributions, offering flexibility in machine learning and statistics.
It enables the modeling of intricate patterns without relying on predefined assumptions about the data's shape, making it valuable across various fields, from financial crime detection to ecological analysis.
In KDE, each data point is represented by a kernel function, and the sum of these functions creates a smooth approximation of the data's probability density. A key factor is the bandwidth, which controls how much the data is smoothed. Too much smoothing can obscure important details, while too little may make the data appear too "noisy."
Use cases for KDE include:
✔️ Density estimation for complex or unknown distributions.
✔️ Visualization: KDE offers a clearer understanding of how data points are distributed compared to simple histograms.
✔️ Model selection: KDE helps in choosing models that best describe underlying data patterns.
KDE is especially useful in scenarios where traditional clustering techniques struggle, particularly with high-dimensional, sparse data often found in fraud detection and anti-money laundering efforts. The non-parametric nature of KDE enables a more accurate and unbiased exploration of these difficult-to-model data sets.
The visualization shown here, originally shared in a recent post by Danny Butvinik, demonstrates how KDE captures data distributions effectively, even in complex environments.
If you're interested in more insights on data science, statistics, Python, and R programming, join my free email newsletter! Check out this link for more details: https://t.co/X93SeCe0rb
#RStats #database #pythonprogramming #datasciencetraining #Python #DataScientist #DataAnalytics
ضعف القدرة على التعبير يعيق تقدمك على مستوى الشخصي ..
في 2019 كان فيه محاضرة مدتها ساعة بعنوان ( كيف تتكلم )
قدّمها الاستاذ باتريك وينستون
عدد مشاهدات المحاضرة تجاوز 19 مليون وكثير من الأفكار بالمحاضرة عملية ومفيدة وواقعية الى اليوم
عندك اهتمام بالموضوع هذه المحاضرة مترجمة👇
Master quadratic equations through their core formulas and relationships.
The equation ax² + bx + c = 0 has solutions
x₁ = [-b + √(b² - 4ac)] / (2a) and
x₂ = [-b - √(b² - 4ac)] / (2a).
Vieta’s formulas give the sum of roots as x₁ + x₂ = -b/a, the product as x₁ · x₂ = c/a, and the difference as x₁ - x₂ = ±√Δ / a where the discriminant Δ equals b² - 4ac.
Civil engineers depend on these when designing bridges and calculating load distributions involving curved structures.