Here's a little animation of how the election has unfolded in our Live Election Night (or Days?) Forecast.
It spans from 6:00 PM on 11/3 to 10:30 PM on 11/4.
Follows it from Biden 95% to Trump 89% now to Biden 85%:
https://t.co/tjTZR0Q5Ld
There have been 7,155,248 new COVID-19 cases reported in the last 12 days (December 27 - January 7).
That's more than the previous 68 days (since October 13).
Over the last 10 days, 1.89% have reported testing positive.
Assuming again that only 1 in 4 cases are reported (which is likely a low estimate), that means 7.56% (1 in 13) of the US population has had it in the last 10 days.
Over the last 5 days (the CDC's new isolation length) 1.29% of the US population has reported testing positive for COVID-19.
That means, based on the old (likely low) estimate that only 25% of cases are reported, 5.17% (1 in 20) of the US population is currently contagious.
The CDC estimates that only 1 in 4 COVID infections are reported meaning that it's likely that nearly 4% of the US population became sick with COVID over the last week alone.
Nearly 1 out of every 100 Americans (0.99%) has tested positive for COVID-19...in the last 7 days.
That's nearly double the previous high (0.54% in January 2021).
And that's not even including un-reported at-home positive tests.
Not politics, but pretty damn shocking.
Of the 107 accounts @joebiden follows on Instagram, 13 have appeared on either Brooklyn 99 or Parks & Rec.
That's 12.15% of the people he follows.
Stats!
As a reminder, this chart showed the projected electoral vote count for each candidate based on how they were polling against Trump on a state by state level.
Caveats: assumptions had to be made about safe, but unpolled states and I had no pollster weighting or anything fancy.
Throwback to a year ago when I built a little website to track the projected general election electoral votes for the Democratic primary candidates.
It became the https://t.co/kIupJGGKq4 jugger-not-that-popular website you maybe vaguely heard of.
But here's how it started:
A few highlights:
- Bernie's numbers moved around a lot
- Beto dropped out early but polled surprisingly well
- Buttigieg & Klobuchar struggled to break 270
- Biden led the entire time, except for the 10 days or so before SC when Bloomberg polled better
2020, of course, was a census year which means re-apportionment of electoral votes.
Nothing earth shattering, but if the projected changes were applied to the 2020 result, Biden would have lost 4 electoral votes, Trump would have gained 4 (302 to 236).
There's also apparently a bill working its way through the NH legislature to apportion by districts (same as NE and ME):
https://t.co/TcIURGhmZW
Which would possibly gain the R's 1 more electoral vote.
@ElectionCenter_ My understanding is that it was really the moderate Dems who did well:
https://t.co/CxziMGM5h2
And the progressives who struggled:
https://t.co/raeLe4M5tS
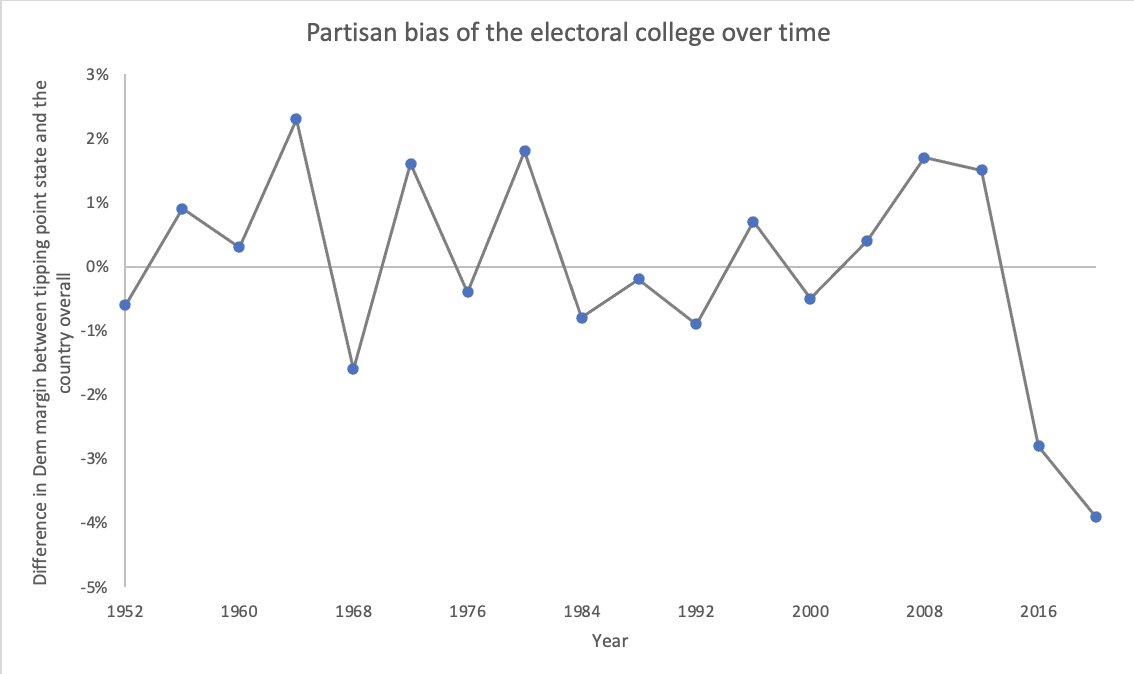
Fascinating chart showing just how unusually big Trump's Electoral College partisan bias advantage was in '16 and even more so in '20.
Both advantages were larger (and his 2020 advantage almost 2x large) than anytime in the last 70 years.
One underrated thing about the 2020 election is that the partisan bias of the electoral college, already at it's largest point in nearly a century, got substantially larger.
Democrats now need 52% of the vote in order to have a 50/50 chance of winning the presidency.