@law4community Imagine, they could've just used that money to keep buses fare-free.. something JM patted himself on the back for last election, that they now say they "can't afford" to continue
It's that time! We are nearing the first Tuesday of the month, which means you can get ready to sign up for public comment and public hearing until 5 p.m. on Monday. I hope to see you there!
#bradley4raleigh#ralpol#raleighnc
After months of volunteering and 15,953 verified signatures, the @NCSBE has voted against certifying the @NorthCarolinaGP.
Let us be clear, North Carolinians have a right to organize for ballot access for their parties, and refusing them that right is voter suppression.
Day 11: circular, in which I learned never to make a pie chart in R again. I was trying to do something easy, not spend 3 hours trying to reposition labels and still fail 🤣 code: #30DayChartChallenge#r4ds#dataviz
Day 10: abstract. Just some transformations on Fibonacci and Lucas numbers in a filled density plot. Code: https://t.co/QTmWoJ50bK #30DayChartChallenge#r4ds#dataviz
Day 9: Statistics. (I'm way behind.. it's garden week!) Gender parity in literacy. GPIA of 1 indicates parity between females and males; less than 1 indicates disparity in favor of males. code: https://t.co/AGnK6tRC82 #30DayChartChallenge#rstats#r4ds#dataviz#genderequality
@remotely_ruth I found this article recently on determining your skill level and found it really helpful. By these criteria I am an advanced beginner in R. https://t.co/Mq3TKTRzWr
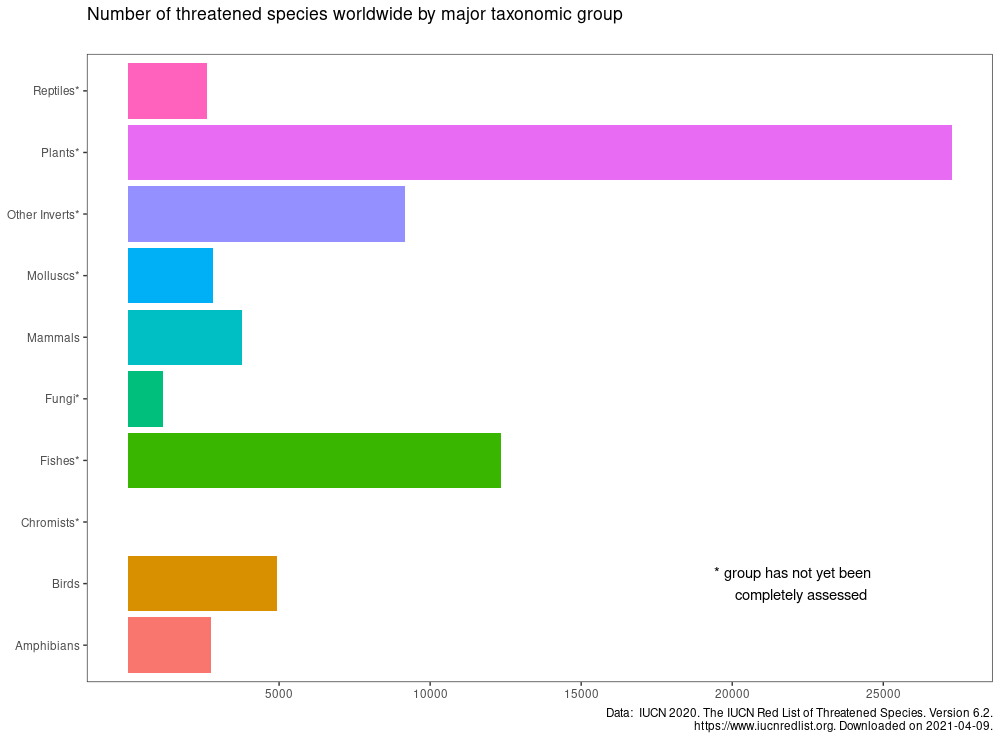
Day 8: animals. Red List Index data showing number of threatened species - vulnerable, endangered, or critically endangered. Learned annotate function! code: https://t.co/A3XRCqbDQY #30DayChartChallenge#dataviz#r4ds
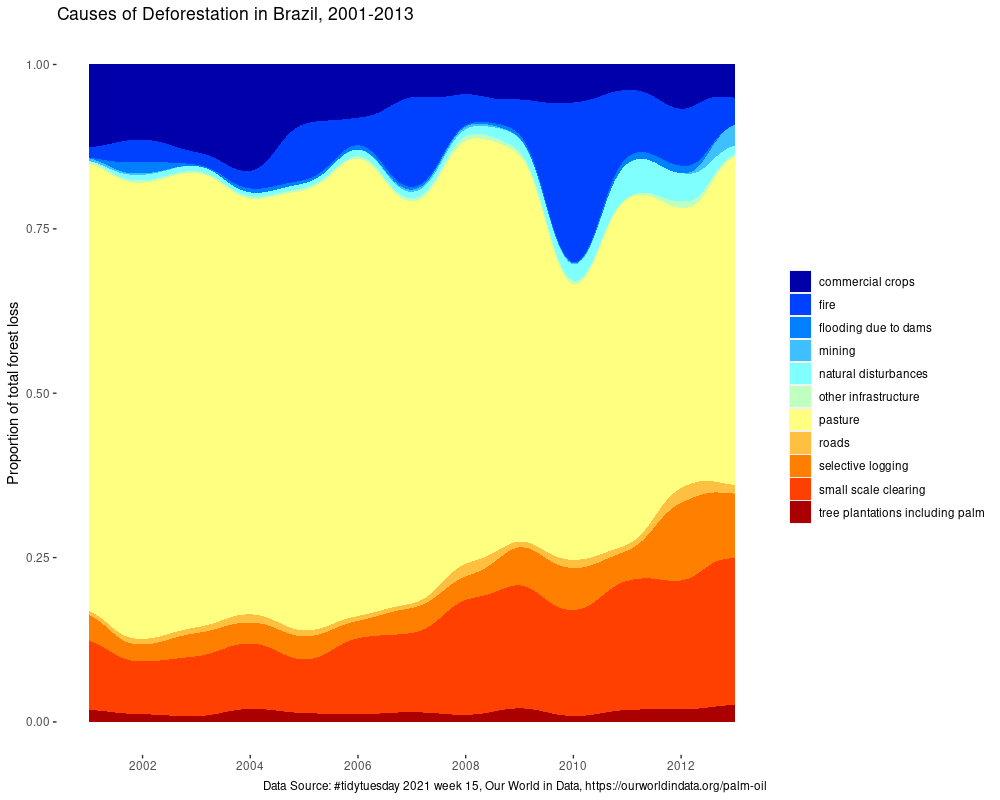
Day 7: physical distribution. Used this week's #TidyTuesday data to look at causes of deforestation in Brazil. I could play with ggstream all day! Code: https://t.co/AO8ns3LYm0 #30DayChartChallenge#dataviz#RStats
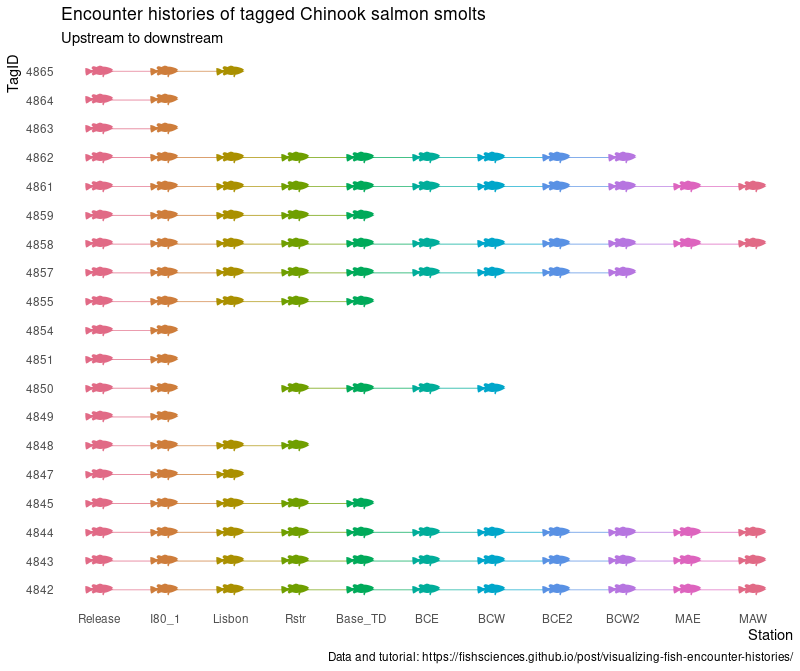
I'm a little behind! Day 6: experimental. The fish "font" hung me up for awhile, but this was a fun guided project to work through! code: https://t.co/qGlI7b8LI8 #30DayChartChallenge#dataviz
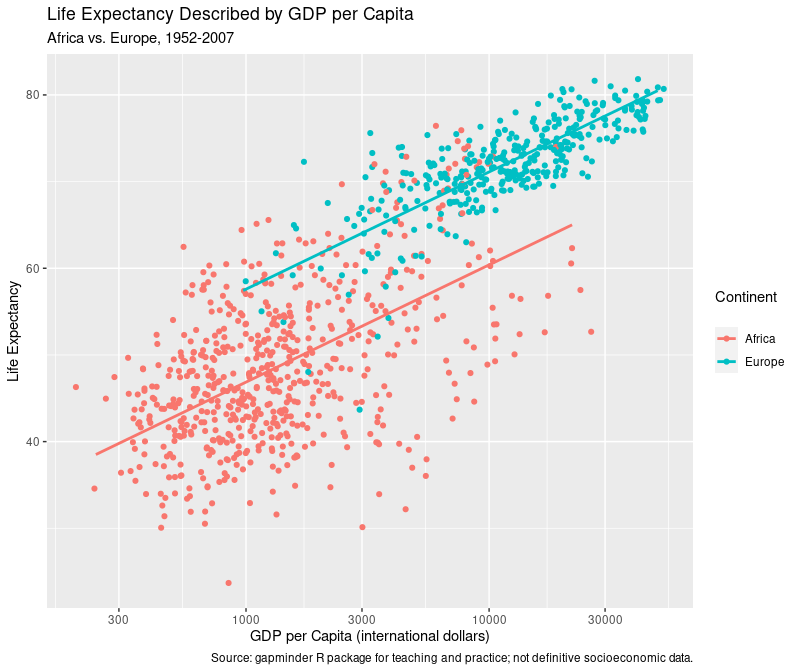
Day 5: Slope. #30DayChartChallenge Spent today tooling around with regression models, which I feel is my weakest area of understanding. Practice, right? Code: https://t.co/z4kADw09FA
Took my first real trip to git hell today. Is there a badge for that? Take it from me, other newbies, don't push your frigging huge data set to github! 😂🤦
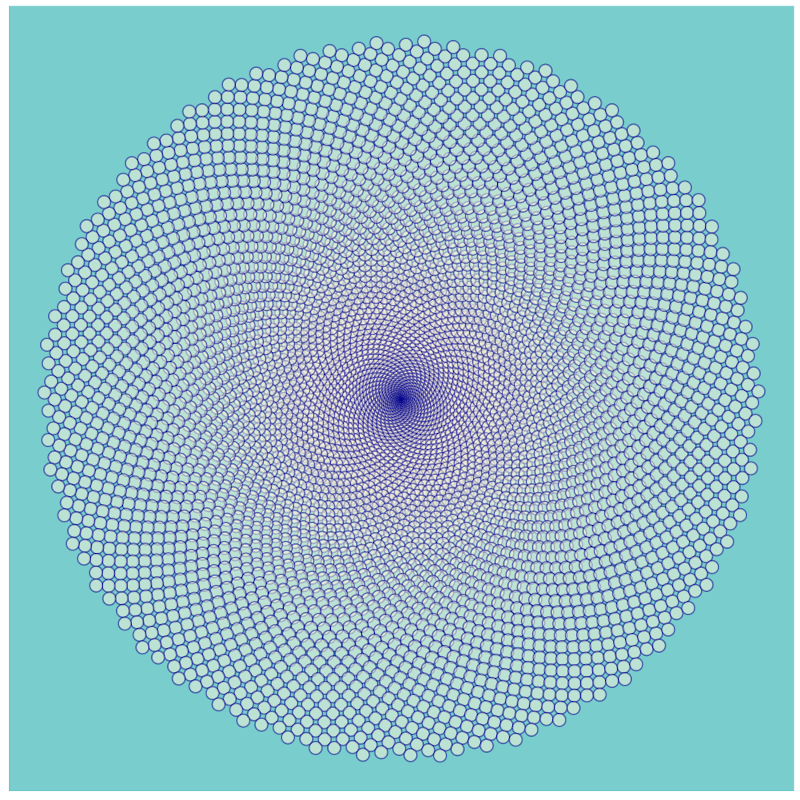
Day 4: Magical. I remembered a @datacamp guided project on drawing flowers with mathematics in #ggplot2 using the Golden Angle and wanted to go back and try it again. Here's my version! #30DayChartChallenge#datavis