@TheProfInvestor Hey Prof, I have been watching $RDDT for a while. The price action seems to be respecting the fib levels drawn from all time lows to the highs of Feb, 2025
One of the best uses of AI. Takes learning to a whole new experiences. Perhaps we do something similar with research papes. I am sure there are quite good ones that would become really intuitieve once we create an interactive version of it.
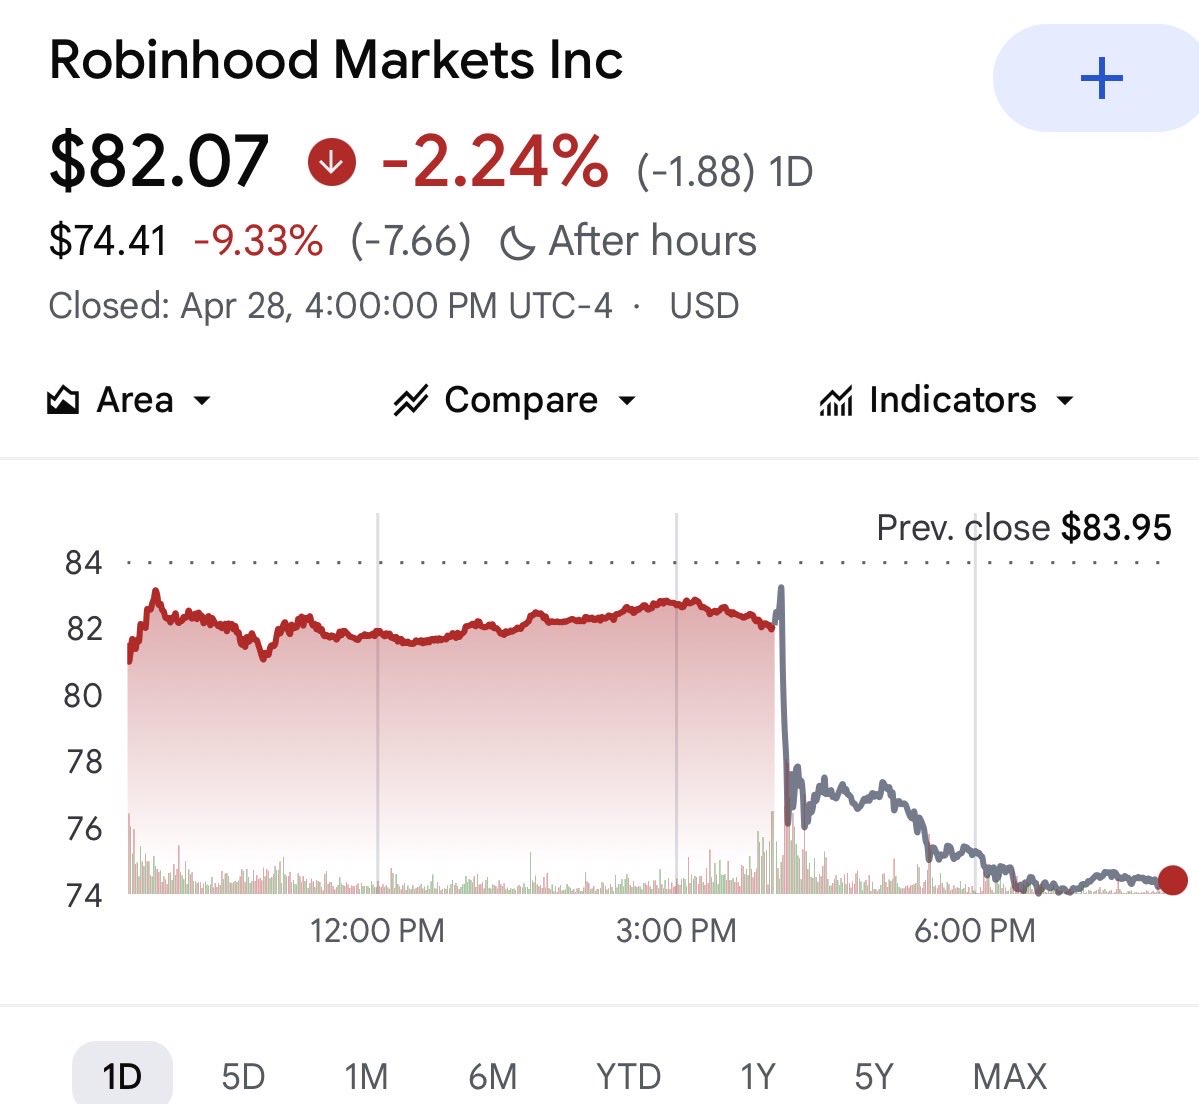
$HOOD Serenity (@aleabitoreddit) made a sharp point that's worth taking seriously: the product innovation HOOD should have shipped was international stock trading given how AI infrastructure remains in the focus and will continue to do so for a while.
Why this matters for the thesis:
the durable HOOD revenue line is TPA × yield. NII is ~34% of revenue and grows mechanically with platform assets. Q1 net deposits hit $17.7B (22% annualized), but TPA contracted 5% QoQ on asset marks.
The Bitstamp acquisition gave them EU/UK regulatory rails. TradePMR gave them RIA distribution. WonderFi closes Canada in H1 2026. The infrastructure is already in the building
Robinhood has a strong track record of product execution precisely when market sentiment turns against them. The 2021 meme-stock backlash was followed by Gold, IRA match, and the cash-management stack that now anchors the durable revenue line. The 2022 crypto winter was followed by Bitstamp, TradePMR, and the institutional-rails buildout. So while Q1 2026 was a miss, this is the exact part of the cycle where HOOD historically realigns and ships.
I'm watching closely for that pivot.
Product innovation from $HOOD would have been enabling international stock trading ASAP.
Instead they doubled down on "prediction markets" + "raffles" + new crapcoin listings where retail recklessly lose their money.
They also lost retail to $IBKR that now enabled Korean stock trading.
Especially due to international stock growth from Taiwah, Korea, Europe, Japan.
As a result, we saw new IBKR accounts grow to an all time high this quarter (just from qualitative experiences).
My opinion is $HOOD missed earnings since they lost track of what they should actually do to help out retail investors.
If they had retail investors all spending tons of TX fees from int. Equities trading, likely more margin usage, fees, cash on platform, wealth appreciation, and so on, which is the basis of the platform.
Maybe things would have gone better despite digital asset downturn.
@conorsen Consider building CLIs to do the job. Once you build it using Claude to a workable state, you can keep using CLI going further instead of Claude. Or you can tell Claude to use CLI to save tokens.
$HOOD A note on Total Platform Assets
TPA is the single number that decouples Robinhood from the retail-trading cycle.
NII (34% of revenue and growing) is mechanically a function of TPA × yield. Margin book (a high-margin NII subline at +93% YoY) scales with TPA. Securities lending scales with TPA. Even Gold subscription growth correlates loosely with TPA (more assets → more reason to upgrade for higher yield + IRA match).
When TPA growth holds, the revenue floor holds, regardless of crypto or options cyclicality. This is the metric that, if you could only watch one thing post-print, would tell you whether the diversification thesis is intact.
TPA is load-bearing because it converts the entire NII line + the margin book + the securities-lending line + the Gold-attach motion into a single explanatory variable.
If I see TPA grow 35%+ YoY for two consecutive quarters, I can infer that NII will grow ~20-25% (rates flat) and Gold ARR will continue to compound without needing to debate crypto cyclicality.
However seeing TPA decelerate to <25% YoY has a structural concern: either the customer is leaving, or the assets they hold are losing value faster than they can deposit.
The Q1 2026 read of 39% YoY and −5% QoQ is an ambiguous signal: net deposits stayed strong ($17.7B), but TPA fell QoQ on asset-mark drawdown. The next print (Q2 2026, late July) will resolve which force is dominant.
$HOOD Two segment anomalies justify a paragraph each.
Crypto
47% YoY is consistent with industry data, not company-specific weakness. Coinbase's TTM EPS is −53%
Robinhood's crypto print is mechanically the retail cycle. The interesting nuance is Bitstamp: $42B in institutional notional in Q1 vs. $24B in retail-app notional.
Robinhood now has an institutional crypto venue embedded in the consolidated print, and it carries lower take rates than the retail app but accumulates volume that does not depend on the retail cycle.
Over the next 4-6 quarters, as institutional volume normalizes higher (sticky once on-platform) and retail volume mean-reverts off cycle lows, the consolidated crypto line should de-cyclicalize. That is a slow, multi-quarter pattern, not a one-quarter print event.
Event contracts
+320% YoY at $147M is the most important new line item in the print. This is the lineal successor to crypto in the Robinhood revenue stack.
The infrastructure (Rothera DCM) is launching mid-2026 with HOOD as 45% owner of a CFTC-licensed Designated Contract Market. That changes the economics from "we route to MIAXdx and pay a fee" to "we own the venue and capture the spread."
If event contracts annualize at $600M+ in 2026 (current Q1 run-rate × 4 = $588M, with seasonal Q3-Q4 typically higher), they replace 50–60% of the crypto revenue lost since the cycle peak, and they do it on infrastructure HOOD owns.
The market currently treats this line as a curiosity. In two prints it will be one of the top two narrative drivers.
@EXM7777 Hey! How are you combining NotebookLM, and Gemini's notebook feature? Right now, its a bit confusing for me to determine which to use when? Appreciate your thoughts.
@StockMKTNewz Food, water, energy, and pharma supply chains are all drifting into the critical-infrastructure category. PLTR's USDA ontology -- farms, inputs, logistics, commodity flows -- is a reusable template for any agency operating under that same security framing.
The USDA deal matters more than the headline because it's the civilian-agency template. There are 15 cabinet-level departments outside of Defense/Intel with the same legacy-modernization mandate namely HHS, VA, Treasury, DOT, Interior, Energy.
If even a third follow the USDA arc ($2M pilot in 2022 → $300M production in 2026), that's a multi-billion TCV runway that may not be modelled yet, because PLTR's government book is still valued as a defense story.
The seat-count risk from AI layoffs is real, but NOW's pricing architecture is actually counter-cyclical to it.
Pro Plus is a 30% tier uplift on existing seats, not a new-seat sale. Fewer humans, more agents, same platform, higher ACV per seat.
That's why $1M+ ACV AI customers grew 130% YoY this quarter without the seat base expanding proportionally. The packaging is the hedge.
@StockSavvyShay The cRPO tell is cleaner than it looks. ~22% cc held with the 75bps ME drag, and those delayed deals aren't even in the book yet.
Q2'26 cRPO cc is the arbiter; <19% kills the thesis, ���22% re-rates it.
$NOW Across the last four earnings calls, cRPO growth in constant currency is the number that McDermott anchors his prepared remarks around and that the first three analyst questions always triangulate to.
Subscription revenue growth is a backward-looking print; cRPO growth is the 12-month forward lock-in and is therefore the leading indicator.
Post-earnings price reaction correlates more tightly with cRPO-constant-currency surprise than with any other metric:
the Q4'25 cRPO of +21% cc drove a +9% next-day move; the Q1'26 cRPO of ~+22% (implied from $12.64B) with the Middle East drag cited is what the market is pricing today's 12% drop against.
If cRPO growth holds >20% cc through the remainder of 2026, the Middle East-driven subscription headwind was pipeline-shift, not demand-destruction, and the stock re-rates.
If cRPO decelerates below 18% cc, the "geopolitical headwinds for the remainder of FY 2026" language becomes the market's read and the multiple re-rates structurally.
Weighted Fair Value remains $148
$BMNR Thoughts on buybacks.
The $1.12B cash balance can fund roughly $1B of buyback at current prices without touching treasury ETH or issuing debt, so the realistic floor is something like "$500M to $1B of opportunistic support executed over multiple quarters," not the full $4B as a binding commitment.
Even so, it's the difference between a stock that has to find its own floor against ETH volatility and one where management has publicly stated both the authority and the intent to defend NAV.
Scenario-DCF-wise, the impact tiers by execution assumption:
- if the authorization is purely narrative, fair value is roughly $51 (treasury growth alone) considering the flywheel thesis
- if management executes about $1B over the next year or two fair value runs about $54
- if the full $4B authorization is ultimately consumed via cash plus some asset rotation or debt, fair value reaches about $59
Edge at $22.44 therefore scales from +127% to +170% depending entirely on how credible you find the execution leg.
Between April 13 and April 19, cash grew by $401M while ETH also grew, which almost certainly means ATM issuance continued aggressively in that six-day window.
At an average price near $22.44, that implies roughly 18 million new shares, pushing the count from 537.6M to perhaps ~555M.
If true, ETH/sh actually edged *down* over that period rather than holding flat meaning the flywheel-stagnation concern is still live despite the new buyback authority sitting unused.
The next 10-Q (filing ~July for Q3 FY2026) is the first receipt that resolves two things at once:
Did the share count stay below ~555M, and did any buyback execution show up in the cash flow statement?
Until those receipts land, the direction change is authorized but not yet real.