leftist conspiracy theories are beyond retarded. it's actually insane that there's people who genuinely believe this. it was literally a jew that came up with the word "gender" and gender ideology.
@pissangel300O@BigmusclesAsh@pngangel2@OurOwnNation judaism as a religion is completely irrelevant, that literally does not matter. most super powerful and "evil" jews are/were completely irreligious but they are/were ethnic jews regardless.
drc and sudan barely have electricity and clean water but somehow they have average penis size data.
least obvious jewish propaganda post to make people believe in the "BBC" myth
@zombiesbiting@hoodWitchAzura i do. i like making fun of pooners and trannies i like how easy it is to get under their skin and they make me feel better about myself it's as simple as that
i sort of understand saying screamo isnt but black metal is anti life, anti morals, anti everything besides hatred and contrarianism. it actually isnt for people like you since theres nothing "punk" about worshipping niggers and trannies. every major corporation does that in 2026
@fluffycozzyguy@venusinfurs55 whether or not pop music is fembrained is ultimately irrelevant because of how shit it is and how goyfied people who listen to it are. 99% of them are literal zogcattle
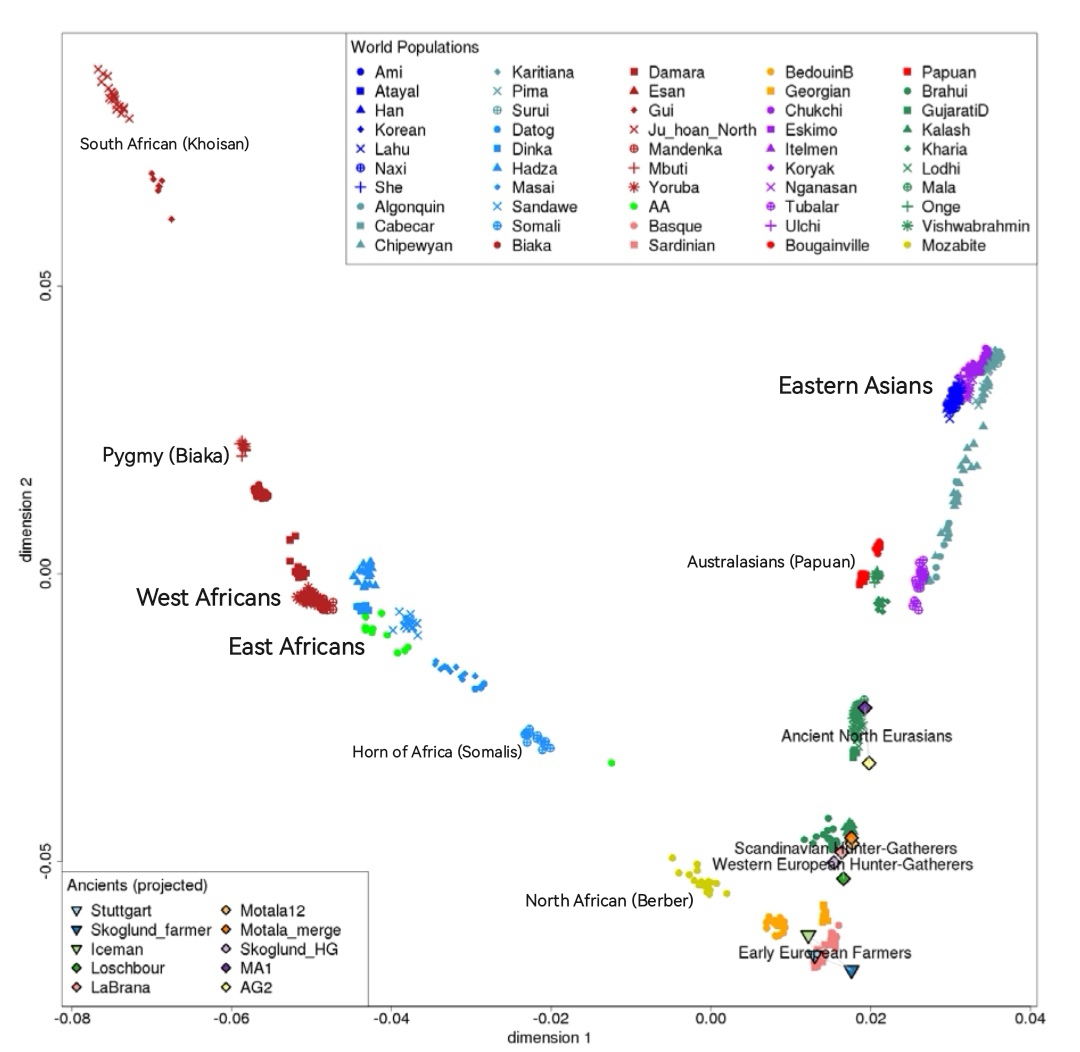
the genetic distance between west, central and south africans and non-negroids is way too significant for them to be considered the same species. also borders on my map arent perfect obviously
east and north africans cluster closer to everyone else because they're caucasoid. the other africans cluster further because they're negroid and the negroid "race" isn't human.
🟦 = human, caucasoid (east african)
🟥 = human, caucasoid (berberid)
⬛ = non-human, negroid.
Here's an explanation for what you are seeing:
Global PCAs can give a misleading impression if you don’t know how to read them.
Africans are much more genetically spread out than this chart shows. The horizontal axis mainly runs from African to non-African because the Out-of-Africa migration is the biggest source of variation in the data. The vertical axis mainly separates East Asians from other non-Africans.
This framing compresses real African diversity. Nigerians and Khoe-San are more genetically distant than Chinese and English, but the chart doesn’t reflect that. It is pulled by the largest groups in the data instead of showing diversity evenly.
Another factor is the absence of key branches of the human family tree which can only be found in Africa.
A PCA that included all the major branches of the human family tree and balanced the sample sizes would give a clearer picture of genetic distances and deep structure, and it would look very different from this chart.
In fact, the PCA you posted comes from a research paper that highlights this exact bias problem. Its title is “Principal Component Analyses (PCA)-based findings in population genetic studies are highly biased and must be reevaluated.”
Here's one PCA that looks very different once you include some South Africans who come from different branches of the human family tree. It's not even balanced. If it were, the spread between Africans would be even greater: