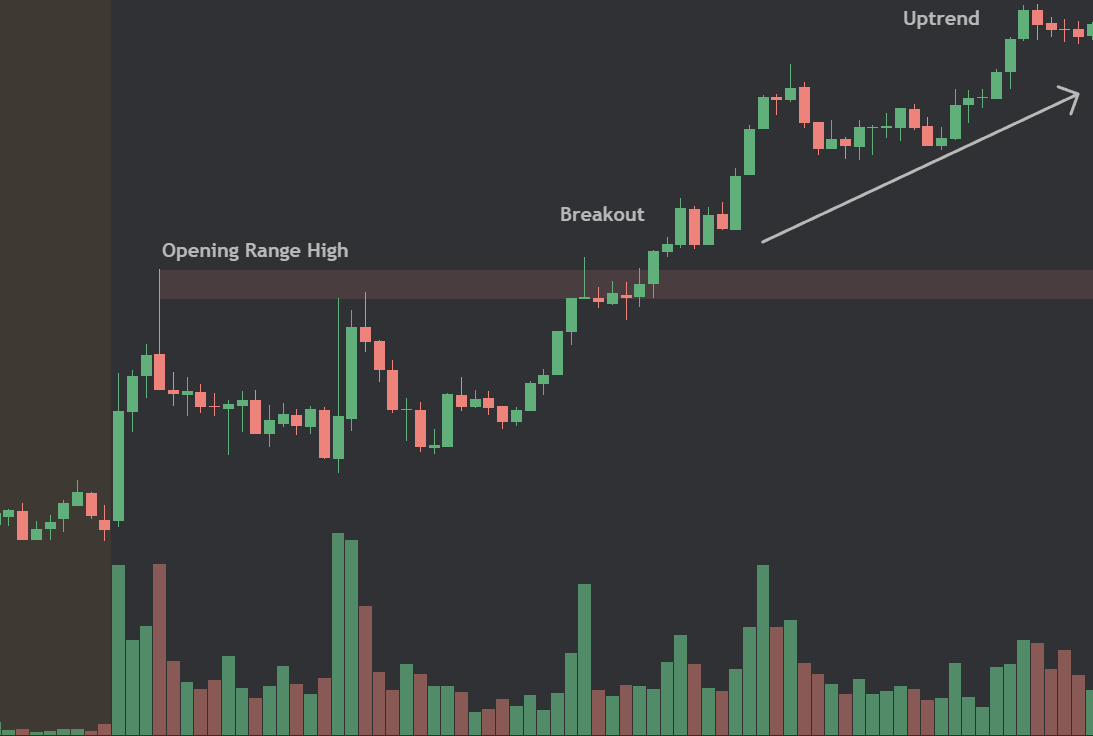
THE OPENING RANGE BREAKOUT IS THE BEST DAY TRADING STRATEGY ON THE PLANET🌎
I'm going to post it every single mf day until I convince you guys to give it a shot
IT. WORKS.
Most traders screen for cheap stocks.
I screen for strength.
Every one of my biggest winners came from this single screener. It's the only scan I run every day and every weekend.
Here it is (free):
https://t.co/FfuBt33xQb
Here's exactly what it looks for 👇
1) 70%+ above the 52-week low
• I don't want stocks trying to recover.
• I want stocks already proving they can trend higher.
2) ADR ≥ 4.5%
Big winners need room to move. Low-volatility stocks rarely become home runs.
3) Above the EMA 8 & EMA 21
I want stocks already under institutional accumulation with strong momentum.
That's it!
Simple doesn't mean easy.
This screener is NOT a buy list. It's a research list.
Every stock still has to pass my manual analysis:
• Strong fundamentals (EPS +50% YoY or sales +20% YoY)
• A compelling growth story
• Clean price action
• A proper base
• Tight risk
• Industry leadership
Only a handful make it onto my watchlist and that's where the real work begins.
Most traders spend their time searching thousands of random stocks. I spend my time studying the strongest stocks in the market.
That one shift changed my trading.
If you consistently focus on strength instead of weakness, you'll start looking where the biggest winners are actually born.
If you find the screener useful, please Like ❤️ and Repost 🔄 so more traders can benefit from it.
Tech is currently underperforming. There is a rotation happening into healthcare, biotech, financials, industrials, utilities, energy, and staples.
• This rotation lasts about ~77 days.
• So expect technology to take a breather and rest until September 18, 2026.
After the rotation finishes, tech sector 30 days later is +5.6% avg, 60 days later: +8.4% avg, and 90 days later: +9.4% avg.
This is not the time to panic, but to build your tech watchlist. Take your time building your positions.
Rotations don't end bull markets - they create amazing entries.
Our 2026 stock market is following the exact same pattern as 1968, 1978, and 2007.
If this continues, $SPY will have a weak year finishing at +5.8% (average is ~10%+).
• July - choppy
• August - choppy
• September - grind higher
• October - peak
• November - sell-off
• December - choppy
1. 1968 was political chaos and inflation brewing
- MLK assassinated (April)
- RFK assassinated (June)
- Vietnam War escalating, race riots across dozens
of cities
- Market bottomed in March, then rallied hard through the summer as the chaos was "priced in"
- Nixon vs. Humphrey election rally - markets loved Nixon's pro-business stance, rallied into November
- Year-end selloff was due to Bretton Woods starting to crack, Fed raising rates from 4% to 9%, inflation becoming visible; the beginning of a multi-year bear market that wouldn't bottom until 1974
2. 1978 was stagflation and Fed tightening
- First half was weak with inflation running hot, economy stalling
- Summer had a rally; market bounced hard from the March lows as traders bought the dip
- September peak was when S&P hit ~107 by mid-September
- October-December crashed because the Fed got aggressive, inflation hit double digits, CPI running ~10%, interest rates spiking.
- S&P dropped 13.6% in 63 days from mid-November.
- Carter-era stagflation fears took over
3. 2007 was the subprime loans time bomb
- Market was ripping and Dow crossed 14,000 for the first time in July
- Warning signs was when New Century Financial (largest subprime lender) went bankrupt in April
- Bear Stearns bailed out two hedge funds in June with $20B in CDO exposure
- October 9 peak was when S&P hit 1,565; the exact top
- Year-end selloff subprime contagion spreading, credit markets freezing, but the real crash didn't come until 2008
- The market ended 2007 up only ~3.5% after being up 10%+ at the peak
All three years rallied hard into the fall on momentum/optimism, then sold off into year-end as
macro risks caught up.
In 1968 it was inflation and political transition
In 1978 it was stagflation and Fed hawkishness
In 2007 it was credit/subprime contagion
Just be mentally prepared for a choppy and weak rest of the year if history repeats itself.
Health Care has a 100% win rate in the back half of midterm election years.
Not 80%. Not 90%. ONE HUNDRED PERCENT.
I looked at every midterm year since 2006.
Here's how each sector performed from July to December:
1. Health Care $XLV: +8.46% avg, 100% win rate
2. Industrials $XLI: +7.18%, 80%
3. Materials $XLB: +6.71%, 60%
4. Financials $XLF: +6.68%, 80%
5. Cons. Discretionary $XLY: +6.35%, 60%
6. Cons. Staples $XLP: +6.29%, 80%
7. Utilities $XLU: +6.18%, 80%
8. Technology $XLK: +6.08%, 60%
9. Energy $XLE: +3.26%, 60%
10. Real Estate $XLRE: -7.94%, 0%
The S&P 500 $SPY averaged: +5.95%.
Three things nobody is talking about:
1. Health Care outperforms EVERY sector in midterm H2. Not tech. Not discretionary. Health Care. Five for five.
2. Tech drops to #8. The darling of every other year becomes middle of the pack when midterm volatility kicks in (60% win rate).
3. Real Estate has NEVER been positive Jul-Dec in a midterm year. 0 for 2. Negative every single time.
2026 is a midterm year.
The rotation is underway. It always does.
Book depth on the S&P 500 is very thin right now.
For those who don't know, book depth is the number of outstanding orders on either side of the current price.
Basically, when book depth is high it pins markets because of the outstanding demand. When it's thin it allows for large moves both up and down because there are less outstanding orders to stop it.
Perfect examples both April 2025 and April 2026.
The bad news about 2025 tariffs hit precisely when book depth was thin, allowing for a large selloff. In 2026 it was the opposite, where the thin depth caused a massive surge in the stock market.
We appear to be setting up for a similar large move, the question is which direction.
The $716 print is going to dominate your feed all weekend. Here's what it actually was and what actually matters heading into next week.
WHAT $716 WAS:
A 30-second intra-auction flash inside the closing cross. Dealers forced to sell by their own hedging math hit a vacuum below $720. Institutional bids caught it at $716.58. It snapped back $13 in seconds. The official NYSE closing auction printed $731.13. Not $716.
The $716 was not a trade at fair value. It was a gamma feedback loop that exhausted itself in half a minute. The same mechanic that drove the MRVL flash from $329 to $310 two weeks ago. Forced mechanical selling hitting a thin order book. Caught by real buyers on the other side.
4.7 million shares in one minute. 8x normal volume. Then it was over. The plumbing spiked. The plumbing normalized.
WHAT DIDN'T CHANGE:
MU beat earnings by 20%. Flash PMIs accelerated. Core CPI came in cold. The AI capex thesis is intact. No major company has missed or guided down. The S&P 500's earnings picture is the same one that powered $650 to $760 over six months.
Our correlation scanner read 1.5/10 green through the entire rebalancing week. Correlations actually DECLINED every session as the selling intensified. The cross-sector dispersion is healthy. Financials, energy, healthcare, and tech are NOT selling together. The forced selling is mechanical and dispersed, not systemic.
WHAT ENDS TUESDAY:
$165B of forced institutional rebalancing hits its deadline June 30. GPIF, Norges Bank, US pension funds, the SNB. The selling is calendar-driven with a calendar expiration. Tuesday at 4 PM, 1.39 million puts expire and the forced selling window closes.
WHAT STARTS WEDNESDAY:
July. Over the past ten years, S&P 500 has averaged +3.37% in July with a 100% hit rate. Ten for ten. The strongest seasonal month in the dataset.
The falling wedge pattern detected this week has a 97% historical success rate across 34 prior patterns. The Reverse H&S has a 90% success rate. Both target $790+. Both are active. Both waiting for the rebalancing headwind to expire.
Vanna is at +168.8K, the largest supportive loading we have ever recorded. When IV compresses, the mechanical recovery is the most powerful in our dataset. The spring is at maximum tension.
THE BOTTOM LINE:
The $716 print will generate panic posts all weekend from accounts that don't understand closing-cross mechanics. It will be framed as a crash signal, a collapse warning, a sign that the market is broken.
It was a 30-second gamma cascade that institutional bids caught and reversed. The earnings didn't change. The correlations are green. The forced selling ends Tuesday. The seasonal tailwind starts Wednesday. The recovery patterns are loaded.
The noise is loud. The data is clear. Two days.
$SPY $QQQ $NVDA
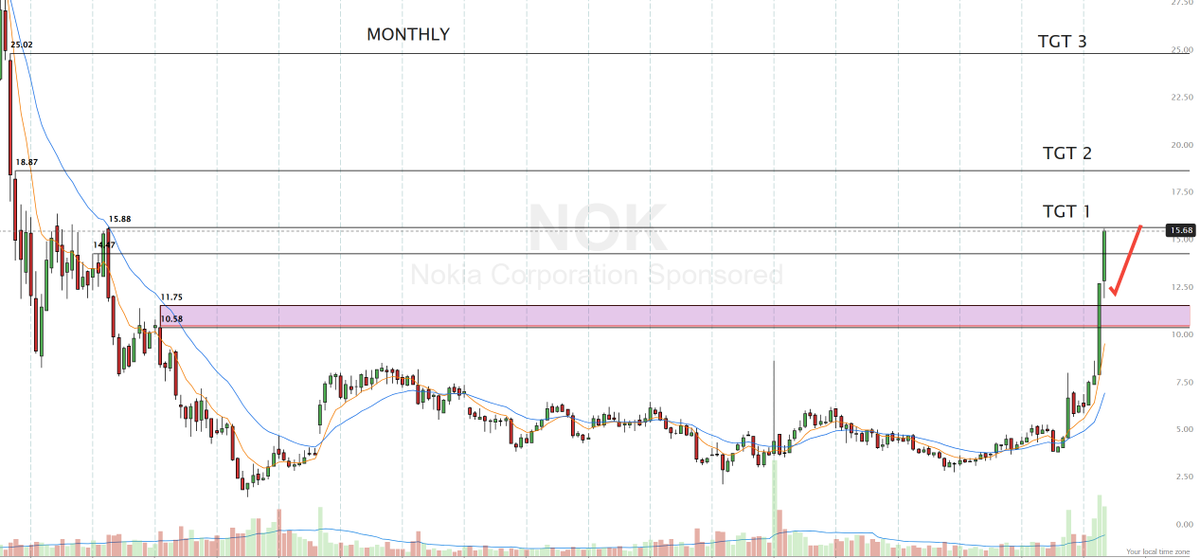
Is $MRAM the next $QCOM?
Nobody knows yet…but I do know that early-stage leadership always looks
“too small,” “too risky,” and “too early.”
...right before the crowd finally notices it.
Chart: $MRAM.
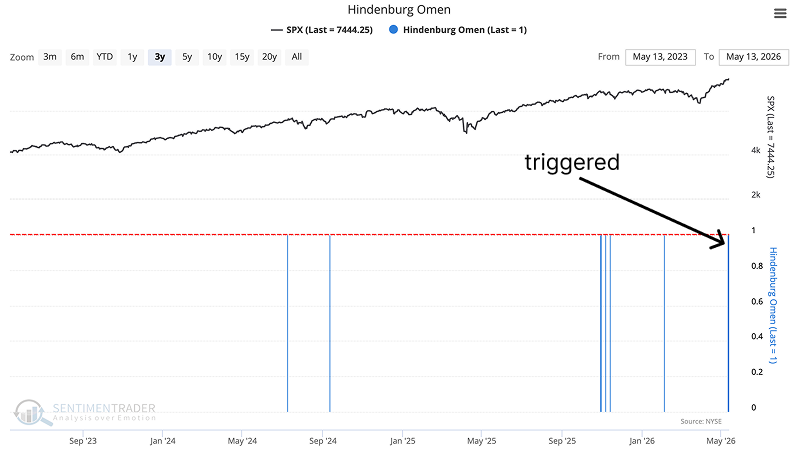
The Hindenburg Omen just triggered on NYSE and NASDAQ at the same time.
This has happened only 19 times historically.
S&P 500 win rate over the next 5 months: 39%.
Two of those signals: 1987 and 2007.
Read Full Analysis: https://t.co/iJUI9CJyKS
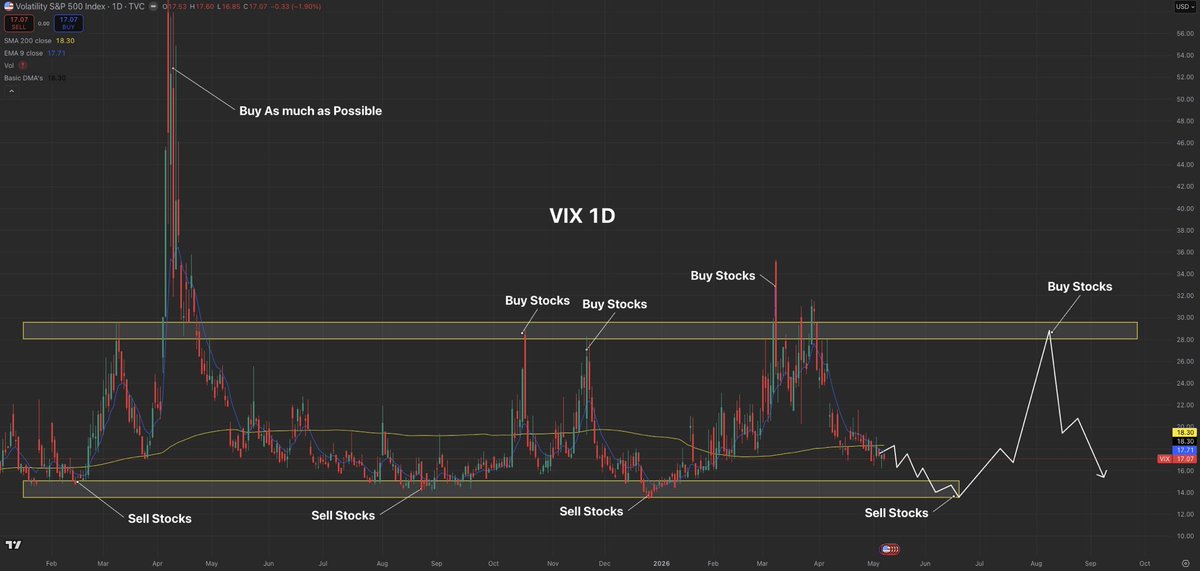
This simple rule will guarantee your portfolio to outperform the S&P 500 year after year…
Buy stocks when $VIX is $30.
Buy even more stocks when $VIX is $45+
Sell stocks when $VIX hits $14.
Using this rule shows that markets have room to squeeze till August.
Mark my words…
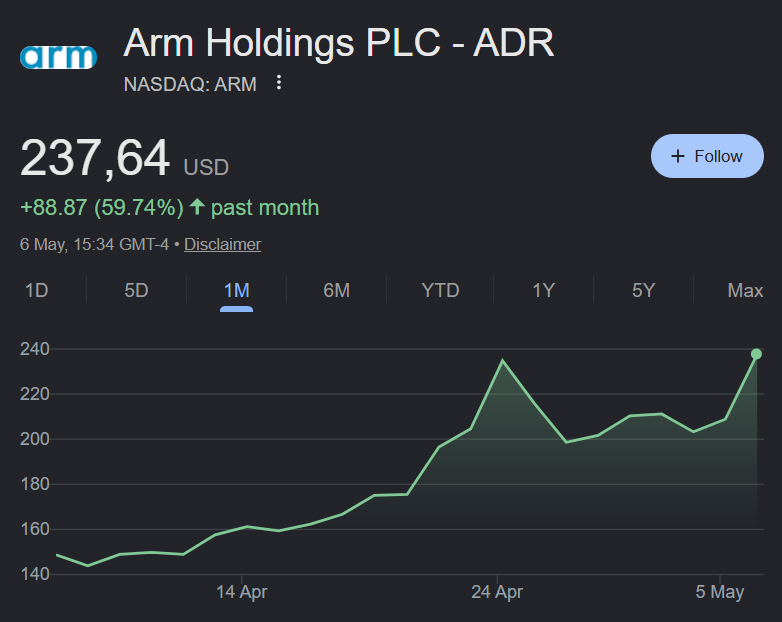
$ARM reports tonight. Big position for me.
Coming right after $AMD confirming accelerating demand for CPUs and both $ANET and $SMCI confirming a CPU supply issue while $SMCI also confirmed a strong demand for Arm designs.
Question doesn't seem to be "will they deliver a great quarter" but "how great, and what will the market focus on?" after a pretty strong monthly performance.
Delivering won't be enough.
One of the greatest investors of all time, William O’Neil, breaks down how he actually read a weekly chart.
In just 7 mins, he covered the things most ignore:
-Base patterns
-Exact Entry Zone + 10 week EMA
-Earnings strength
-RS
-Progressive exposure
This is how you train your eyes
The PDT rule is officially gone starting June 4th. What does this mean?
1. The Microcap market is about to be INSANE! If you enjoy trading stocks $20 and under, we will be treated to the most insane volatility we have ever seen. This will be crazier than GameStop days.
2. Expect to see multiple 250%+ movers daily! With no restrictions I expect to see stocks climb higher and higher as buyers can just keep adding on whenever they please.
3. Massive Short Squeezes will take affect and shorters will constantly be squeezed out.
For the first 2-3 months it will be pure anarchy in the microcap market until everything balances out. This June, July, and August just turned into one of the most exciting times to trade in the history of the Stock Market!
FORMER PRINCE ANDREW ARRESTED FOLLOWING EPSTEIN FILES REVELATIONS
LONDON — Police arrested Andrew Mountbatten-Windsor on Thursday following weeks of revelations over the former prince's friendship and dealings with Jeffrey Epstein.
Officers were pictured by news photographers arriving at Andrew’s residence on what is his 66th birthday.
Thames Valley Police, which covers an area in southern England, said it had arrested a 66-year-old man on suspicion of misconduct in public office, and that its officers were searching two addresses in Berkshire and Norfolk.
It sent the statement in response to NBC News' question about Andrew's arrest. It said, "We will not be naming the arrested man, as per national guidance."
Full article:
https://t.co/jkyVh0WUfF
$SPX - In the chart above we can observe many similarities.
From top to bottom:
🔸Steadily declining RSI
🔸Unable reach & maintain new highs
🔸Price < 10 week moving average
🔸Breaching a trendline
🔸Volume increasing
$NVDA Massive Head & Shoulders still in play
$PLTR Head & Shoulders playing out
$HOOD Head & Shoulders playing out
$SOL Head & Shoulders playing out
Only NVDA hasn’t fully played out yet.
It’s interesting how a multi month bearish structure, divergences, and repeated rejections at key levels are all showing up while the broader market is also extended and weakening in multiple ways.
Things are lining up.
And regardless this likely sets up another generational buy on NVDA, similar to early last year… if not better.