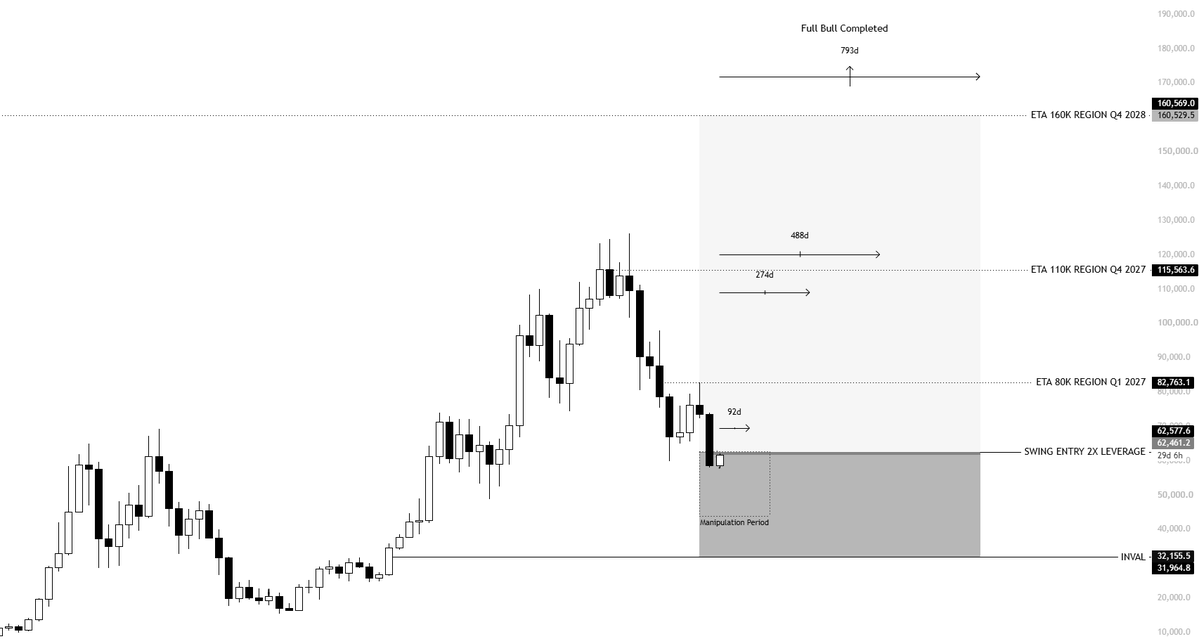
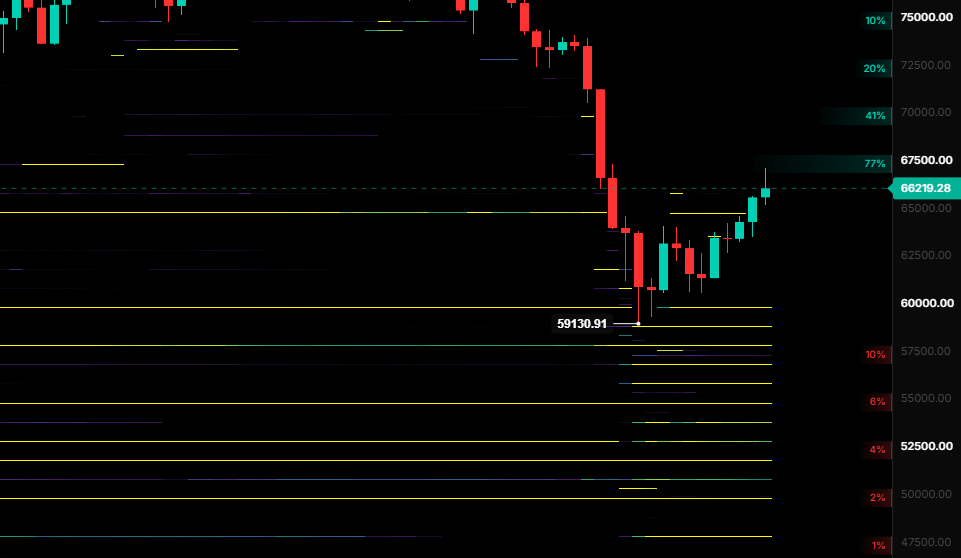
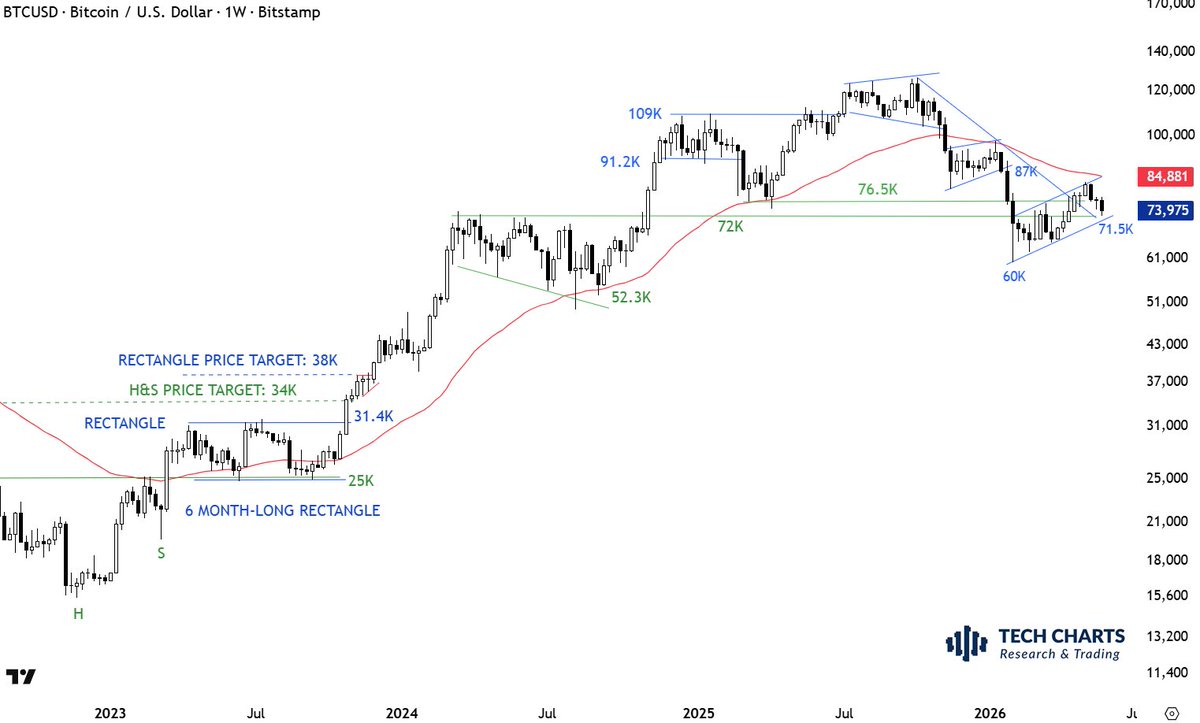
Nothing has changed with my $BTC swing long.
I'm expecting to hold this for 1.5–2 years.
I expect BTC above 80K in Q1 next year, and above 110K around Q4 2027.
~488 days to go.
If you can't be patient, don't follow me. However, you might regret it later.
🚨 MOST PEOPLE AREN'T READY FOR WHAT HAPPENS BELOW $58K
I’ve been trading crypto for 9 years and have never seen anything like this
Everyone is screaming that bottom is in, or we're going to 30k, but it won't be either of these
Reversals never happen without shaking out majority
The chart won’t follow the same pattern forever
If this macro pattern continues, Bitcoin must eventually drop to around 30-32k in a few months, despite macro and global demand
But at some point, every pattern has to break
When? When the fundamentals and market sentiment no longer support it
A pattern should confirm reality - not contradict it. If it does, forget the pattern. It has outlived its usefulness, just like every pattern before it
If you look at previous cycles, every major bottom took time to form. You had months to buy near the lows
And that's exactly why almost nobody did
Everyone was waiting for lower prices
Everyone wants to buy the capitulation wick
But what if that wick never comes?
Then nobody buys
$16k was obviously a great BTC entry last cycle
I think everyone in crypto knew that... Yet almost nobody bought.
Not because it wasn't cheap, but because everyone was waiting for a nice round number: $10k/$15k
Or they bought too early, just like many are doing now, deployed all their capital, lost conviction, or even sold because they were convinced BTC had much further to fall
That's how bottoms are formed
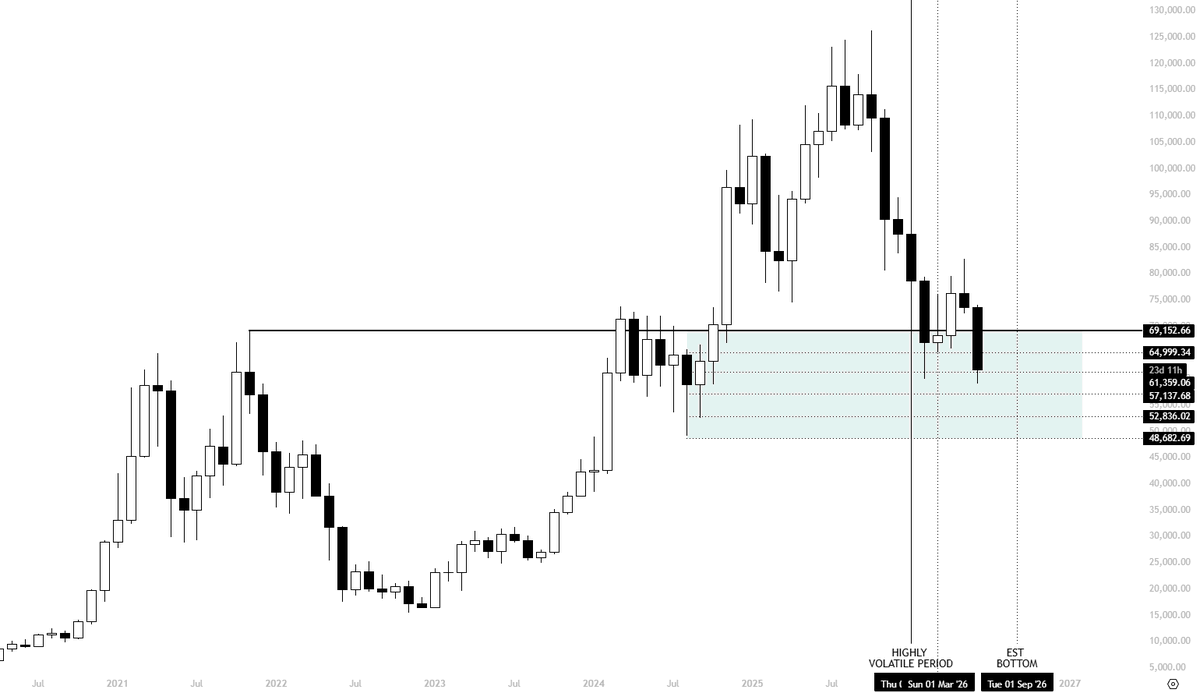
My base case is that we'll spend the summer ranging, then slowly bleed toward $50k
After that, maybe one final flush to ~$42k, just enough to convince everyone another capitulation, "the final dump to 30k" is coming
But it never comes, just like it never came last cycle or the one before it
Many things about BTC price action change over time, but one thing never does
When it's the top, almost nobody believes it's the top. When it's the bottom, almost nobody believes it's the bottom.
Today 50% think that the bottom is in
Other 40% wait for 30-40k
That's why I think it's not a bottom, and we won't bottom at 30-40k
But if you read the sentiment differently, or read this later, and you already think today's price is attractive but believe it'll go even lower, don't overthink it
Most likely everybody thinks so
So just buy and hold until $240k
It's much better to buy at $50k than wait for $30k that may never come and end up not buying at all.
That's why I've already bought 30% here
Will DCA at 58K, 55K, 52K, and 50% at 42k
Want to remind you that I called each major top and bottom of the last 7 years, including exact 126K BTC top:
https://t.co/OcIL5ehN7o
And soon i will make this account private
If you read this, you probably get the biggest informational edge in your lifetime
So make sure to follow me and turn notifs on
🚨 $SPCX IPO: What you need to know:
From its $135 IPO price to a peak of $225 in the first days, and currently trading around $153.
Some investors and traders are calling this IPO a scam. But is it really a scam, or typical IPO Price Action?
Here’s the data-backed playbook:
1️⃣ Index inflows:
On July 7th, SpaceX joins the Nasdaq-100. Passive index funds will be forced to buy an estimated $4.3B of shares, which could stabilize the price in the short term.
2️⃣ Shares unlocks:
Only 4.9% of shares are currently tradable.
But over the next 6 months, roughly an additional 35% of total shares will unlock through SpaceX’s staggered 180-day release schedule, creating ongoing selling pressure. The biggest unlock will be in November 2026 of 10% total shares.
3️⃣ Historical precedent: The IPO Bleed
Statistically, 60% to 70% of tech companies break below their initial IPO price, and those drop between -10% and -35% below it.
The TSLA Playbook:
In 2010,TSLA’s IPO price was $17, it peaked at $30.45 in the first days and then bled -12% below its IPO price to $14.98. Then it consolidated between $17 and $22 for 3-4 months until it eventually broke to the upside.
4️⃣ Will the bottom form after the November 10% unlock?
Probably not. Like in TSLA, the most likely scenario is that the bottom forms before this, and this big unlock only causes a retrace because price would have already run after forming the bottom.
⚠️Conclusion: Investors should be prepared for a similar scenario:
Based on previous IPOs, investors should also be prepared for the scenario in which $SPCX could drop -10% to -25% below the IPO price. That’s between $122 and $100 per share. Dropping below $100 is also possible, other IPOs dropped more but it would be really difficult due to the absorbing demand at a psychological level - not very likely. If you play long term, just DCA.
The IPO cycle is taking over. Follow us at @VettedLabs for more.
What do you think about SpaceX IPO? Scam or typical IPO cycle? Let us know below 👇
I’ve never seen this many “crypto is over” posts in my life.
Everyone forgot about 4 year cycles - which only makes me more confident that cycles still work.
Just buy BTC in Sep-Oct at $40k and hold it for 3 years until $240k+.
It’s really that simple.
🌀🌀🌀🌀‼️‼️‼️‼️‼️✅✅✅✅✅✅✅✅SORTEO CURSO.OPCIONES DELUXE WINTER EDITION👻👻👻👻👻👺👺👺👺👺👺👺❎🔰🔰♻️🈯️🈯️
SORTEAMOS 2 LUGARES ENTRE RT Y LIKES
Bueno, después de que lo pidieran sacamos otra edición en vivo de CURSO.OPCIONES con @tomiechecopar y esta vez se suma a explicar FUTUROS @gordoggal. Para el cierre tenemos a @gregorechi y @Roodri91 de Operando lotes con rodrigo para contarnos como operan ellos !
TODA la info en mi twit fijado o en https://t.co/5qBUESHJSV
OPCIONES, ESTRATEGICAS, SINTÉTICAS, FUTUROS Y SIEMPRE DE GENTE QUE VIVE DE OPERAR ! NOS VEMOS AHÍ
This rule has proven success, & will guarantee your portfolio to outperform the S&P 500 year after year…
Buy stocks when $VIX is $30.
Buy even more stocks when $VIX is above $45+
Sell stocks when $VIX is $14.
& simply repeat the cycle!
#BTCUSD vs #ORCL en 1995
Un triángulo continuo no deja de ser una figura que se forma sobre la indecisión, sin embargo, la fortaleza de la tendencia termina prevaleciendo, ya que la incertidumbre solo se dá en un porcentaje menor del mercado. Los grandes actores no venden y las correcciones son trampas bajistas.
Abundan estos ejemplos en los años 90´s.
Para contestar antes la objeción de siempre; así como un activo no tiene que ver con el otro, sino la dinámica de acumulación del precio, tampoco las relaciones de tiempo y precio están relacionadas externamente. Las relaciones son proporcionales al desarrollo de cada activo.
#BTCUSD Voy a repetir algo que ya comenté antes, pero me parece interesante repetirlo ahora.
BTC forma una estructura de comrpesión del precio que tiene dos caminos posibles desde el punto de vista técnico.
1) Patrón de continuación alcista tipo triángulo continuo con objetivo en usd 800000 o más
2) Patrón de agotamiento que llevaría a una destrucción absoluta, objetivo cercano a usd 9000 aprox.
Me niego a creer que haya llegado hasta acá, con la participación institucional que tiene hoy, solo para hacerse pelota.
Por lo tanto, solo veo el camino alcista.
Un triángulo de ese tipo, debería resolver al alza antes de noviembre de este año, por lo que no tiene mucho tiempo para iniciar el recorrido alcista. Mientras más tarde, más violenta deberá ser la suba posterior.
Mi opinión, si no es este mes, es el mes que viene que comienza un rally vertiginoso
For all of them $SOL degenerates,
Its time to start bidding.
I don't see SOL dropping below $40. That said, I'm not much of an altcoin guy, as you can probably tell, so my position will be relatively small.
Since the start of the year, I've stuck to a simple plan.
Accumulate as much $BTC spot possible.
DCAing after a 50% drop is how you outperform everyone trying to perfectly time the bottom.
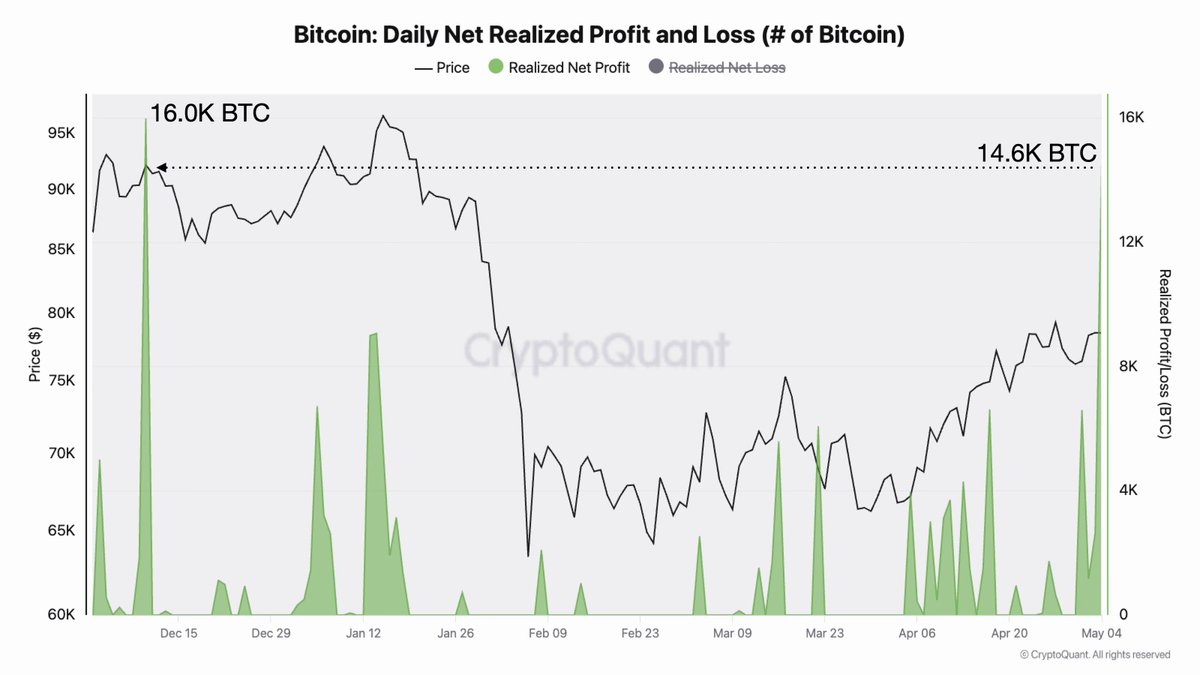
Bitcoin is up 36% from the 2026 low, watch out for the profit taking.
Yesterday, Bitcoin holders realized the highest daily profit since December 10, equivalent to 14.6K BTC.
The low of the right shoulder with H&S bottoms and H&S continuations is the pattern negation level.
Some of you are very concerned with the name a chart should or should not have.
I stress the importance of price dynamics. A H&S continuation forms a higher low after the Head. The higher low forms below a horizontal resistance.
Failing below that low ends up being the pattern negation level. After a series of higher swing lows, price starts forming lower lows.
Hoy, en cosas que se ven al final de los ciclos, tenemos los bailes de los CEOs. Está semana de Jensen Huang de Nvidia, en 2000 era Steve Ballmer de Microsoft.
la evolución año por año de los 2.600 dólares invertidos en la IPO de Tesla (29 de junio de 2010 a 17 USD por acción).Los precios están ajustados por los splits (5:1 en 2020 + 3:1 en 2022 = factor 15×).
Las acciones equivalentes hoy son 2.294.