Independent ETF data. Every figure sourced, dated and rebuilt overnight. No recommendations, ever, and no issuer pays us. Free weekly note, link below.
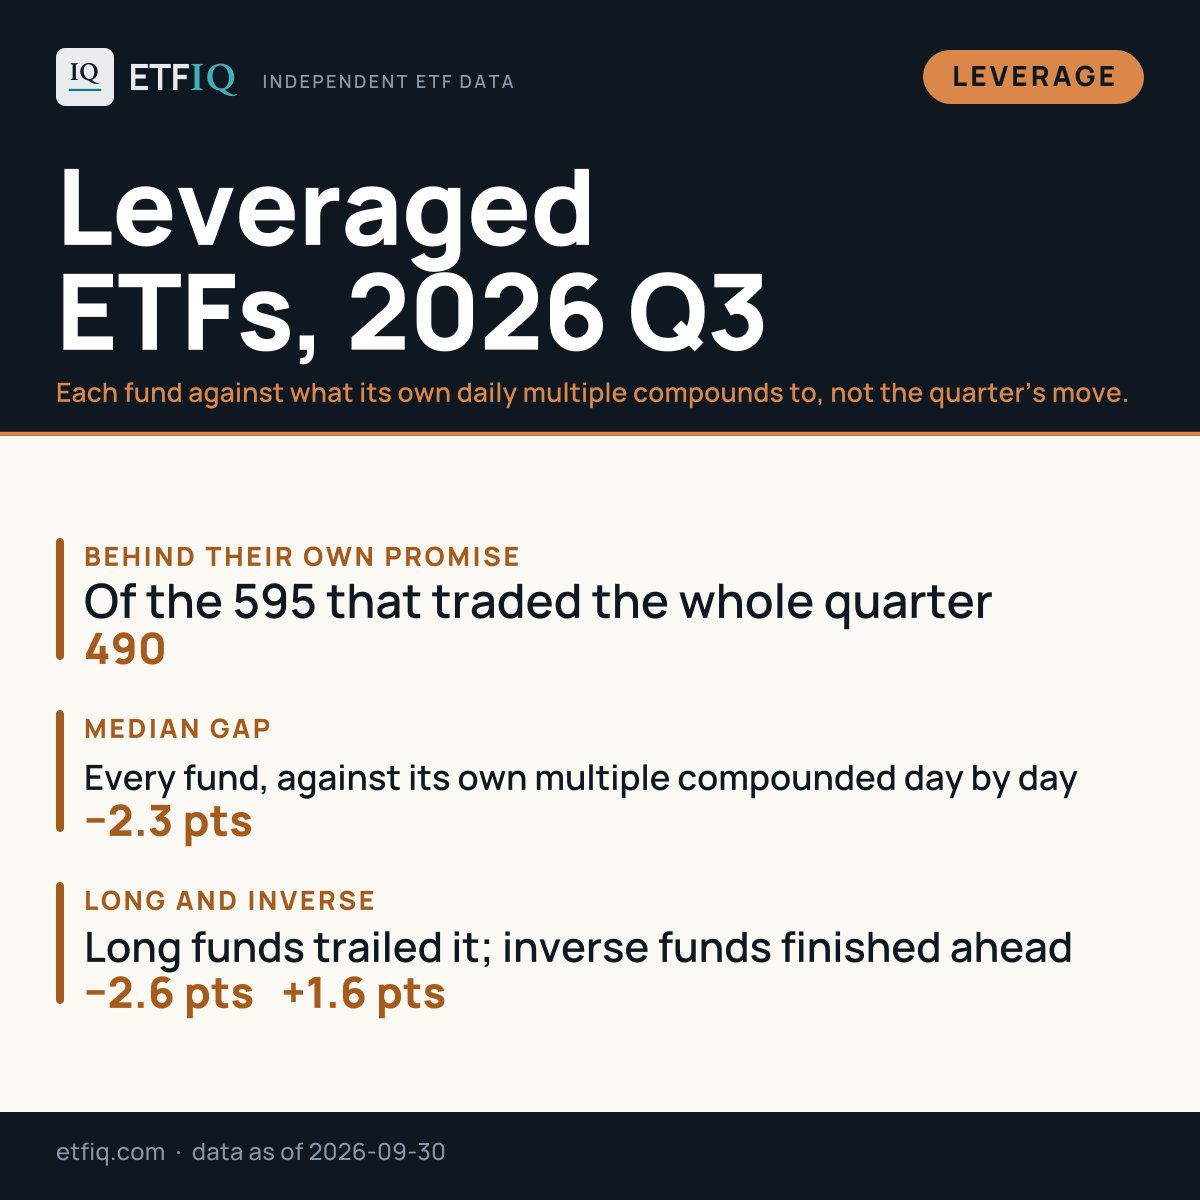
Leveraged ETFs, 2026 Q3. Each fund against what its own daily multiple compounds to, not the quarter's move.
490 of 595 finished behind their own promise, median 2.3 points short. Long trailed by 2.6; inverse finished 1.6 ahead.
https://t.co/caxolB7Nqg
#ETFs#ETFResearch
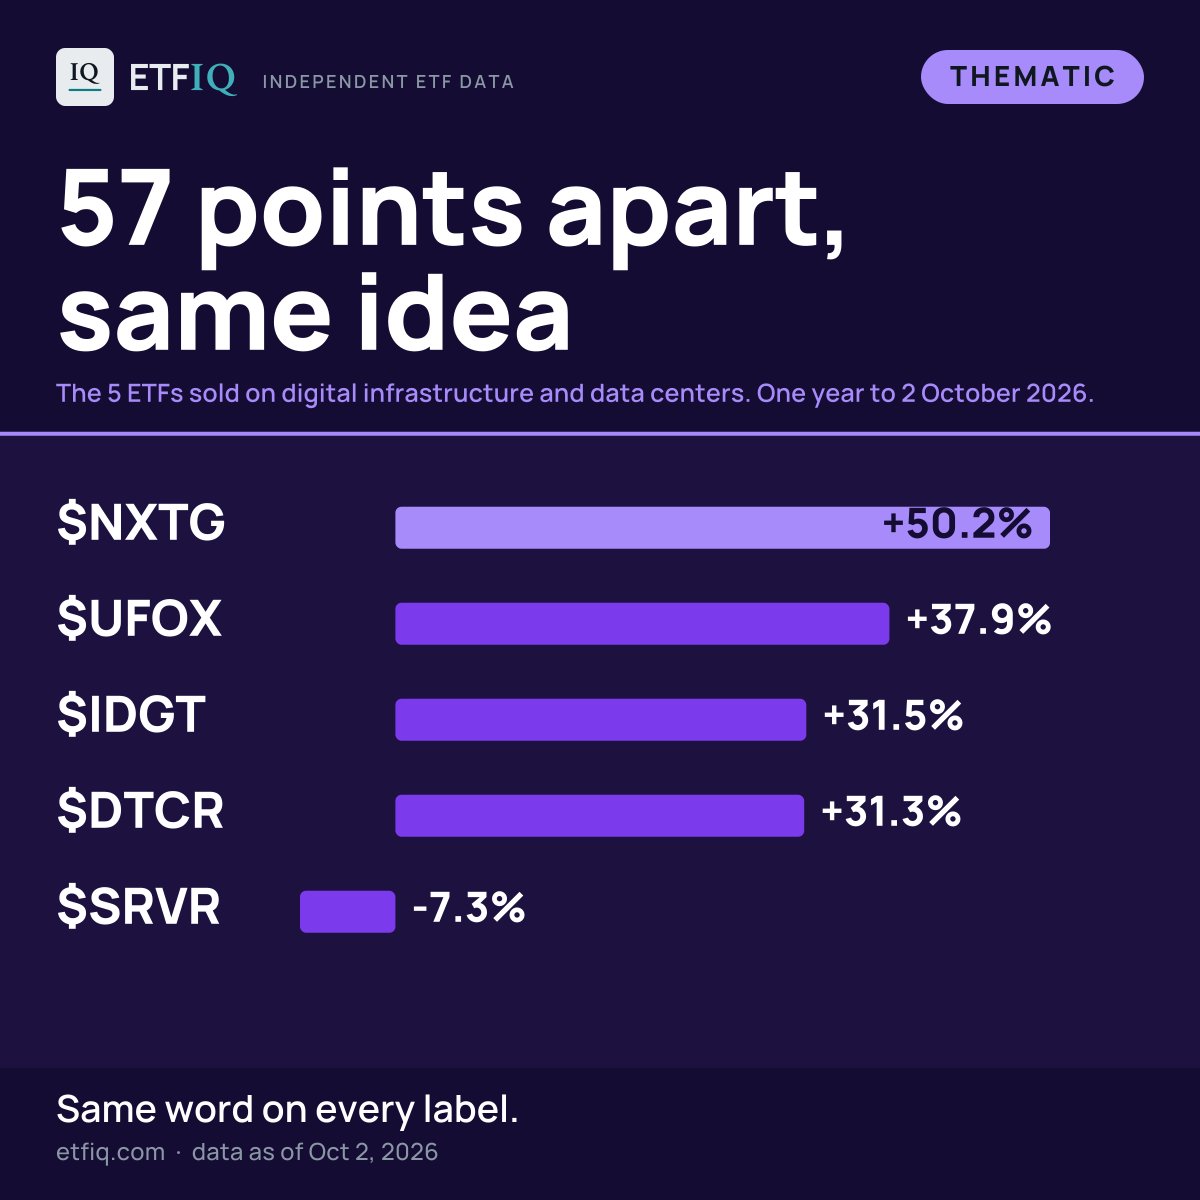
The 5 ETFs sold on digital infrastructure and data centers, over the last year:
$NXTG +50.2%
UFOX +37.9%
IDGT +31.5%
DTCR +31.3%
SRVR -7.3%
57 points apart, with the same word on every label.
Which of these is in your portfolio?
All 5: https://t.co/8KZ1qFPX8o
#ETFs #ThematicInvesting
$JEPI paid 8.0% in cash over the last year. Its price moved -1.5%.
SPY returned 15.7% over the same days.
BUYW -7.6 pts vs SPY
FTHI -6.9 pts vs SPY
RDVI -6.0 pts vs SCHD
The cash is real. So is the gap.
Look yours up: https://t.co/VxgKSfS4Ql
#ETFs#CoveredCall
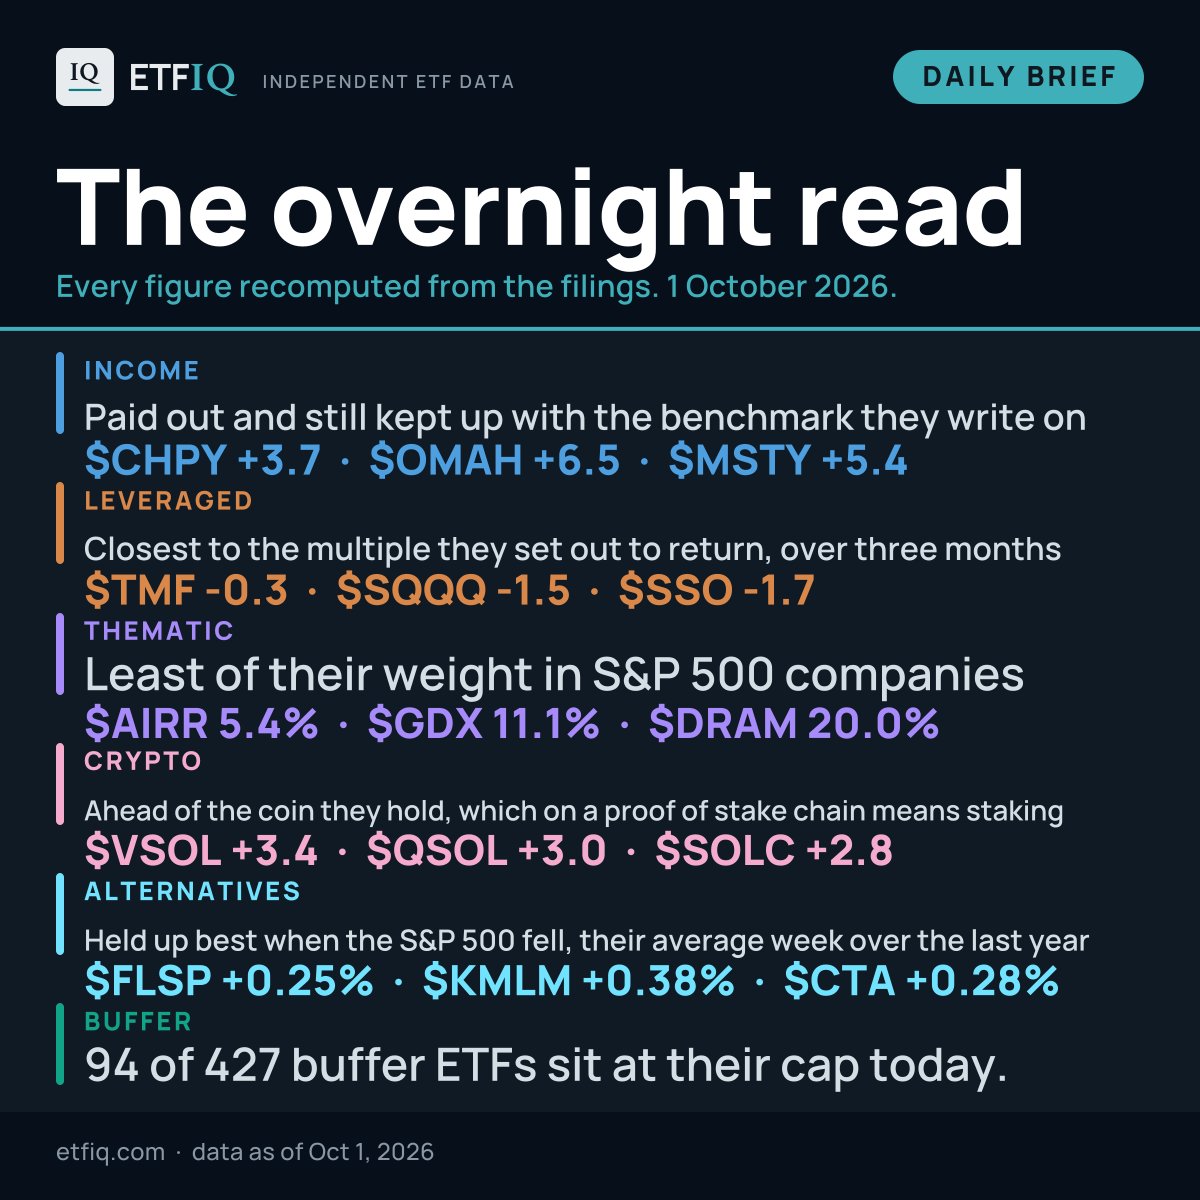
The overnight read, 2026-10-01
INCOME
Paid out and still kept up with the benchmark they write on: $CHPY +3.7, OMAH +6.5, MSTY +5.4.
LEVERAGED
Closest to the multiple they set out to return, over three months: TMF -0.3, SQQQ -1.5, SSO -1.7.
THEMATIC
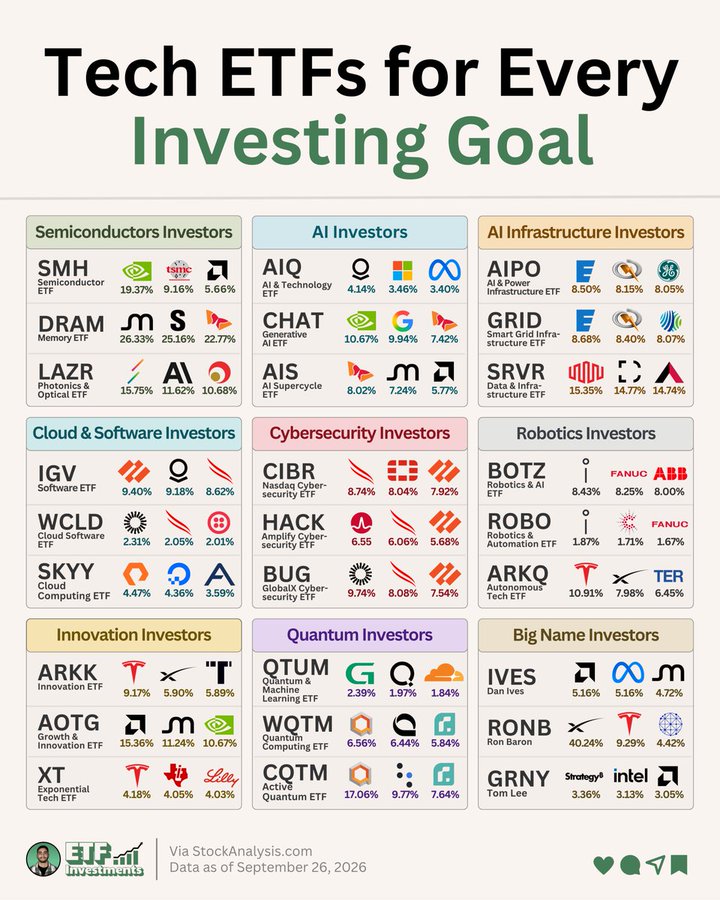
Least of their weight in S&P 500 companies: AIRR 5.4%, GDX 11.1%, DRAM 20.0%.
CRYPTO
Ahead of the coin they hold, which on a proof of stake chain means staking: VSOL +3.4, QSOL +3.0, SOLC +2.8.
ALTERNATIVES
Held up best when the S&P 500 fell, their average week over the last year: FLSP +0.25%, KMLM +0.38%, CTA +0.28%.
BUFFER
94 of 427 buffer ETFs sit at their cap today.
Every figure is calculated from a named public source, dated, and rebuilt overnight.
Reply with a ticker and we will pull its independent figure against its label.
https://t.co/NSUcnSJLIx
#ETFs #FinTwit
$GPIX and JEPI both write options on SPY.
GPIX finished +0.7 points against it over the last year.
JEPI finished -9.0.
9.7 points apart, and the one behind is 8 times the size.
Which of these do you actually hold?
Side by side: https://t.co/SNQSGyoZfb
#ETFs#CoveredCall
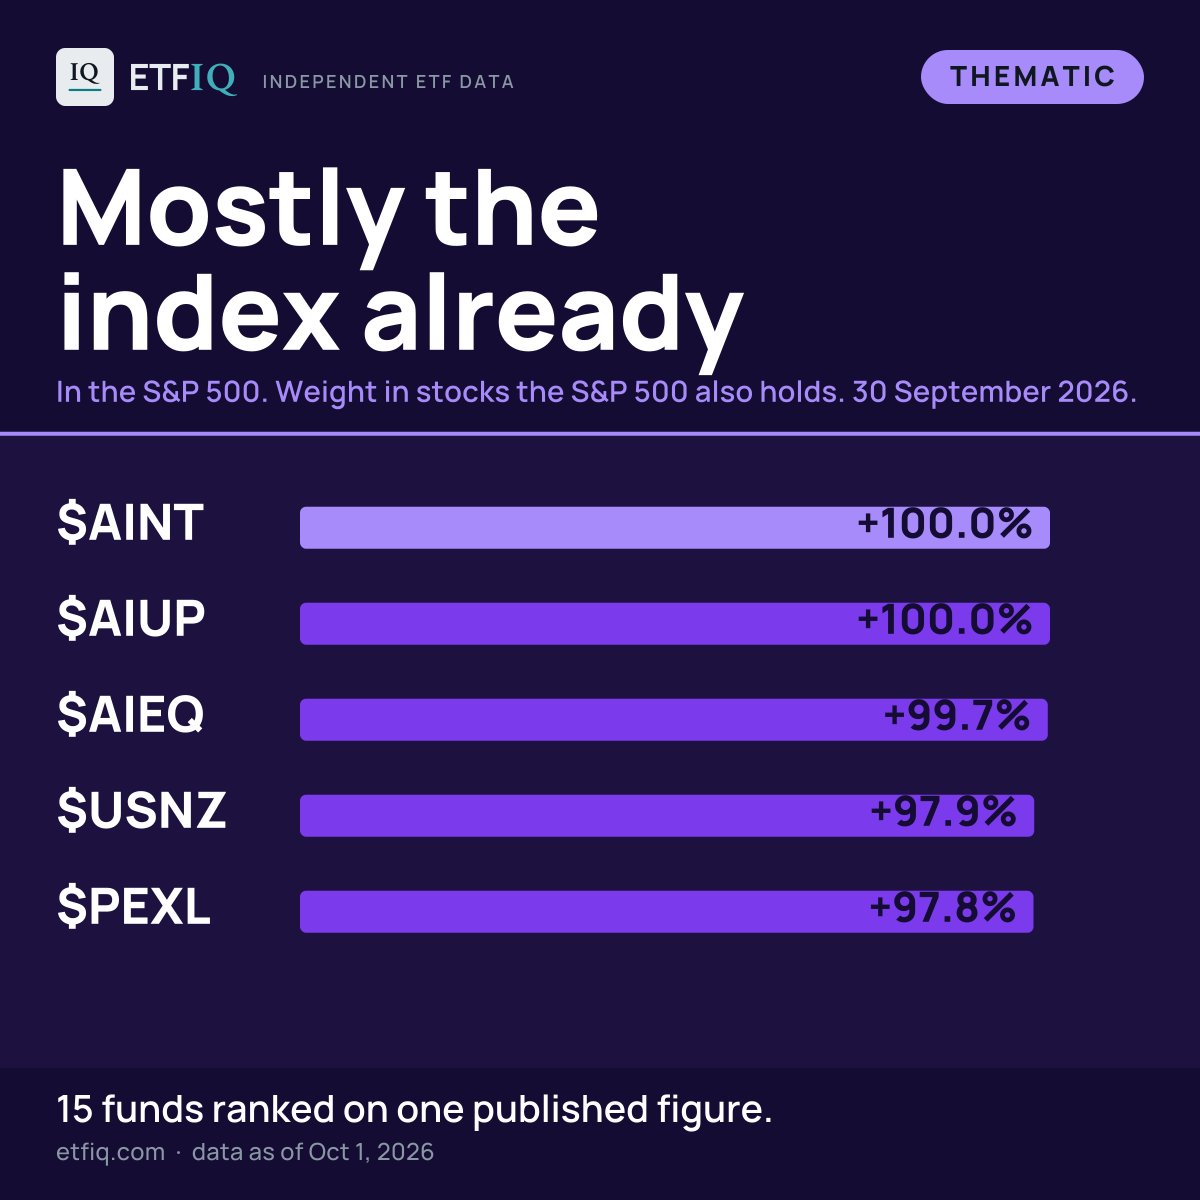
The thematic ETFs that are mostly the index already.
$AINT 100.0%
AIUP 100.0%
AIEQ 99.7%
USNZ 97.9%
PEXL 97.8%
Ranked on weight in stocks the S&P 500 also holds. 15 funds.
Which of these is in your portfolio?
https://t.co/mhYW1RKKoD
#ETFs#ETFRankings
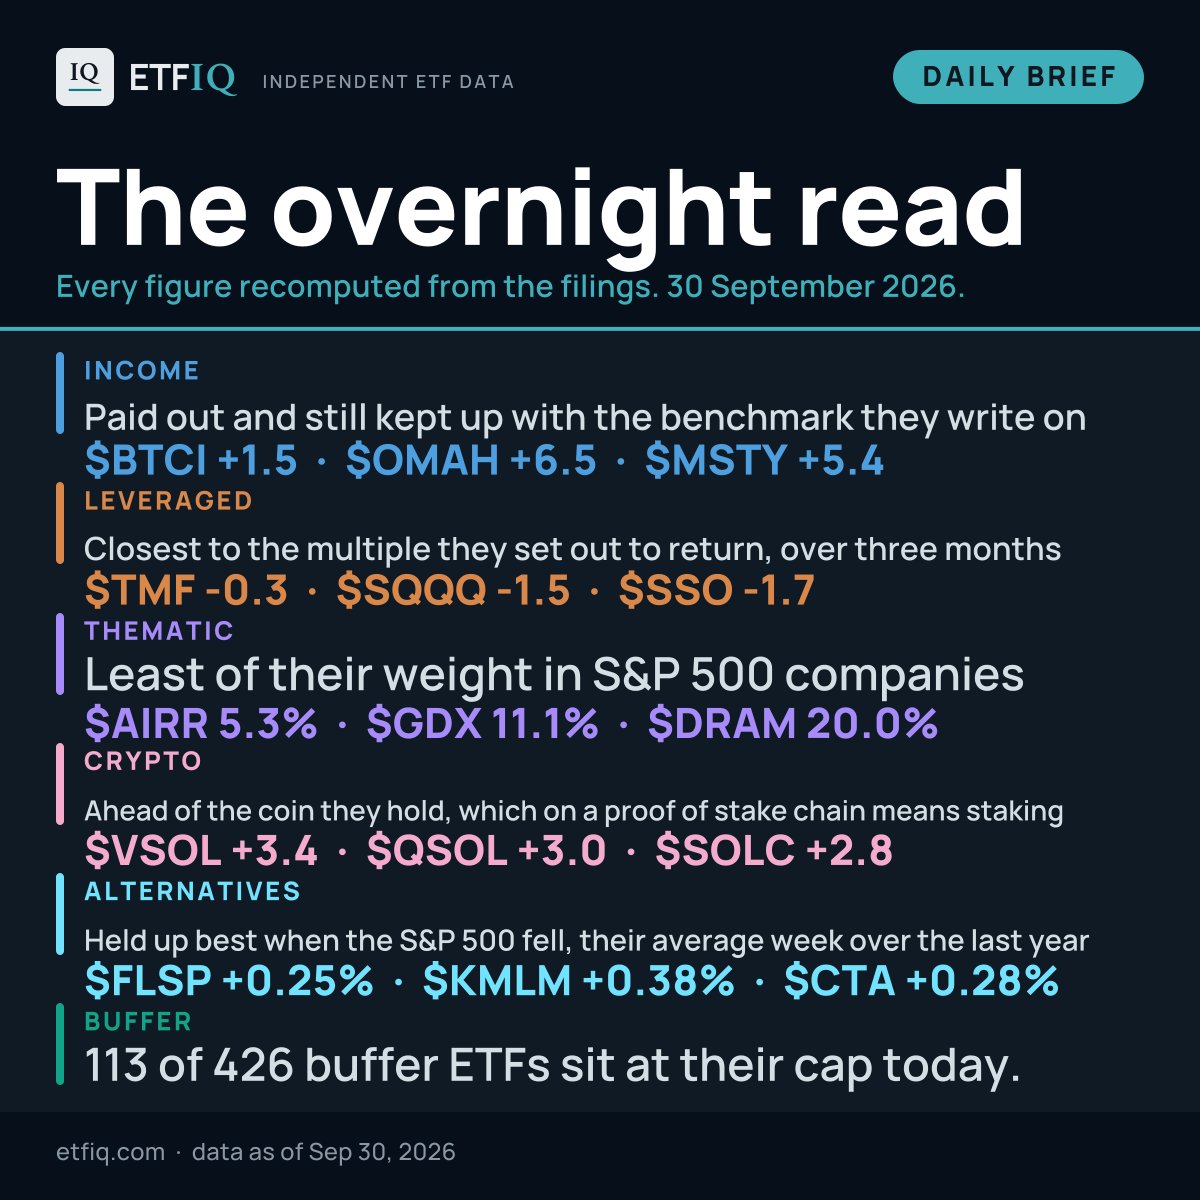
The overnight read, 2026-09-30
INCOME
Paid out and still kept up with the benchmark they write on: $BTCI +1.5, OMAH +6.5, MSTY +5.4.
LEVERAGED
Closest to the multiple they set out to return, over three months: TMF -0.3, SQQQ -1.5, SSO -1.7.
THEMATIC
Least of their weight in S&P 500 companies: AIRR 5.3%, GDX 11.1%, DRAM 20.0%.
CRYPTO
Ahead of the coin they hold, which on a proof of stake chain means staking: VSOL +3.4, QSOL +3.0, SOLC +2.8.
ALTERNATIVES
Held up best when the S&P 500 fell, their average week over the last year: FLSP +0.25%, KMLM +0.38%, CTA +0.28%.
BUFFER
113 of 426 buffer ETFs sit at their cap today.
Every figure is calculated from a named public source, dated, and rebuilt overnight.
Reply with a ticker and we will pull its independent figure against its label.
https://t.co/NSUcnSJLIx
#ETFs #FinTwit
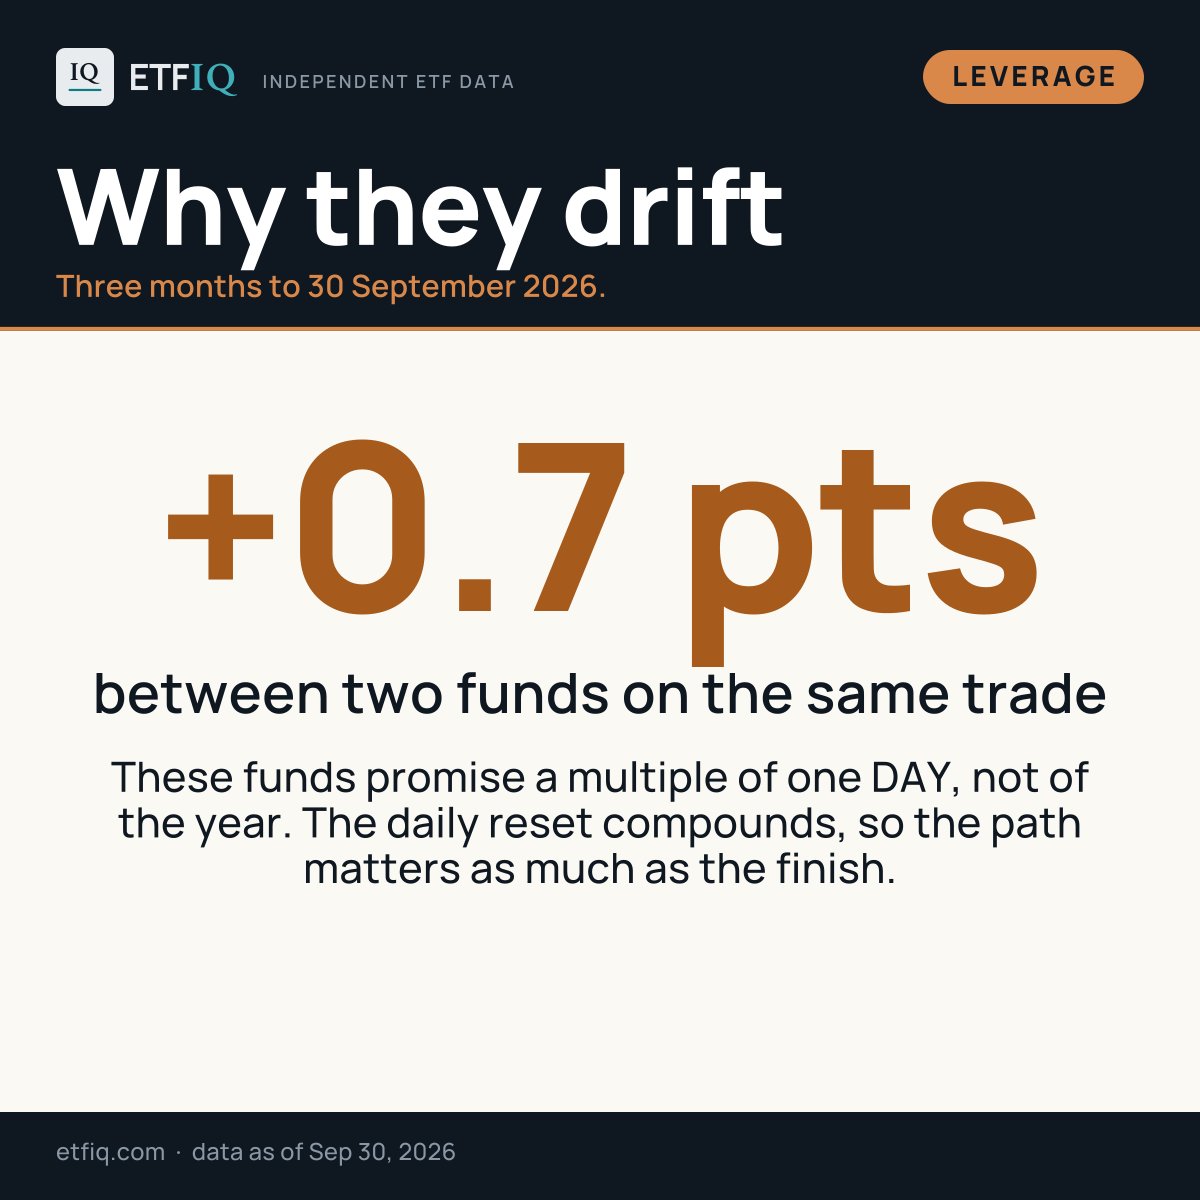
These funds promise a multiple of one DAY, not of the year. The daily reset compounds, so the path matters as much as the finish.
https://t.co/XGjxucOVdh
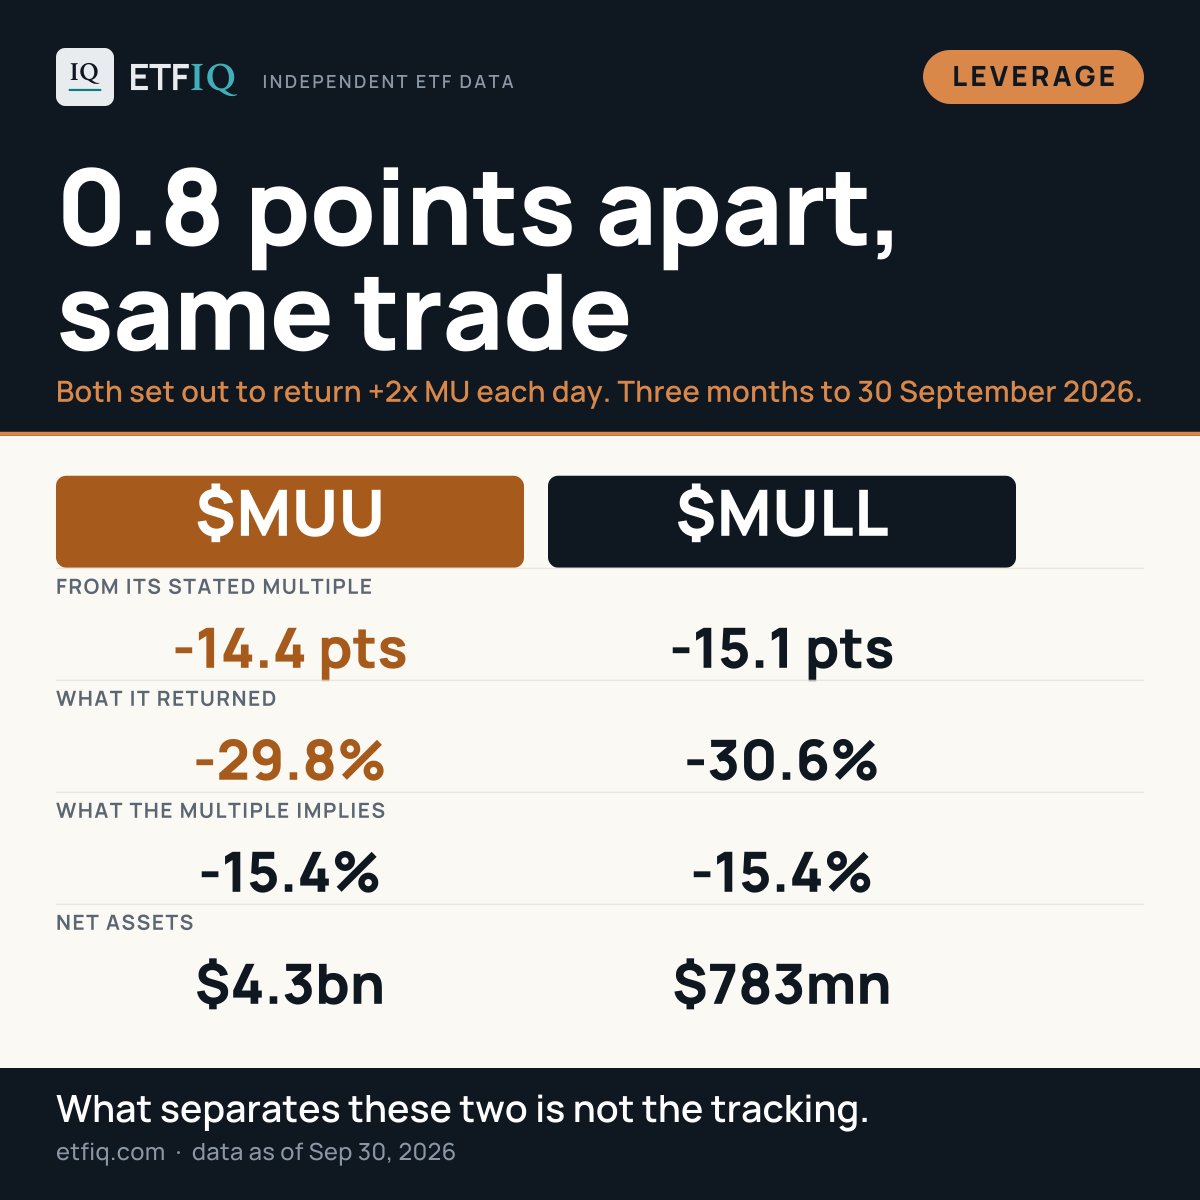
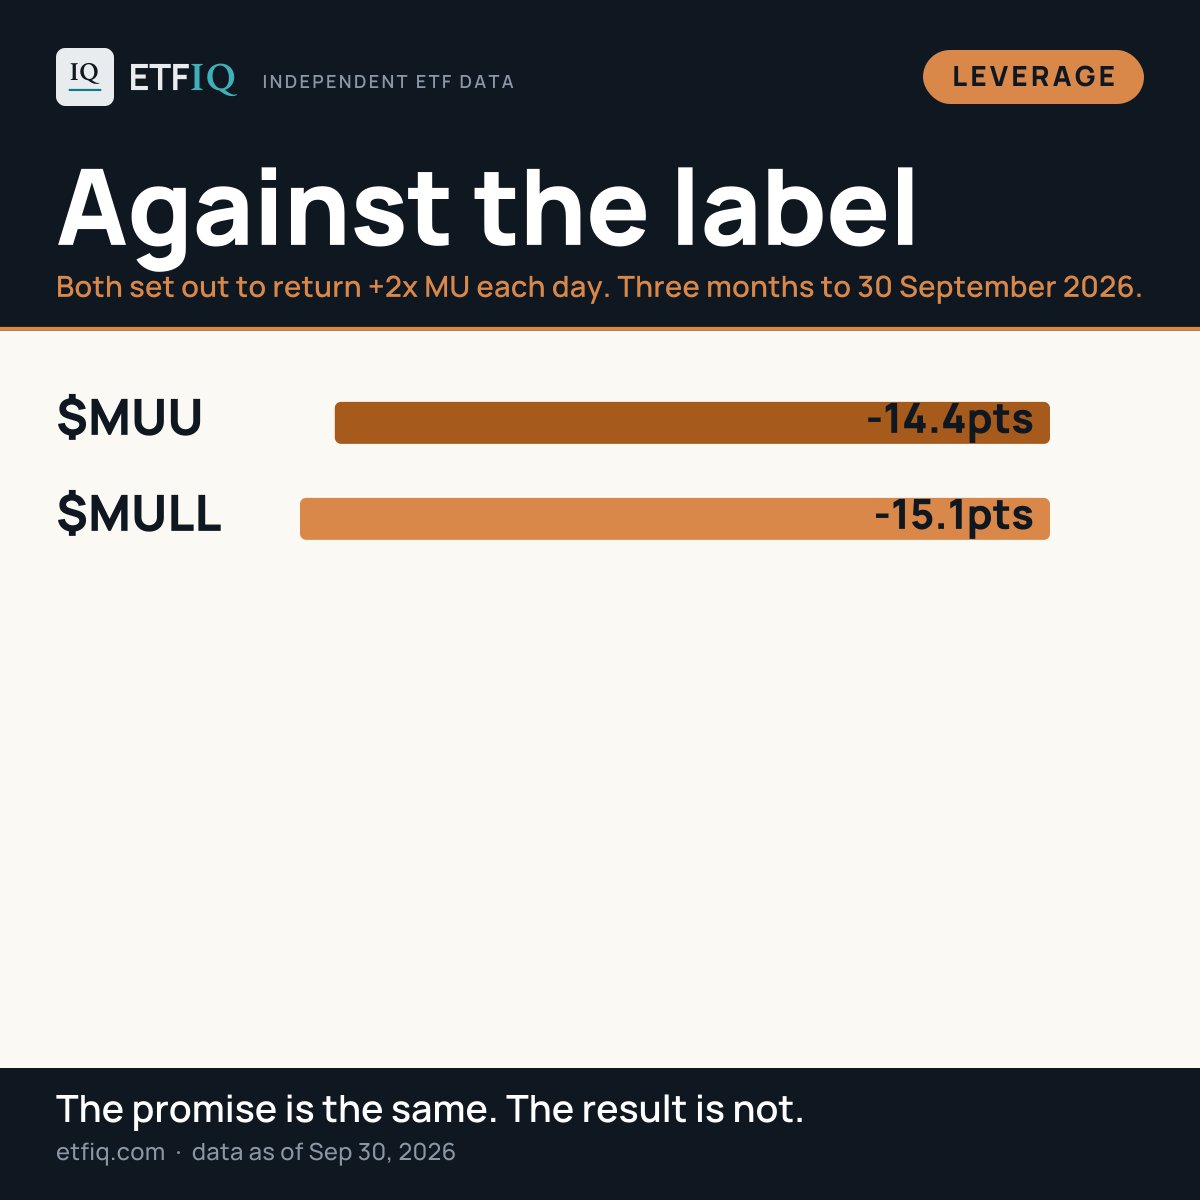
$MUU and MULL are the same trade: +2x MU, different issuers.
MUU -14.4 pts from its stated multiple
MULL -15.1 pts
0.8 points apart over three months. What separates these two is not the tracking.
Every trade sold twice: https://t.co/ZygQGnDSkp
#ETFs#LeveragedETFs
Where each one landed against its own promise.
MUU: -29.8% where -15.4% was implied
MULL: -30.6% where -15.4% was implied
Same underlying, same multiple, same three months.
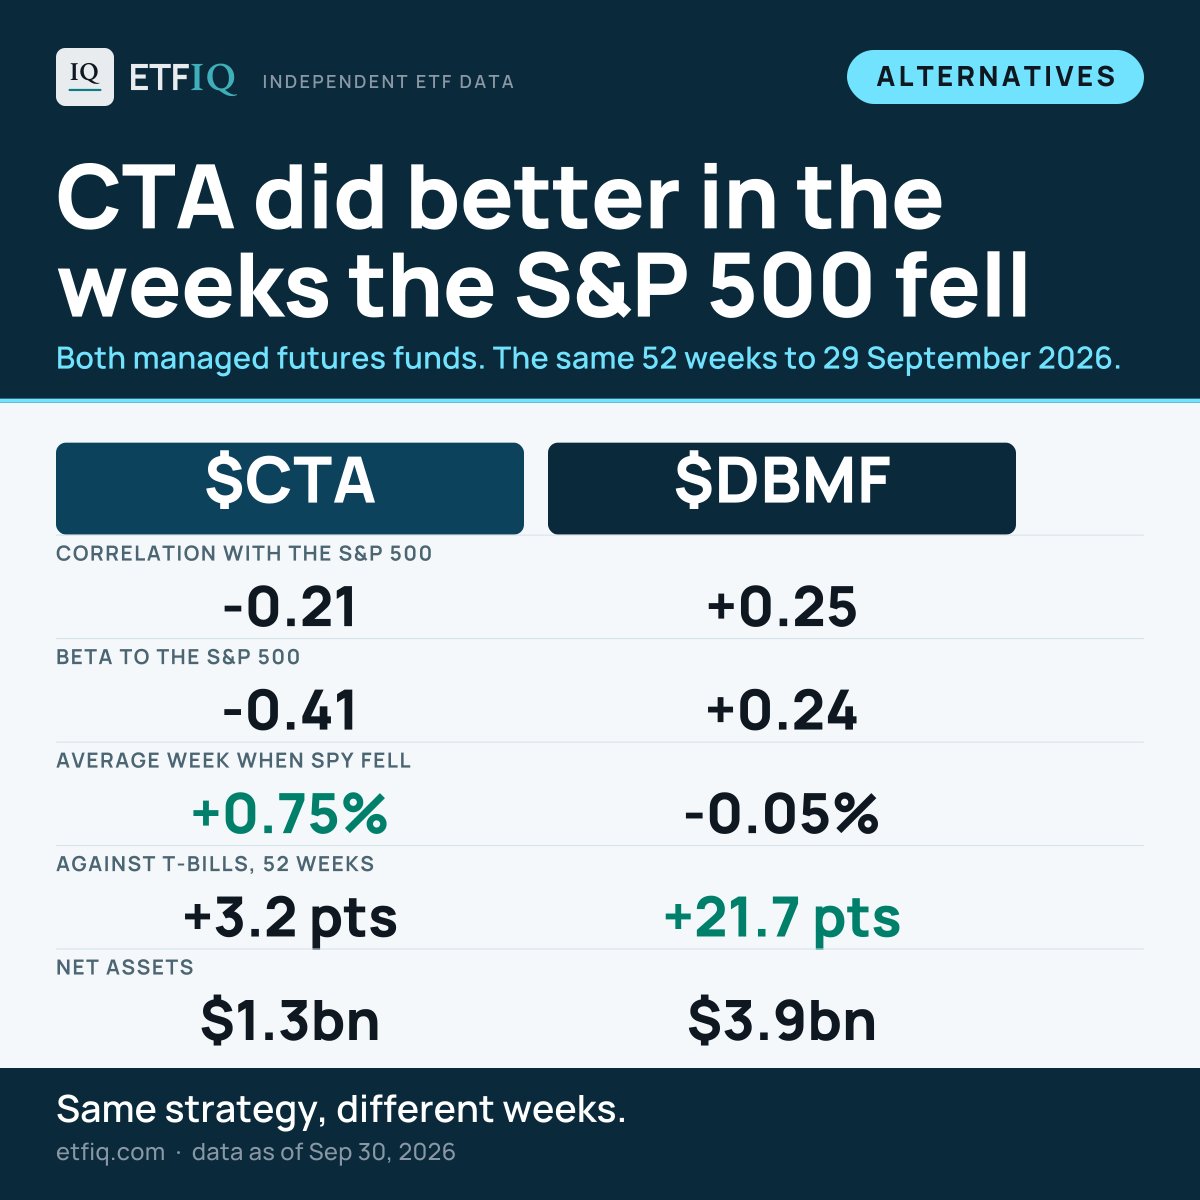
$CTA and DBMF are both managed futures funds.
SPY fell in 24 of the last 52 weeks, by 1.13% on average. In those weeks CTA averaged +0.75% and DBMF -0.05%.
Against T-bills over all 52: CTA +3.2 pts, DBMF +21.7 pts.
Side by side: https://t.co/bVIa64laB1
#ETFs#LiquidAlts
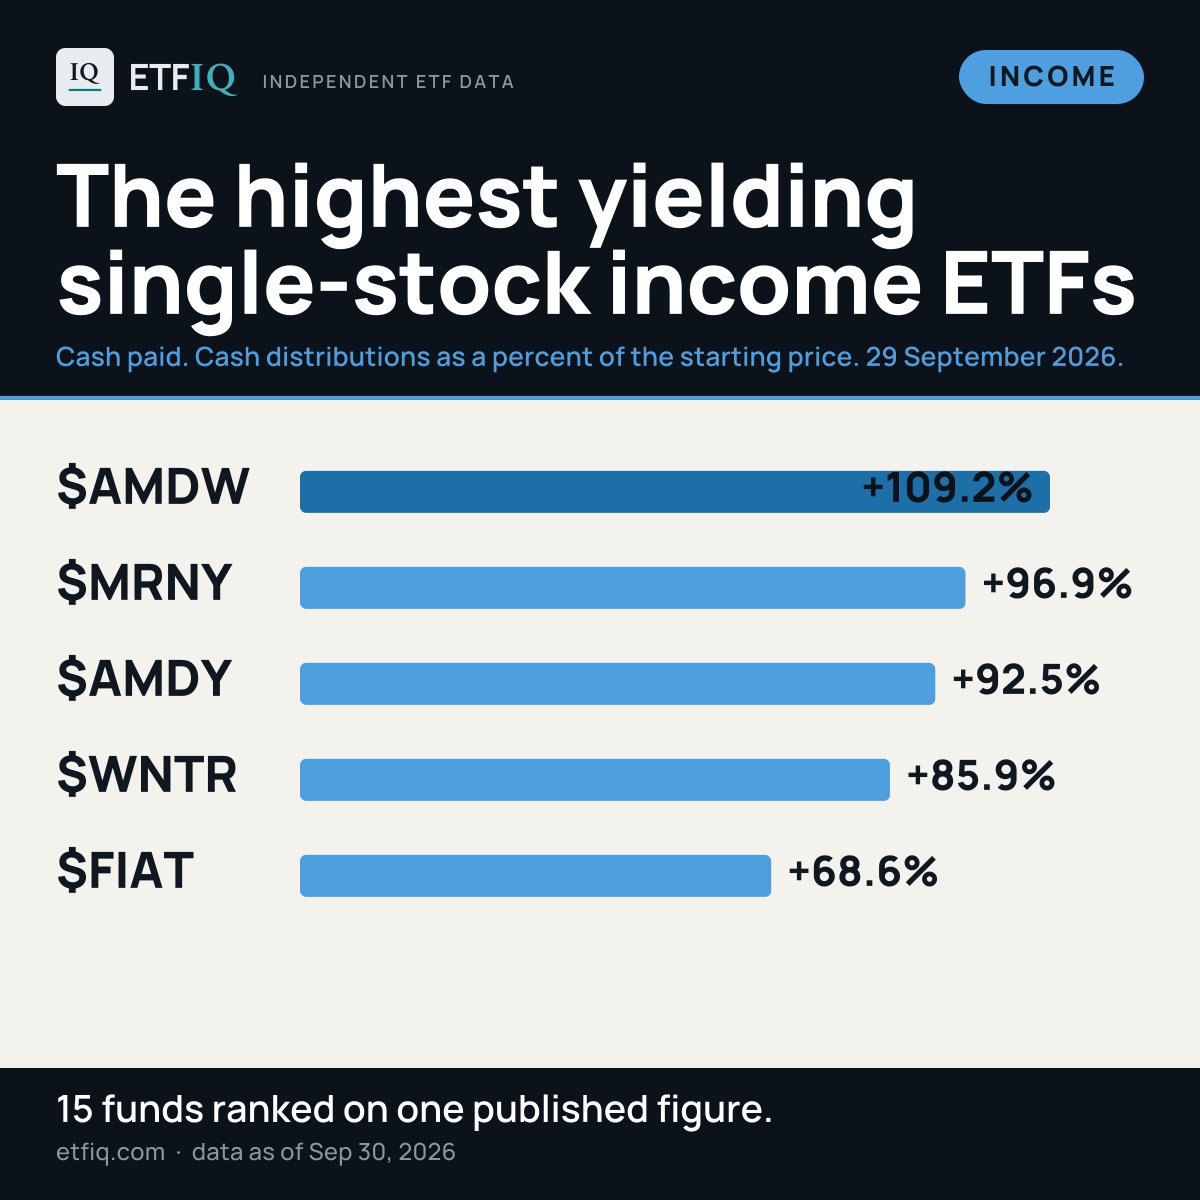
The highest yielding single-stock income ETFs.
$AMDW 109.2%
MRNY 96.9%
AMDY 92.5%
WNTR 85.9%
FIAT 68.6%
Ranked on cash distributions as a percent of the starting price. 15 funds.
Which of these do you actually hold?
https://t.co/M9gPJQSGPz
#ETFs#ETFRankings
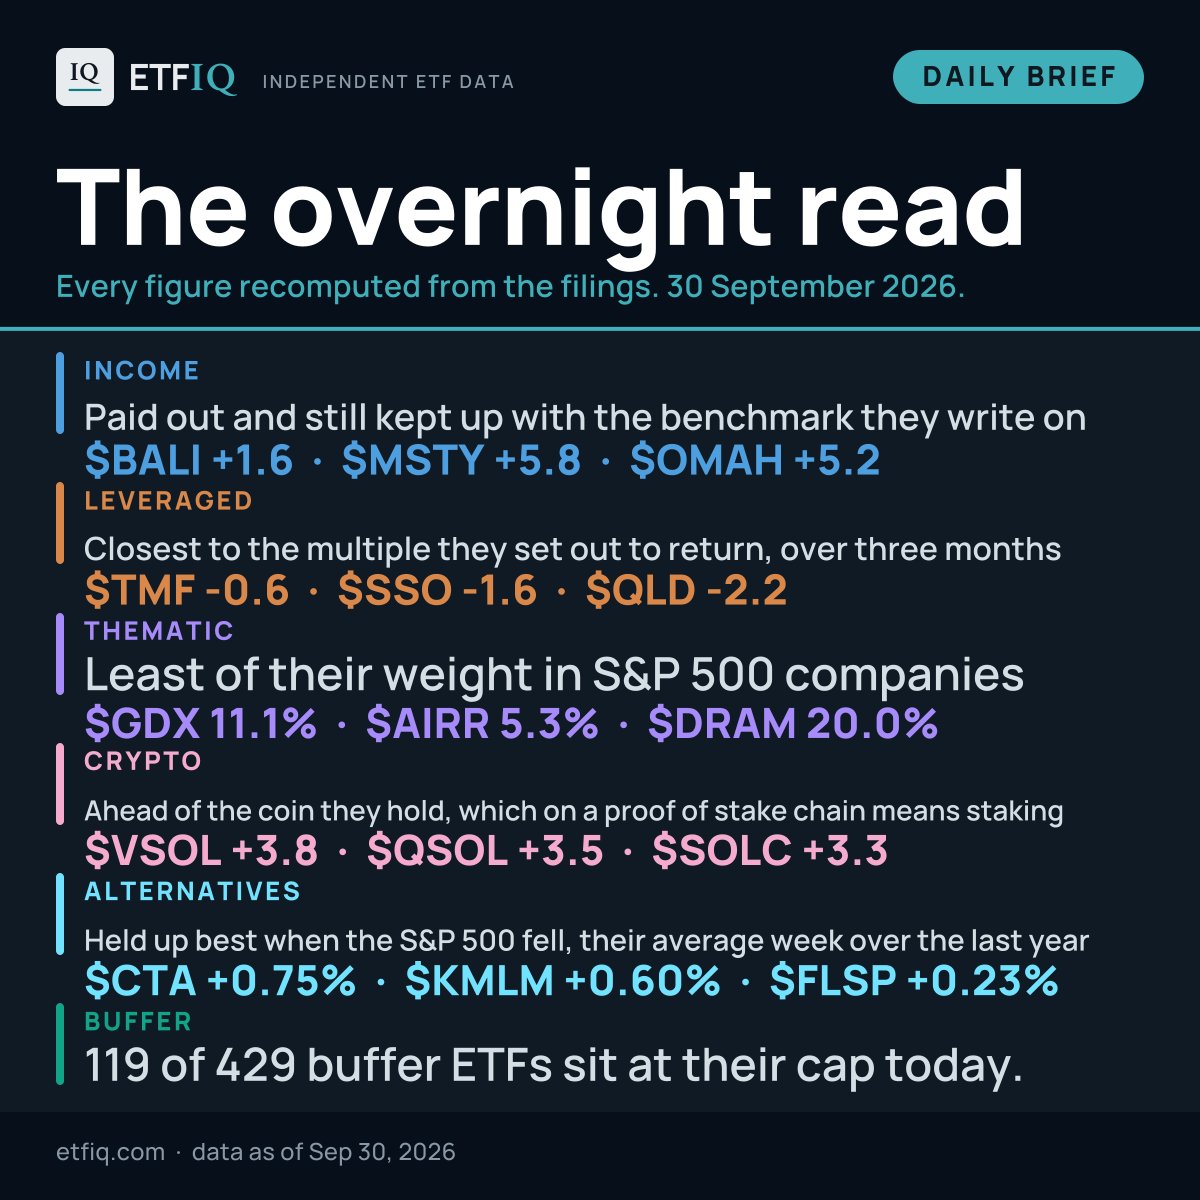
The overnight read, 2026-09-30
INCOME
Paid out and still kept up with the benchmark they write on: $BALI +1.6, MSTY +5.8, OMAH +5.2.
LEVERAGED
Closest to the multiple they set out to return, over three months: TMF -0.6, SSO -1.6, QLD -2.2.
THEMATIC
Least of their weight in S&P 500 companies: GDX 11.1%, AIRR 5.3%, DRAM 20.0%.
CRYPTO
Ahead of the coin they hold, which on a proof of stake chain means staking: VSOL +3.8, QSOL +3.5, SOLC +3.3.
ALTERNATIVES
Held up best when the S&P 500 fell, their average week over the last year: CTA +0.75%, KMLM +0.60%, FLSP +0.23%.
BUFFER
119 of 429 buffer ETFs sit at their cap today.
Every figure is calculated from a named public source, dated, and rebuilt overnight.
Reply with a ticker and we will pull its independent figure against its label.
https://t.co/NSUcnSJdSZ
#ETFs #FinTwit
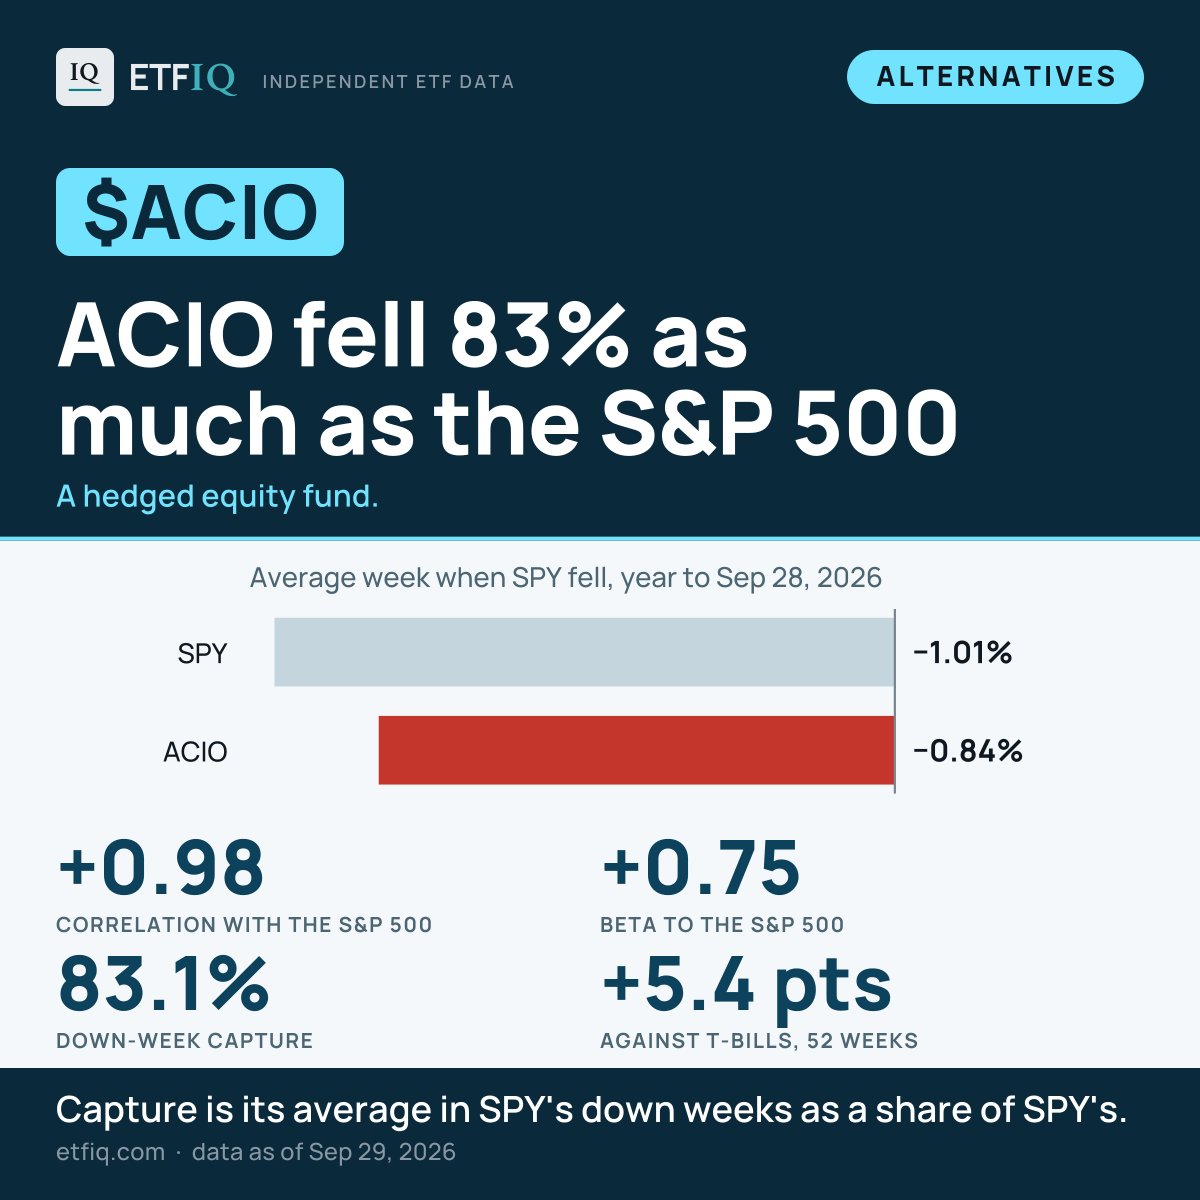
$ACIO fell 83% as much as the S&P 500.
SPY fell in 24 of the last 52 weeks, by 1.01% on average. ACIO averaged -0.84% in those weeks, with a weekly correlation of 0.98 over all 52.
Next, same weeks:
FHEQ -0.96%
HEGD -0.66%
HELO -0.54%
https://t.co/LYrewt6K08
#ETFs#LiquidAlts
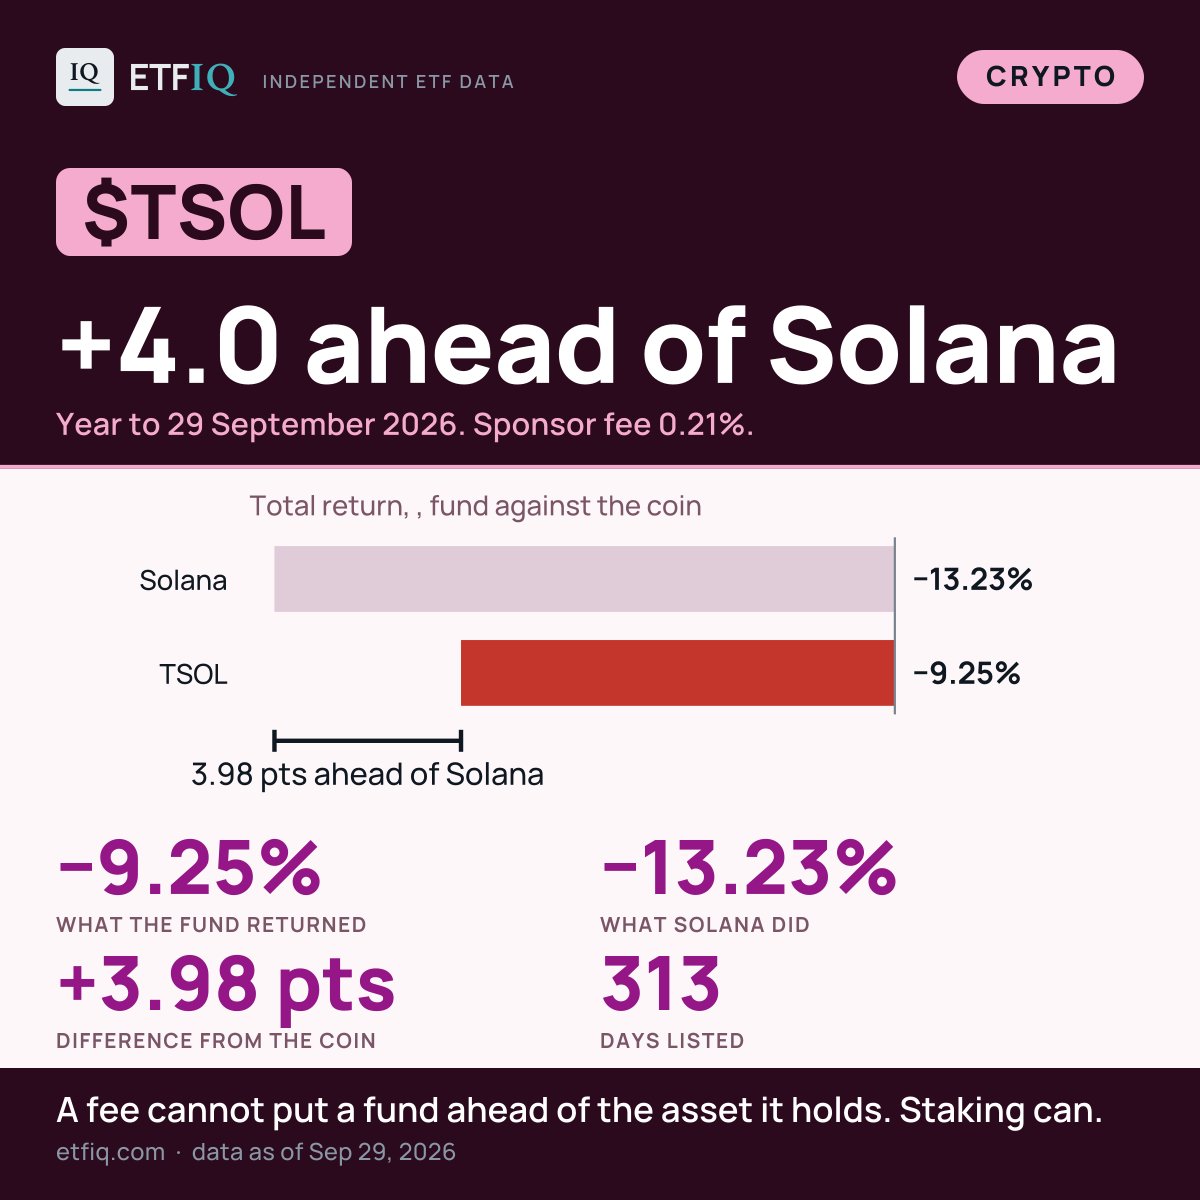
$TSOL finished +4.0 ahead of Solana itself last year, on a 0.21% fee.
QSOL +3.3 vs Solana
SOLC +3.1 vs Solana
A fund taking a fee cannot beat the price of what it holds unless it earned something on the way. On these chains there is one thing to earn.
https://t.co/fHmHdPt6vn
#ETFs #Solana
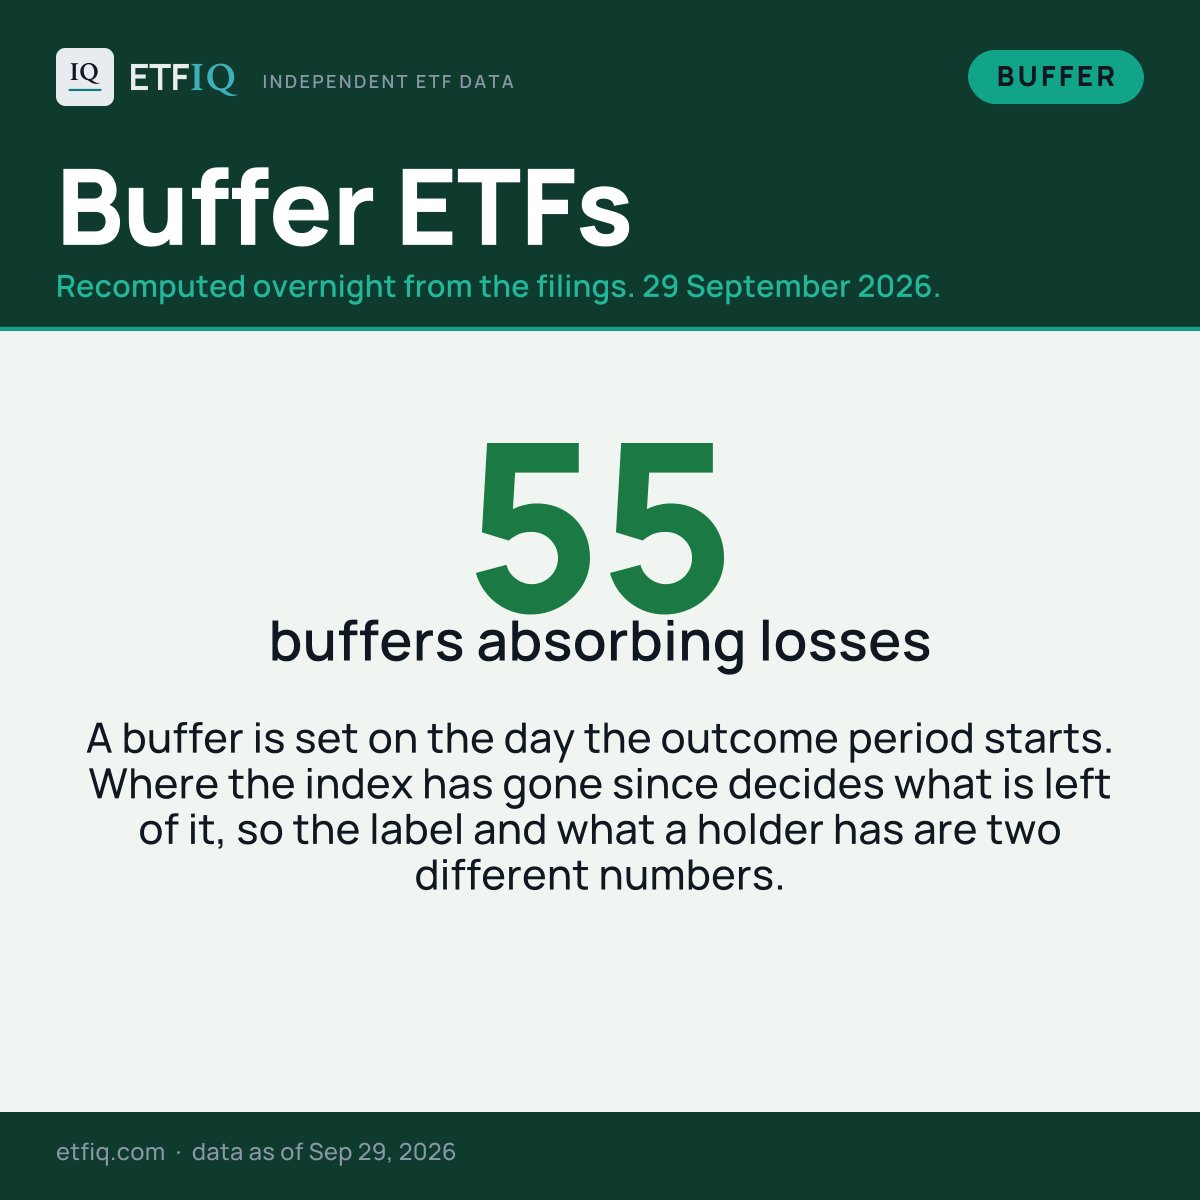
55 buffer ETFs have their buffer absorbing losses right now.
A buffer is set on the day the outcome period starts. Where the index has gone since decides what is left of it, so the label and what a holder has are two different numbers.
https://t.co/og0lKNvmiz
#ETFs #DefinedOutcome