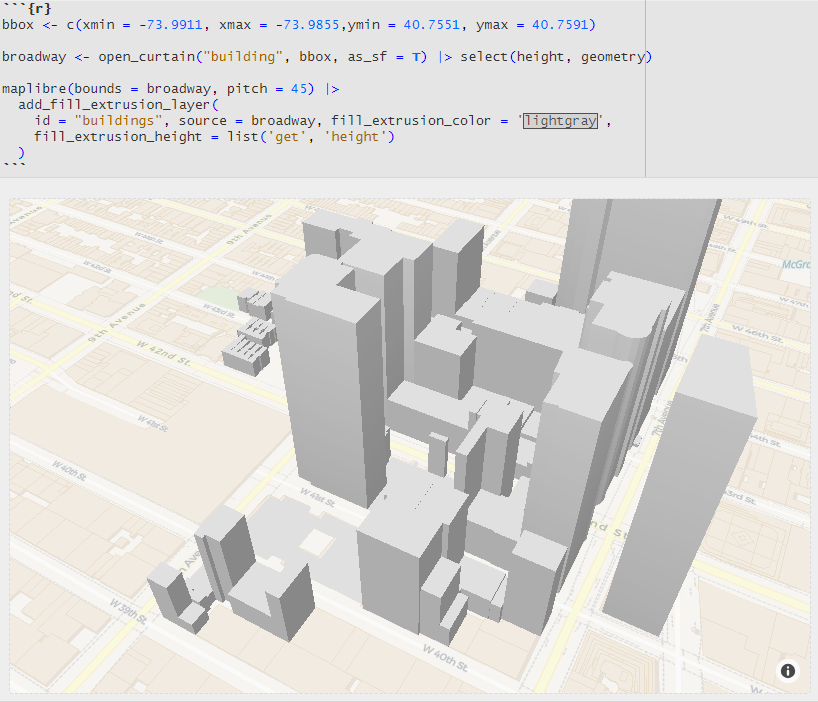
Happy to announce the release of overtureR, an #rstats package for interfacing easily with @OvertureMaps.
You can access practically every building, POI, and transit in the world, and map them, in about 5 lines of code:
https://t.co/yJ8DFiQztJ
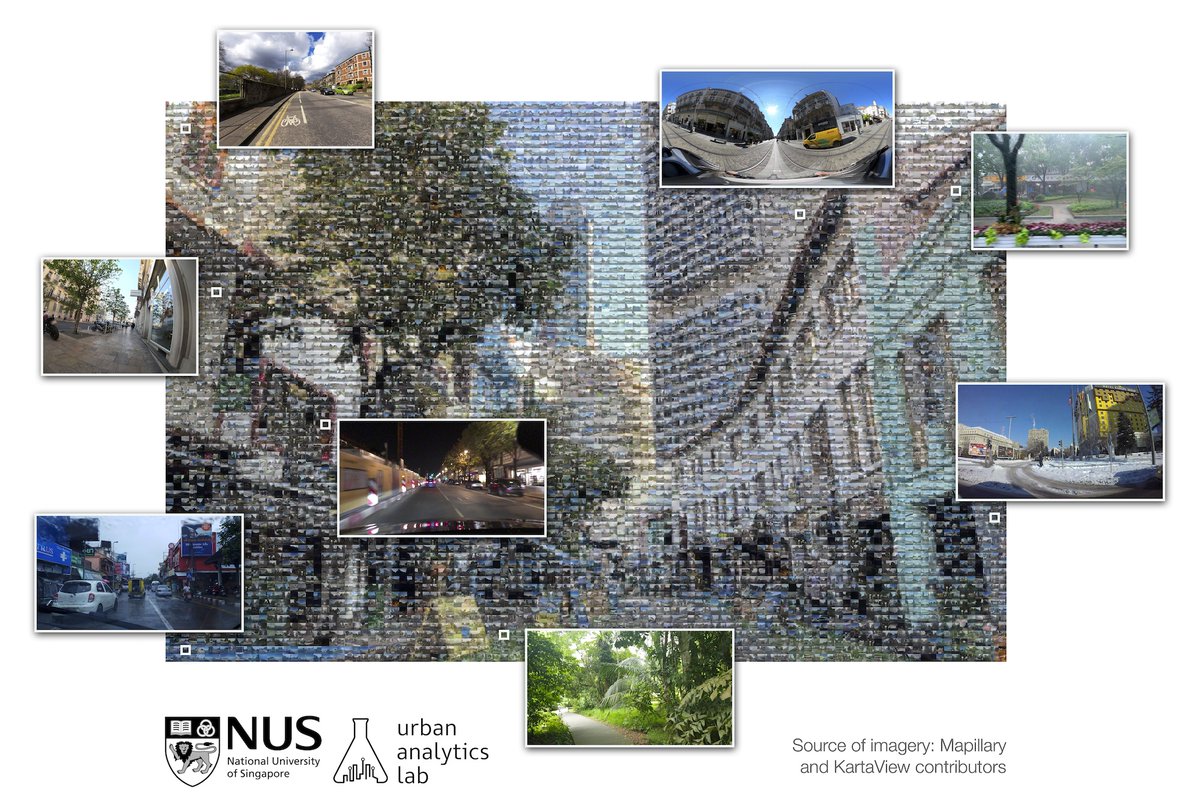
We're excited to release Global Streetscapes - a massive open dataset of 10 million street-level images labelled with 300+ attributes across 688 cities, supporting urban science and analytics! 🛣️🌏
I am proud of the team led by @yujun_hou@urbanalyticslab! https://t.co/BBh20AWv0T
New blog post by @szarnyasg:
Analyzing Railway Traffic in the Netherlands
This tutorial demonstrates some of DuckDB's key query features using datasets that capture the railway traffic in the Netherlands.
https://t.co/vYjFXVU088
@vikkimaps There are a lot of plug-ins, you can install the calendar plug-in to easily achieve todo https://t.co/syOE26sLAz the same time, you can use OneDrive to achieve multi-terminal synchronisation and management.
🚨New chart tutorial alert! 🙂
Learn how to build a clean choropleth map with a histogram included as a legend.
All made with #rstats and ggplot2. 🔥
Full tuto:
https://t.co/RjP2UX5jky
Thanks @viniciusoike for the contribution, and @joseph_barbier for the tweaks! 🙏
353 million points, 598 branches, 455 trees, 12 plots, 3 countries!
All terrestrial LiDAR data and QSM models are now available open-access https://t.co/01mCotqAh2
Explore in 3D @Sketchfab: https://t.co/3asBYnIeWd
📢Novo #censobr v0.3.2 no CRAN inclui dados agregados preliminares dos setores censitarios do censo de 2022 https://t.co/cVwGSEItE4
#rstats
df <- censobr::read_tracts(year = 2022,
dataset = "Preliminares",
as_data_frame = T)
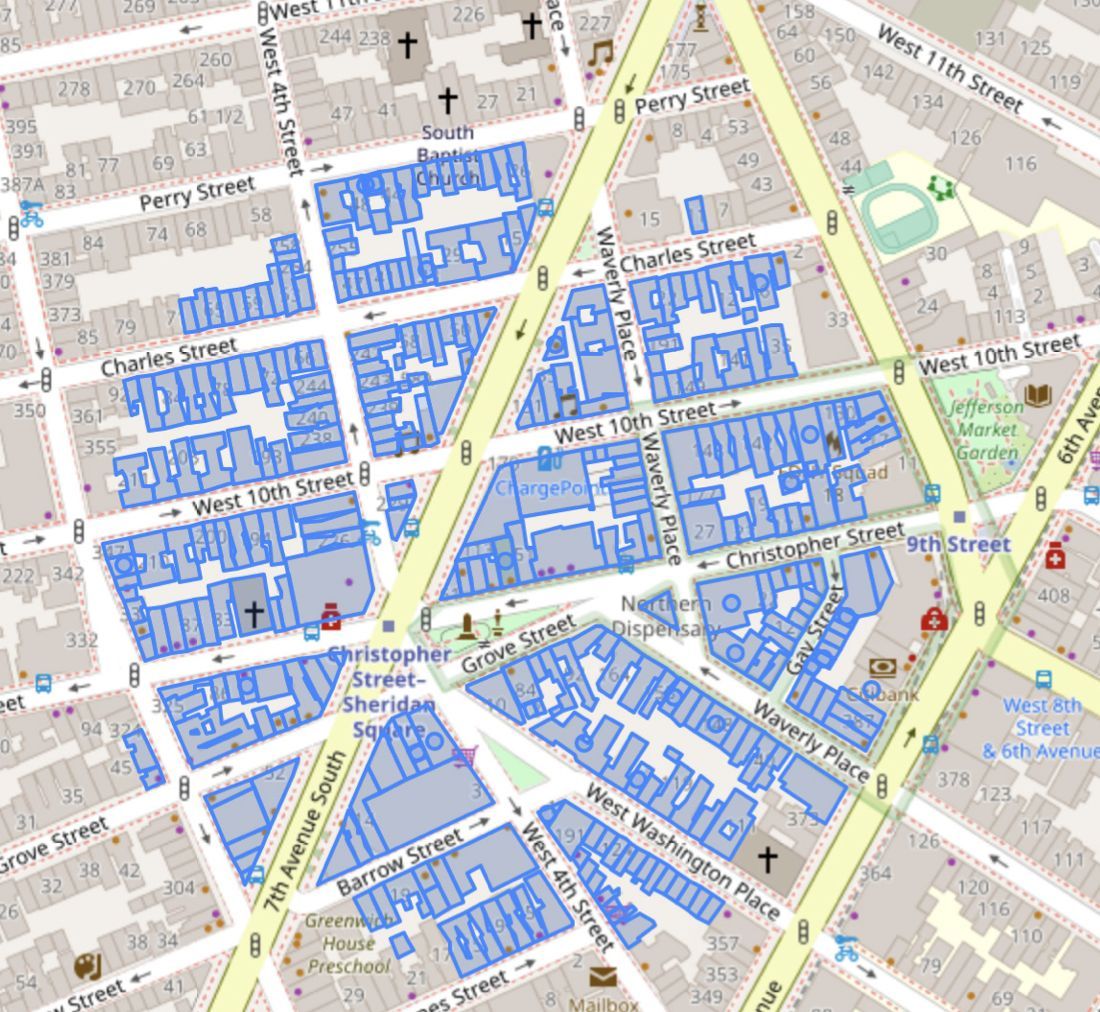
This is the fastest @OvertureMaps viewer I've come across so far. @Fused_io host a spatially-optimised version which lets you fly around the 250 GB+ of building data quickly. Full coding environment as well.
After helping you grasp the fundamentals of SQL, our book Spatial SQL guides you through the more advanced topic of spatial relationships and its parts – spatial joins, aggregations, overlay functions, clustering, and more. Check it out here: https://t.co/skoL7xjVdp
#spatialSQL
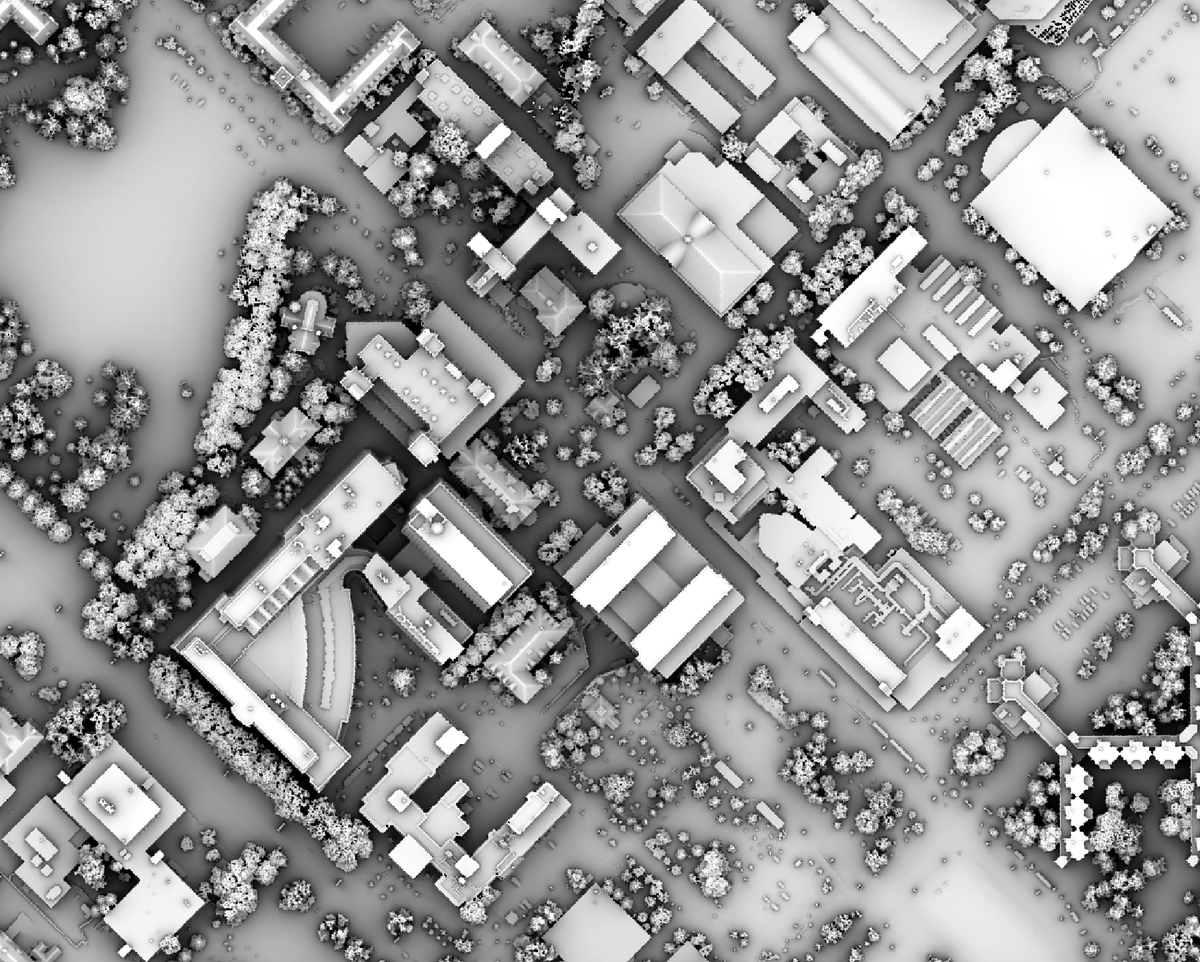
Sky-view factor (SVF) is now available in Whitebox Workflows Professional (WbW-Pro). The SVF is the proportion of the celestial hemisphere not obstructed by surrounding land surface. It is often used to model diffuse light and also for relief shading. And don't forget, there's a great #QGIS plugin for WbW-Pro! #GIS #gischat #geoprocessing #geopython #python #geospatial
Tool description: https://t.co/x3XPMxJNoe
Purchase a license here: https://t.co/2HUHZWKnWU
Our research group is working hard on another new dataset that we intend to release openly: a big labelled, diverse & organised set of millions of street-level images covering more than 600 cities worldwide.