Since 1999, 5 quarterbacks have produced a single-game stat line of:
350+ passing yards
80%+ comp pct
2+ passing TD
0 INT
And lost.
Big Ben, 37/46, 408, 3/0
Brees, 37/45, 439, 3/0
Matt Ryan, 30/36, 356, 4/0
Watson, 33/41, 373, 2/0
Tua*, 37/46, 365, 2/0
*last night
Worst QBs on passes of 35+ air yards since the start of 2022:
Jordan Love: 2/12, 79 yards, 0 TD, 3 INT
Marcus Mariota: 1/18, 75 yards, 1 TD, 3 INT
Kenny Pickett: 2/12, 107 yards, 1 TD, 3 INT
Josh Dobbs: 1/12, 39 yards, 0 TD, 1 INT
Jimmy Garoppolo: 1/10, 56 yards, 0 TD, 1 INT
Here is an update through Week 5. This does not include SNF.
With Hill off the field, excluding spikes, Tua is:
34 for 36
390 yards
2 TD, 0 INT
130.3 passer rating
Jaylen Waddle has 11 catches on 11 targets, with 116 yards.
Quarterback EPA per pass attempt and CPOE graph through 3 weeks (excluding MNF).
Tua Tagovailoa has been arguably the best QB in football through 3 weeks, but he's been even better in his 18 pass attempts with Tyreek Hill not on the field.
Quarterback EPA per pass attempt and CPOE graph through 3 weeks (excluding MNF).
Tua Tagovailoa has been arguably the best QB in football through 3 weeks, but he's been even better in his 18 pass attempts with Tyreek Hill not on the field.
How well did each team do what they should have on 3rd down in 2022?
In other words, how often did offenses convert 3rd and shorts and how often did defenses get off the field on 3rd and long?
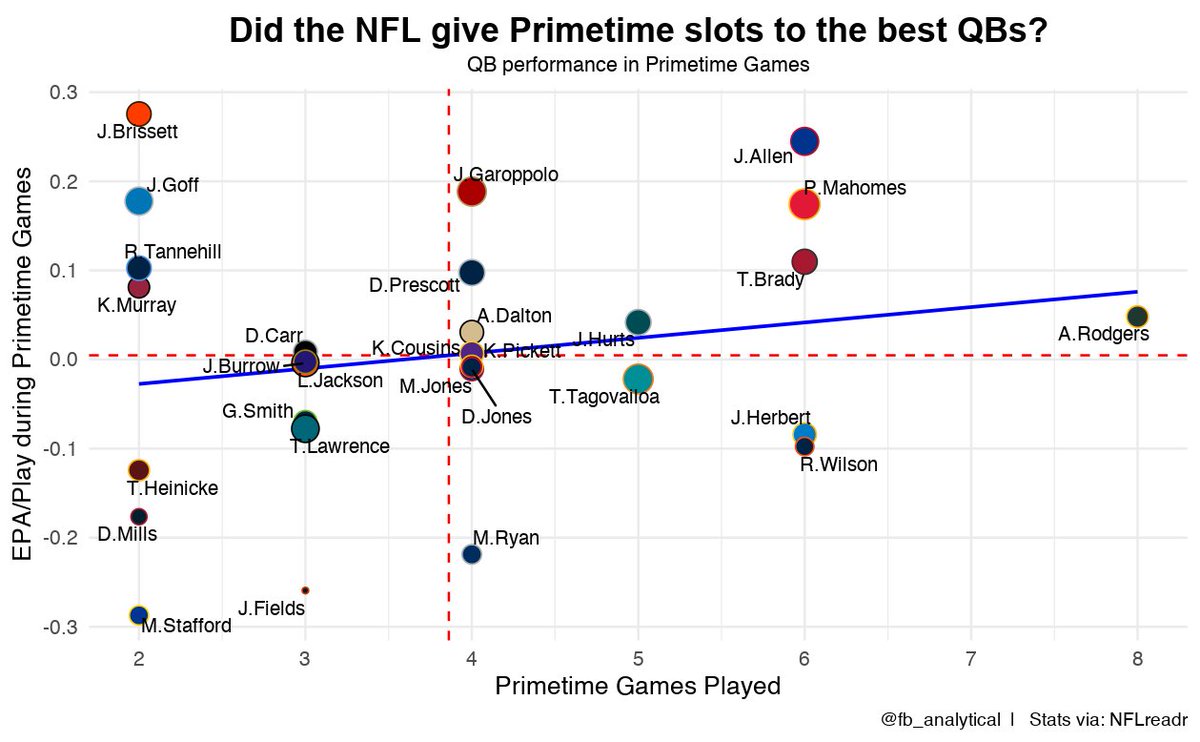
The NFL didn't do a great job of putting their best primetime performers on National TV in 2022.
*size of dot is season-long EPA
**minimum 2 primetime games
In honor of the NFL schedule release tomorrow night, this chart shows which quarterbacks performed best during primetime and in non-primetime games.
Primetime is categorized as any stand-alone game (i.e. Thanksgiving, international, etc.)
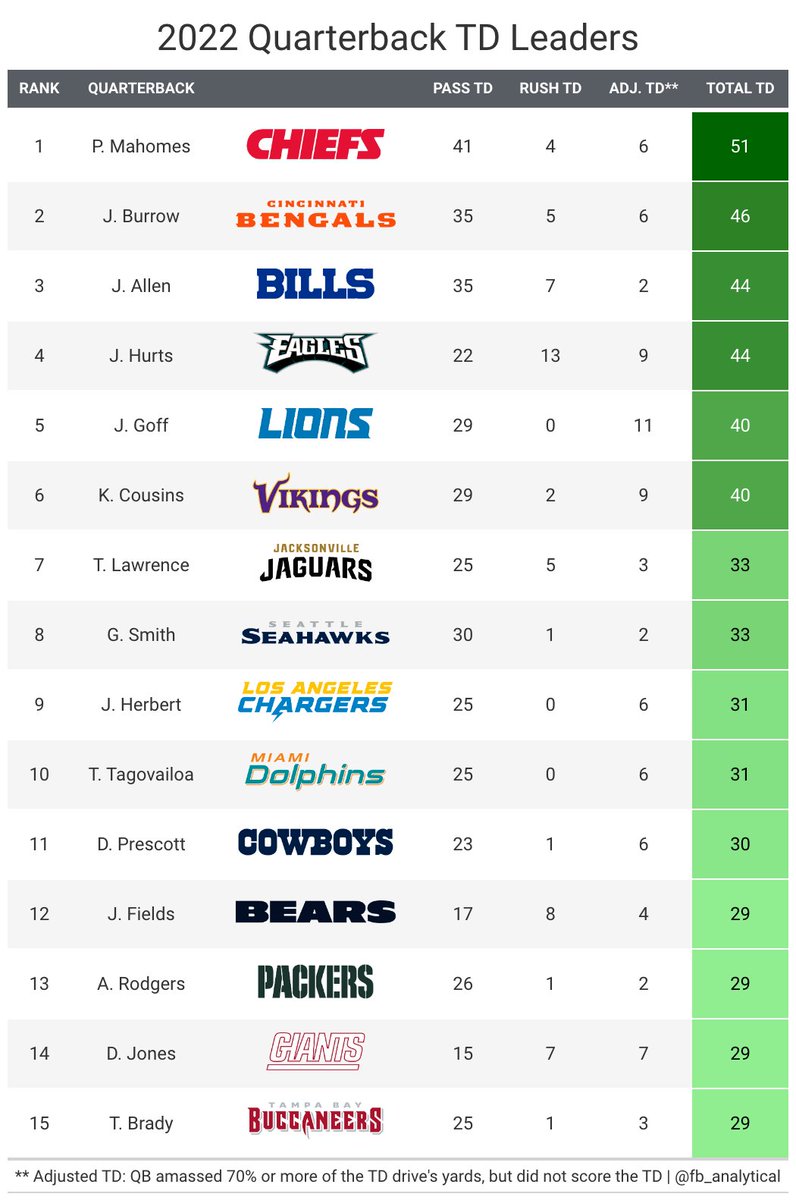
If the quarterback was responsible for 70% of the team's yards on a scoring drive (either passing or rushing), but did not score the touchdown, he was rewarded an "Adjusted Touchdown".
Here are the total TD leaders from 2022 with Adjusted TDs included:
Touchdowns are a flawed stat when analyzing an individual player - a quarterback can go 8 for 8 for 98 yards on the drive, only for him to hand it off to the running back who sneaks it in for a 1 yard TD.
I created "Adjusted Touchdowns" to account for this.
(1 of 2)
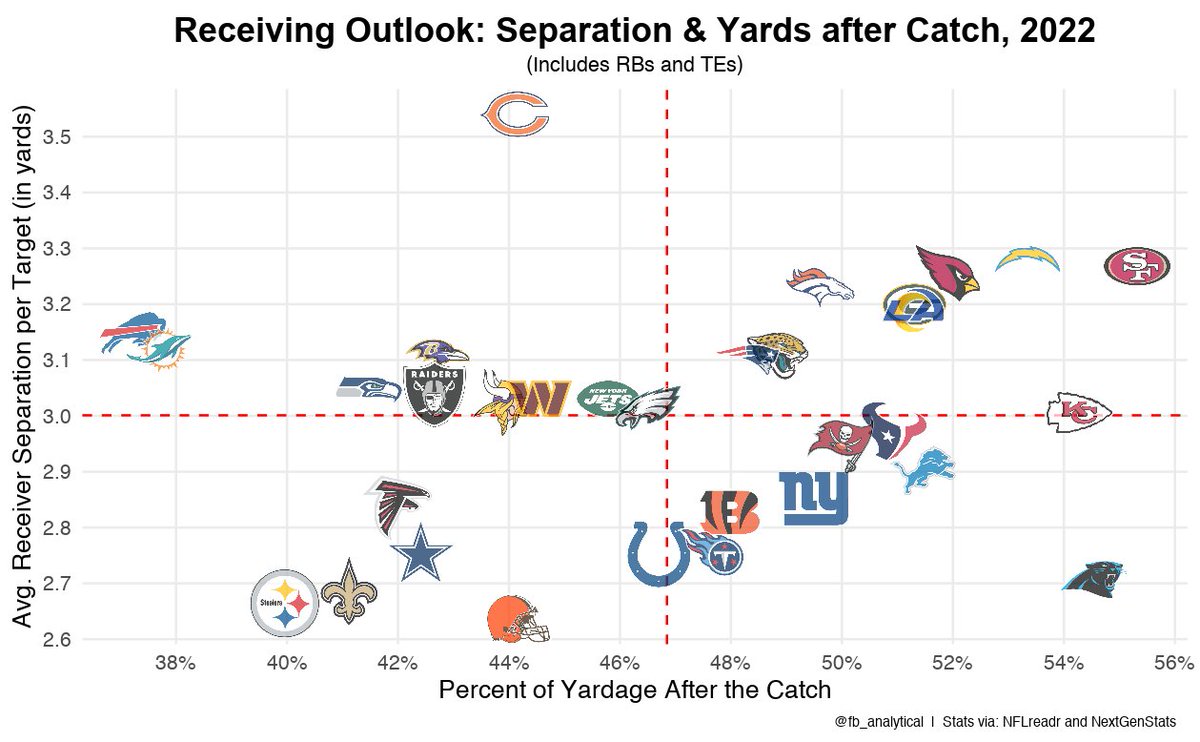
Here's the graph of average receiver separation on targets and percent of yards after the catch grouped by team. This includes running backs and tight ends as well.
Does anything stick out to you?
How wide receivers mapped up by average separation on targets (per NextGenStats) and the percent of their receiving yardage that came after the catch in 2022