I’m not here to tell you what to buy.
I’m here to figure out what’s actually going on.
Markets, businesses, AI, money, books, life — whatever catches my attention.
One interesting idea.
One rabbit hole. 🐇
Let’s see where it takes us.
🚨 $OPEN — FIVE EXTREME DIVERGENCES. ONE MASSIVE MACRO SHIFT?
WHAT IF THE MARKET IS MISSING THE BIGGER PICTURE?
On October 14, stocks plunged, especially AI-related names. Yet Treasury yields reversed sharply lower after an initial spike.
STOCKS FELL. TREASURIES ATTRACTED BUYERS. YIELDS RETREATED.
My thesis: fears over AI valuations, massive CapEx and debt-funded infrastructure may be restoring Treasuries’ SAFE-HAVEN status.
LET ME BE CLEAR: AI IS NOT A BUBBLE.
I believe AI is a generational revolution. At current prices, I consider $CRWV (CoreWeave) an exceptional long-term BUY.
But technological progress doesn’t prevent market corrections or capital rotations.
REMEMBER THE DOT-COM CRASH:
In 2000:
🔴 Nasdaq: −39.3%
🟢 US Equity REITs: +26.4%
A 66-POINT DIVERGENCE.
March 2000–September 2002:
🟢 REITs: +45%
🔴 Large-cap growth: −44%
Nasdaq peak-to-trough: approximately −78%.
The internet wasn’t a failed revolution. Capital allocation simply changed.
NOW LOOK AT $OPEN’S FIVE DIVERGENCES.
1️⃣ MACRO — YIELDS DOWN, OPEN DOWN.
October 5–14:
📉 Treasury 10Y: −12 bps
📉 Treasury 30Y: −14 bps
📉 Zillow 30Y mortgages: −12 bps
🔴 $OPEN: −13.9%
High yields supposedly justified OPEN’s weakness. Now yields and mortgage rates are retreating, but OPEN keeps falling.
2️⃣ SECTOR — REAL ESTATE UP, OPEN DOWN.
🟢 $XLRE: +2.1%
🔴 $OPEN: −13.9%
16 PERCENTAGE POINTS APART.
Different business models, but a striking divergence as listed real estate shows relative strength.
3️⃣ FUNDAMENTALS — OPERATIONS IMPROVE, PRICE COLLAPSES.
🏠 Weekly acquisition contracts: 525 vs. 129 (+307% YoY)
🏠 Previous week: 477 vs. 126 (+279%)
🏠 Q3 resale closings: 2,728 vs. 2,653
🏠 Early Q4 closings: +35% YoY (Oct. 7)
📈 Q2 contribution margin: 5.8% vs. 4.4%
Acquisitions accelerate. Efficiency improves. The stock collapses.
Operational progress isn’t guaranteed profitability. But why such extreme pessimism?
4️⃣ TECHNICAL — HISTORIC OVERSOLD EXTREMES.
📉 Daily RSI: ~22
📉 Weekly RSI: ~25, below the previous historical low of ~27 on my chart.
OPEN is testing the $1.90–$2.10 historical area.
Not proof of a bottom. But an extraordinary oversold setup.
5️⃣ SHORT INTEREST — BEARISH EXPOSURE VS. OPERATIONAL PROGRESS.
⚠️ 230.5 MILLION SHARES SHORT (Sept. 30).
Improving operating indicators alongside massive bearish positioning.
No guaranteed squeeze or proof of manipulation. But potentially explosive sensitivity to improving expectations.
⸻
NOW CONNECT THE DOTS.
What if AI volatility drives capital into long-duration Treasuries?
What if lower yields eventually reduce mortgage costs, improve affordability and revive housing transactions?
What if OPEN keeps improving while its stock remains deeply depressed?
I’M NOT BETTING AGAINST AI. I’M QUESTIONING HOW MARKETS PRICE CAPITAL ROTATIONS.
The dot-com era proved technological revolutions can coexist with real estate outperformance. I’m not predicting another dot-com crash.
Inflation, mortgage spreads, inventory exposure, cash burn and dilution remain real risks.
Yet the simultaneous disconnect between TREASURIES, MORTGAGES, REAL ESTATE, OPERATIONS, STOCK PRICE AND SHORT INTEREST is impossible for me to ignore.
WHAT IF $OPEN IS PRICING A WORSE FUTURE JUST AS ITS UNDERLYING CONDITIONS BEGIN TO IMPROVE?
I don’t know when a reversal comes.
THE MARKET IS PRICING FEAR. I’M WATCHING THE DIVERGENCES.
LONG $OPEN — THROUGH THE STORM.
$NVDA: la demanda supera la oferta.
$ASML: la demanda supera la oferta.
$TSMC: la demanda supera la oferta.
$GOOG: la demanda supera la oferta.
$AMZN: la demanda supera la oferta.
$MSFT: la demanda supera la oferta.
$META: la demanda supera la oferta.
🚨 EARNINGS de ASML ~ $ASML
• BPA de 12,95€ ✅
(Esperado de 10,60€)
(+128% YoY 🟢)
• Ingresos de 11,66B€ ✅
(Esperados de 11,56B)
(+50% YoY 🟢)
La cotización SUBE un +3% 🟢
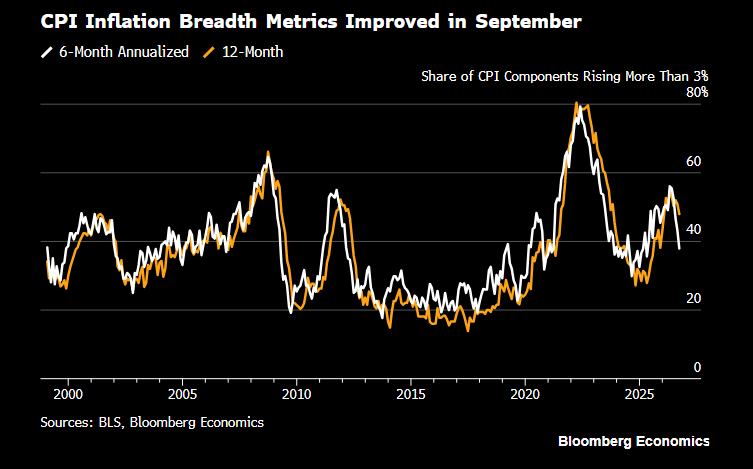
Interesante lo que comenta Anna. El índice de difusión del CPI: que mide la cantidad % de componentes que incrementan 3% o más se ha reducido. Casi todo es energia aunque este mes hay algunas cosas que no gustan tanto. shelter ha vuelto a acelerar al 0,4% mensual y vehículos usados y servicios de transportes también un poco..
This is the diffusion of CPI inflation, measured similarly to Kevin Warsh's preferred PCE inflation diffusion metric.
It's down.
our full reaction @TheTerminal https://t.co/WGPEXDyOy6
Creo que olvidamos que los números de $OPEN son en el peor mercado de vivienda en MUCHOS años. Aún así están transformando la empresa y convirtiéndose en rentables.
Creo que es necesario un poco de perspectiva.
Seguid así @nejatian@morganb@fahdananta
The richest tenth of America does 28% of the spending. Or 21%. Two government surveys, same country.
A Fed note out October 9 added up new spending questions in the 2025 Survey of Consumer Finances: "aggregate spending in the 2025 SCF was $6.58 trillion," against $7.02 trillion in the Consumer Expenditure Survey for 2024. The totals nearly agree. The shares don't.
Top income decile: 28% in the SCF, and in the CE "the highest decile accounts for a still-high 21 percent of spending."
Footnote 9 has part of why. The SCF hunts for rich households on purpose, and without that oversample its total drops to $6.1 trillion. About 7% of measured spending is only visible if you go looking for it.
Their data, they write, are "only in part consistent with a K-shaped recovery": the top isn't pulling away, the bottom is sliding, the gap widens from below.