Pues es la noticia del día. Google se ha puesto más duro con los scrapers de sus páginas de resultados, y hay muchos que ahora mismo no están funcionando.
No sólo suites y herramientas de trackeo, también APIs (entre ellas la que usamos para nuestra herramienta interna).
Tenemos noticias para vosotros.
Hemos decidido decir adiós y no continuar haciendo nuevos capítulos en @3cisnesnegros. El podcast continuará abierto y la cuenta en 𝕏 también.
#UltimoHilo
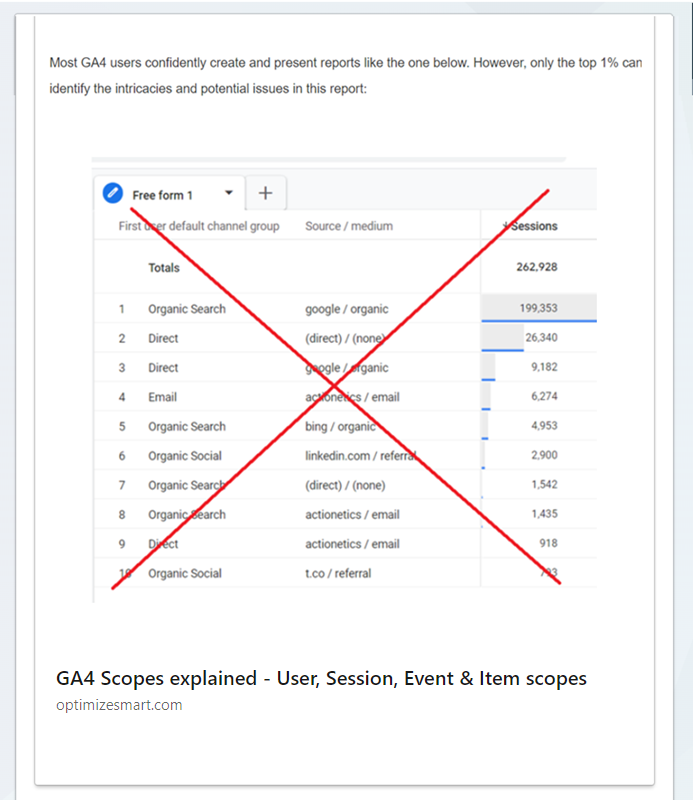
This article on #GA4 scopes completely dwarfs the official documentation on GA4 scopes. It contains everything I know and understands about scoping in GA4. Understanding scopes is critical for accurate reporting and analysis.
https://t.co/w0P7l6jygY
New video: Trigger with Click element does not work
Even though GTM preview mode displays the "Click element" as a string, it isn't. This adds more confusion, and sometimes people complain that their click triggers don't work.
https://t.co/45w4FeCLRX
Whoop, whoop! New case study on the new and improved BEAST Analytics site!
A lot more to come, but super stoked to have this post out FINALLY 🤘
https://t.co/XpFxQ5IjWo
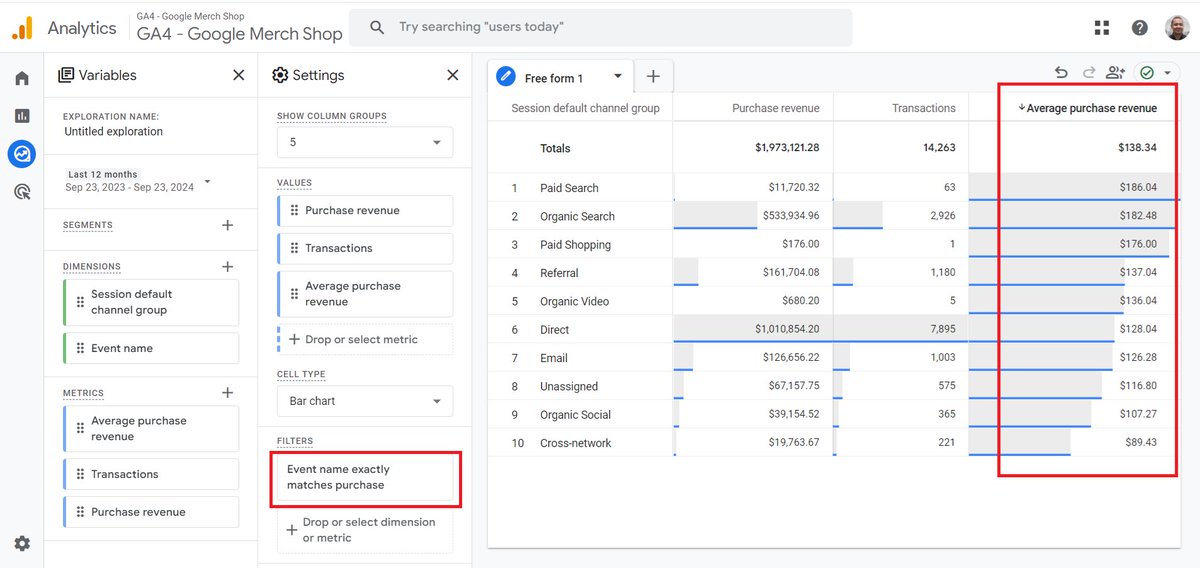
👉 The correct method to calculate 'Average Order Value' in #GA4
In GA4, the 'Average Order Value' metric is called 'Average purchase revenue'.
It is calculated as 'Purchase Revenue' / 'Transactions'.
'Average purchase revenue' is the average value of an e-commerce transaction.
Since in GA4, a refund is also considered a transaction, it can impact the 'average purchase revenue' metric.
So, when you create the exploration report, make sure to apply the following dimension filter so that only the 'purchase' event is taken into account when calculating the 'transactions' and 'average purchase revenue' metrics.
Event name exactly matches purchase.
El equipazo de @Laikateam_ me invitó a su nave donde @mjcachon y yo estuvimos charlando y haciendo algunas reflexiones que quizás os interesen. Gracias a todo el equipo por hacerme sentir como en casa 🚀
Interesante. Se ha filtrado un documento de 36 páginas donde Mr Beast explica a sus nuevos empleados cosas clave sobre el negocio, entre ellas todo lo que tienen en cuenta para conseguir que un vídeo sea viral.
Simon Willinson hace aquí un buen resumen:
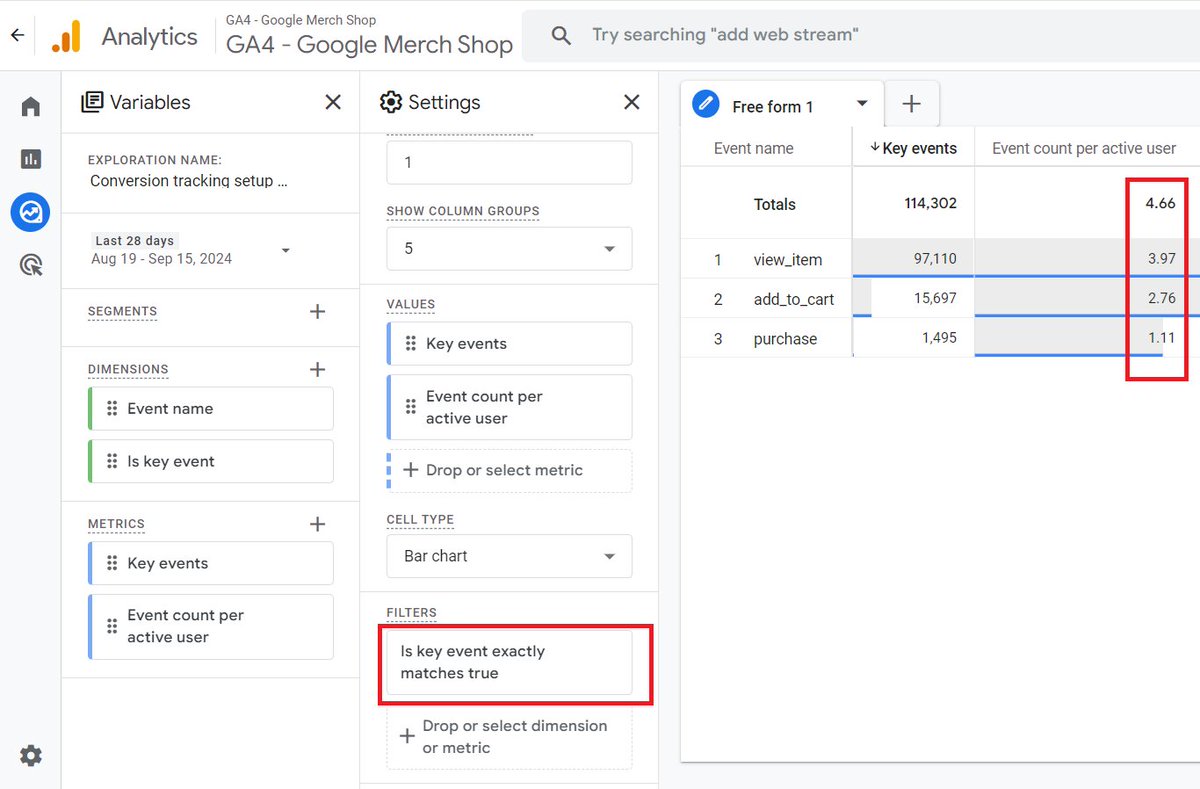
👉 Here is a quick and easy way to check for duplicate conversion events (aka key events) in your #GA4 property.💡
Create a new exploration report in GA4, as shown in the screenshot below.
Dimensions: Event Name, Is key event
Metrics: Key events, Event count per active user
Dimension Filter: Is key event exactly matches true
.
.
Ideally, the 'event count per user' for a key event should be one or close to one.
If the 'event count per user' for a key event is two or higher, it is most likely a duplicate conversion count, and you need to find and fix duplicate events.
.
.
There could be some edge cases like you are tracking 'purchase' as a key event where an event count per user of two or greater is acceptable.
But for most key events, the event count per user should be less than two, ideally one.
.
.
So, if you track 'ebook download' as a key event, ideally, the event count per user for this conversion should be 1.
Most users have set up conversion tracking in their GA4 properties all wrong because they follow Google's advice.
Google recommends the 'once per event' counting method, but you should use the 'once per session' method to avoid inflating the conversion count for non-transactional conversions.
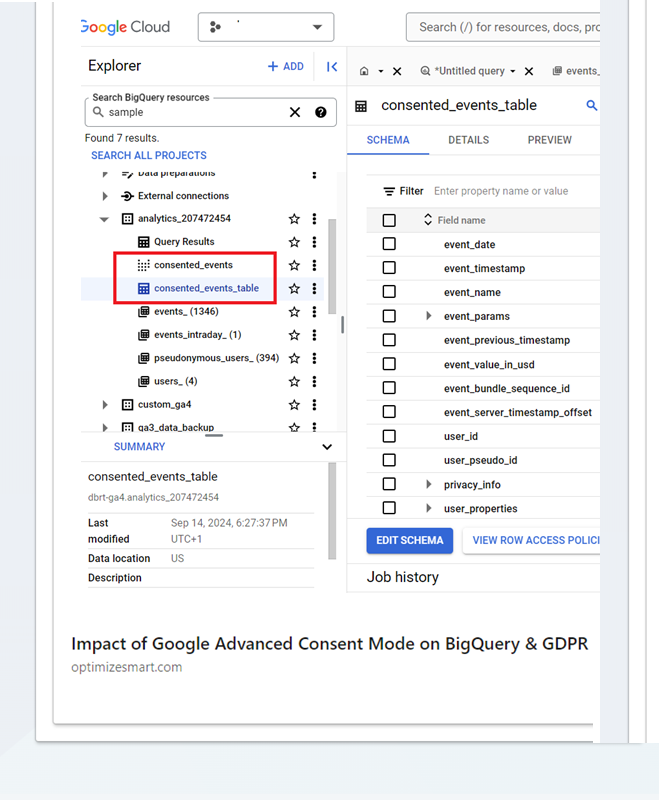
💡 The new way to look at #GA4 BigQuery data.
Consented events: (privacy_info.analytics_storage = 'yes' OR privacy_info.ads_storage = 'yes')
Unconsented events:
privacy_info.analytics_storage IS NULL OR privacy_info.analytics_storage = 'no'
AND
privacy_info.ads_storage IS NULL OR privacy_info.ads_storage = 'no'
https://t.co/IhYuCaifVR
🚨 When you use Google Advanced Consent Mode, the data discrepancy between #GA4 and GA4 BigQuery export increases considerably, and you start collecting junk data in BigQuery. 🚨
When Advanced Consent Mode is implemented, there is a notable difference between what you see in your GA4 reports and what is available in your BigQuery export data tables.
For example, you could see far more conversions and purchase events in BigQuery.
.
.
This happens because, by default, the GA4 BigQuery export does not fully honour the Google Advanced Consent Mode and continues to import event data (some but not all) from your GA4 property even if users decline consent.
BigQuery export can include events without personal identifiers (such as cookies, device IDs, user IDs, client IDs, advertising IDs, etc), data related to anonymized sessions, etc.
All of this data is pretty much useless to analyze.
There might be a few cases where some high-level or aggregated insights can be squeezed out.
But by and large, it is junk data whether you like it or not.
.
.
For example,
1) Without personal identifiers, tracking individual user journeys or behaviors across sessions is almost impossible.
2) Without identifying users, you can't reliably attribute conversions, purchases, or events to specific campaigns, ads, or referral sources.
.
.
3) Without consistent identifiers for unconsented users, the data becomes fragmented and unreliable at the user level. You lose the ability to track users across different devices and platforms. Each session or even each event might appear as a unique user, severely distorting user-based metrics.
4) Without identifiers, it isn't easy to deduplicate events, leading to potential over-reporting of user actions, making the data less reliable.
.
.
When the data is not reliable either at the user or the session level, it is pretty much junk data.
So what can you do?
If you use Google Advanced Consent Mode, consent signals are often included in the BigQuery export.
You can use 'privacy_info.analytics_storage' and 'privacy_info.ads_storage' fields to filter out events based on user consent for analytics and ads tracking.
You can use these signals to filter out data from users who haven't provided consent, which is likely the source of anonymized or incomplete data.
Since the junk data you see likely comes from sessions or events without user identifiers, you can filter out rows that lack these identifiers.
You can create custom views or tables in BigQuery that exclude unconsented data by default.
This way, you always work with consented data in your analysis.
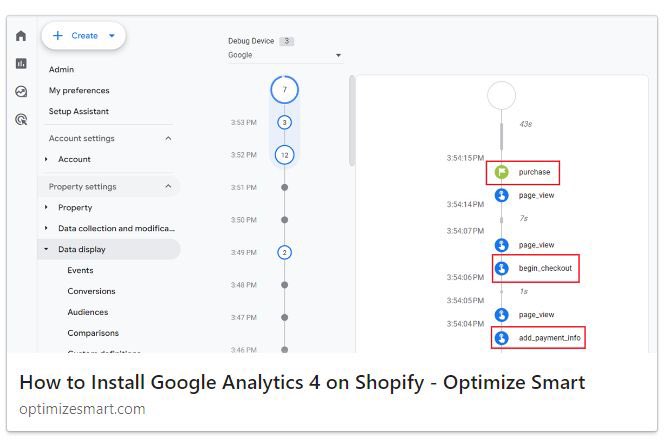
Here is how you can correctly install #GA4 on Shopify.
Hint: Even Shopify’s documentation does not tell you the correct GA4 installation.
https://t.co/ugtzxAugbj
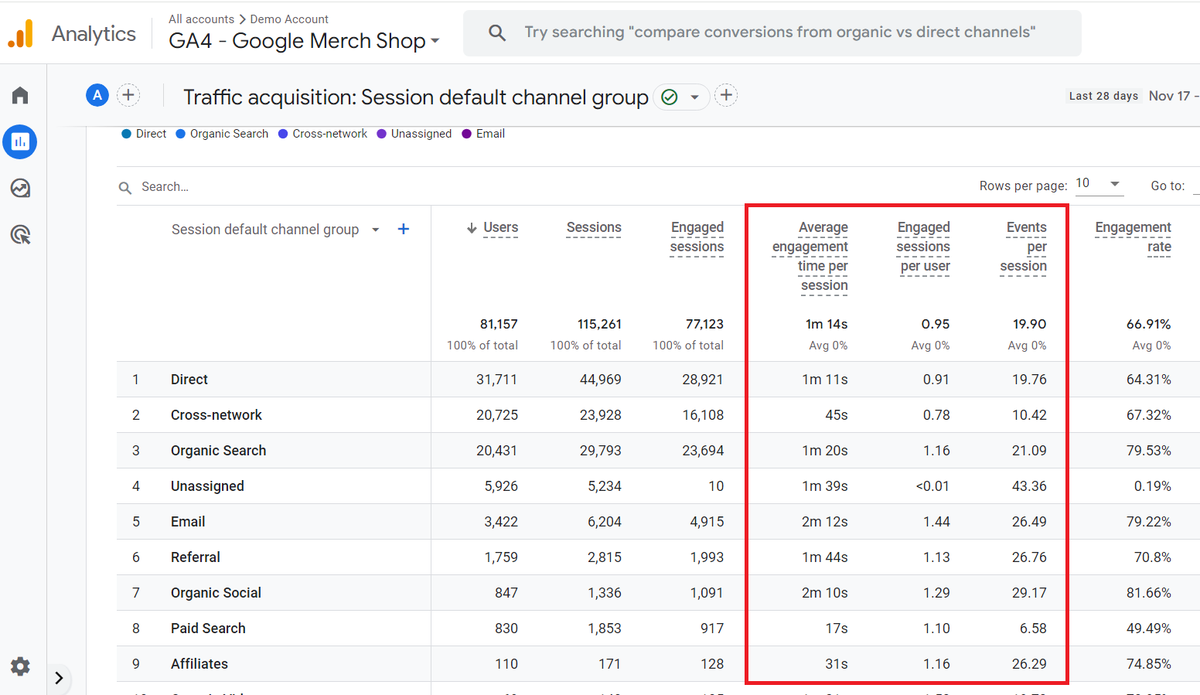
💡 The correct methods to analyze and report average metrics in #GA4
Nobody wants to be average, and yet we all love averages. That is why our analytics reports are all jam-packed with averages.
We have 'average engagement time', 'engaged sessions per user', 'events per session', 'engagement rate'... and the list of average metrics goes on and on.
To analyze and report above average, we first need to stop being obsessed about all the average metrics and take the insight they provide with a huge grain of salt.
.
.
Any set of measurements has two important properties:
1) The central value
2) The spread about that value.
We calculate the central value to determine a typical value in a data set.
We measure the spread to determine how similar or varied the observed values are in a data set.
.
.
If the set of observed values is similar, then the average (or mean) can be a good representative of all the values in the data set.
If the set of observed values varies by a large degree, then the average (or mean) does not represent all the values in the data set.
We calculate the central value through Mean, Median and Mode.
We measure the spread of data values through Range, Interquartile Range (IQR), Variance and Standard Deviation.
.
.
Outliers impact mean and mode.
Outliers are extreme values that are significantly different from the majority of data points in a set.
They can significantly impact the mean and mode, two measures of central tendency commonly used to summarize data.
.
.
The mean is sensitive to outliers because it involves the sum of all values.
An extremely high or low outlier can skew the mean, making it a less reliable measure of central tendency in these cases.
The mode is the value that appears most frequently and is not affected by the magnitude of the numbers.
.
.
Therefore, outliers do not impact the mode unless the outlier itself is the most frequent number or it creates a new set of frequent numbers.
In summary, while the mean is sensitive to outliers and can be significantly altered by their presence, the mode remains unaffected unless the outlier changes the frequency distribution of the data set.
Calculating the median of every data set all day long can be very time-consuming and not practical for many. This is particularly true for large datasets.
So what is the solution?
.
.
The solution is to first measure the spread of data values in a data set and then decide whether to trust the average value reported by your analytics tool, like GA4.
.
.
There are two ways of measuring the spread:
1. You look at the distribution of values in a data set and find and eliminate outliers (or extreme values).
2. You calculate spread through IQR, variance or standard deviation.
Visualize the data using looker studio and show data distribution instead of relying on the average metric.
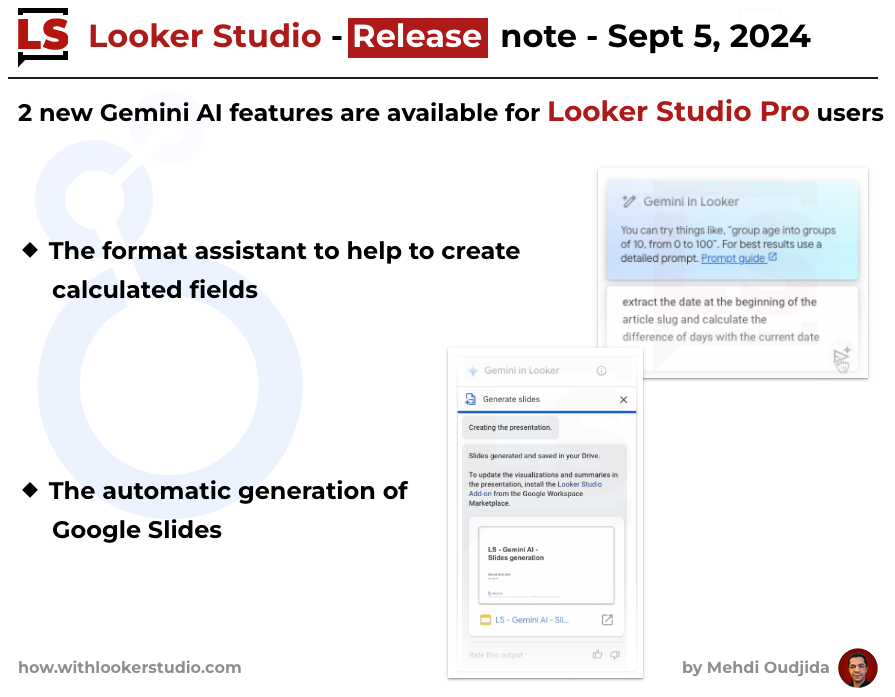
#LookerStudio New Release - September 5,2024
2 Gemini AI features are now available in
Looker Studio Pro
➡️ The format assistant to create calculated fields
➡️ The generation of Google Slides
Here my feedback during my preview tests
https://t.co/BTDpRwvDdF
K, guys, c'mon. Restoring my attribution on the Portent blog but nofollowing back to my site. And NOT restoring attribution to other Portent authors?
This doesn't have to be that hard.
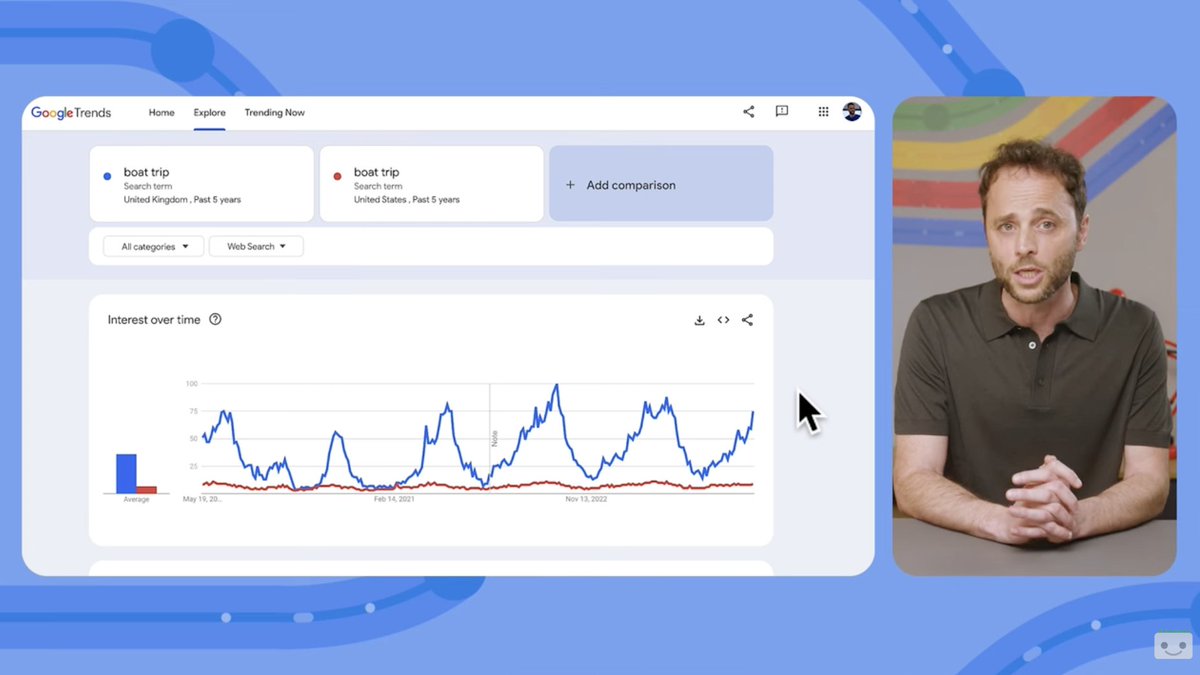
✍️Nuevo tip para @GoogleTrends:
Puedes comparar cómo ha cambiado el interés de una búsqueda estacional durante varios años superponiendo gráficos. Lo mismo en distintos mercados.
Recomendable serie en @googlesearchc con @danielwaisberg y @omriweisman👇
https://t.co/Yb8ZTtVhNe