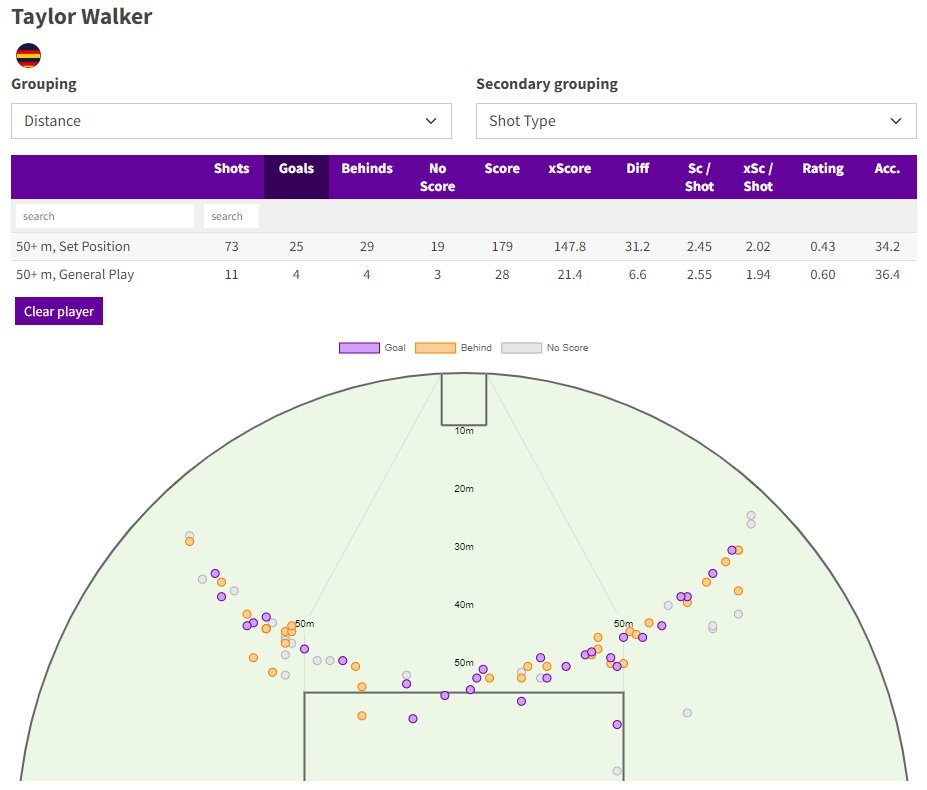
New Expected Scores page now available
🟣Explore goalkicking accuracy and shot rating (2021-)
🟣View by player, team or AFL-wide
🟣View player shot charts
🟣Filter shots by season, shot type, distance and corridor/pocket
https://t.co/UthVLuvPjZ
@EmlynBreese The issue is the difference in definition between the statistical “expectation” which is the average value of a random variable, and the everyday use which tends to imply some level of fate or deserving. I’ve played with things like “shot value”, but fear the ship has sailed.
This week we dove relatively deep into centre clearances, how much they are really worth and how teams move the ball away from the middle.
To do this of course we focused on West Coast.
https://t.co/w123A96cnH
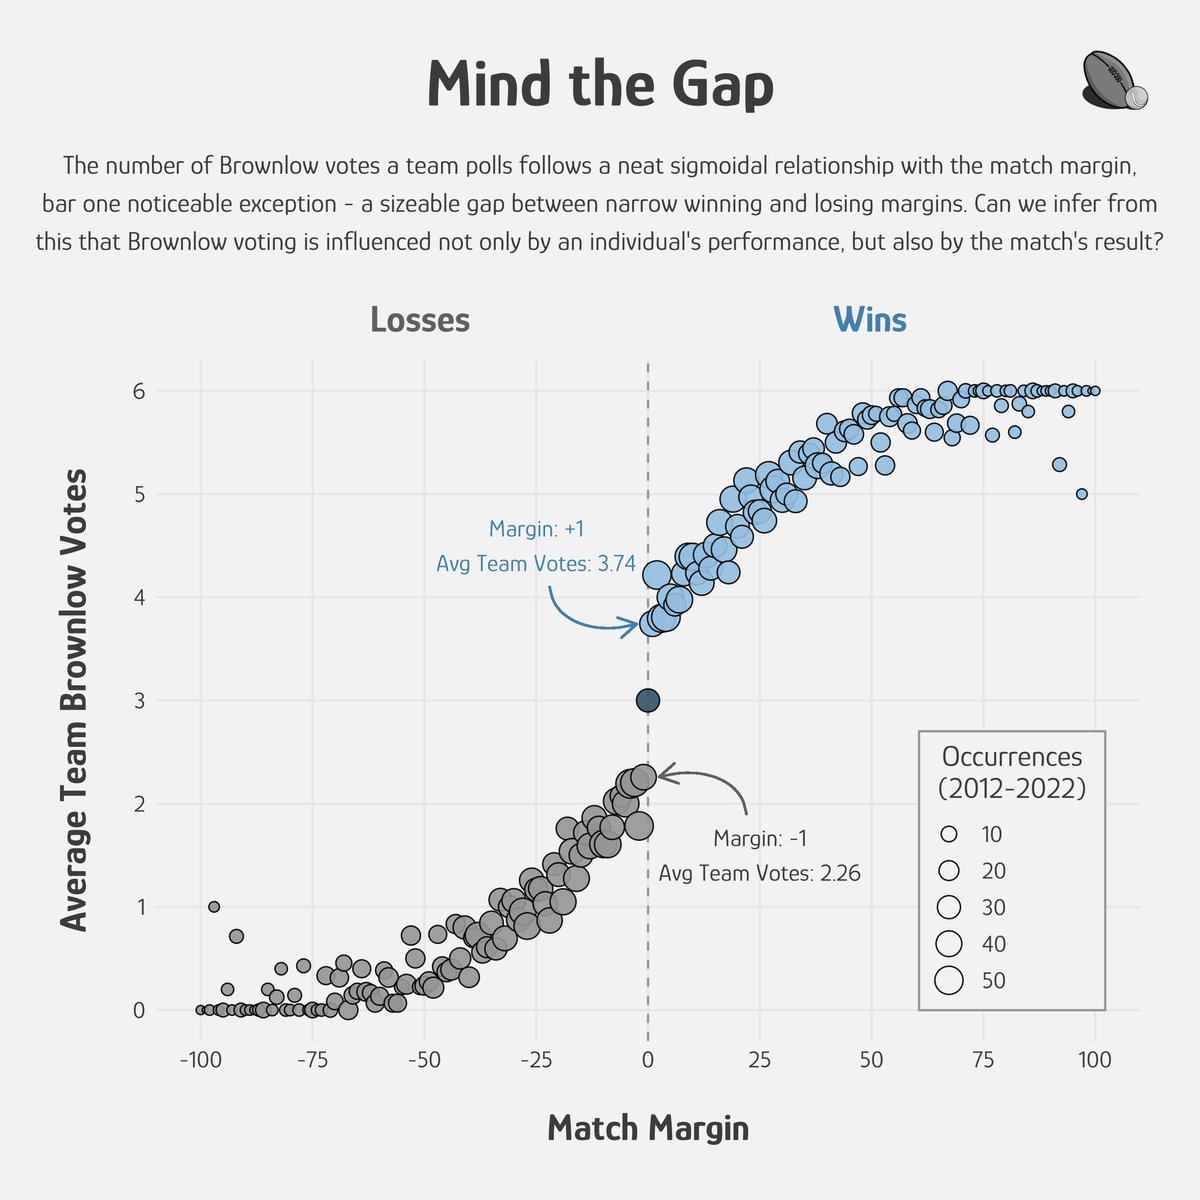
Does the outcome of tight matches play mind games on the umps as to which side they should give the votes to? The size of the gap between a 1pt win and a 1pt loss in the below suggests yes, it does.
Using the margin is an obvious yet critical factor in predicting Brownlow voting.
Full results are in for 50 expert & media pundit preseason ladder predictions. Summary: Over the long term, Squiggle is going quite a lot better than any of them. I will be reposting this link once per day forever. https://t.co/Sfwbr8IFW5
Quite simply the most wide-open battle for finals in #AFL history. The computer found over 230,000 possible permutations of the Final 8.
Expect 5 teams to finish with 54+ and 8 teams to end up on 44-52 points. 48 won't be enough, unless you have both percentage and luck 1/5
Am really pleased to share this paper as my first piece of authored work. Hopefully it can add to commentary surrounding teams' forward line strategy in the AFL. You can check it out at the link below.
#sportsanalytics#sportsdata#sports#analytics#afl
@alittlefitness@BreeseEmlyn How’s this calculated? Derived from event data? I can’t seem to replicate anything that has Melbourne anywhere near this low. Any particular games that stand out?
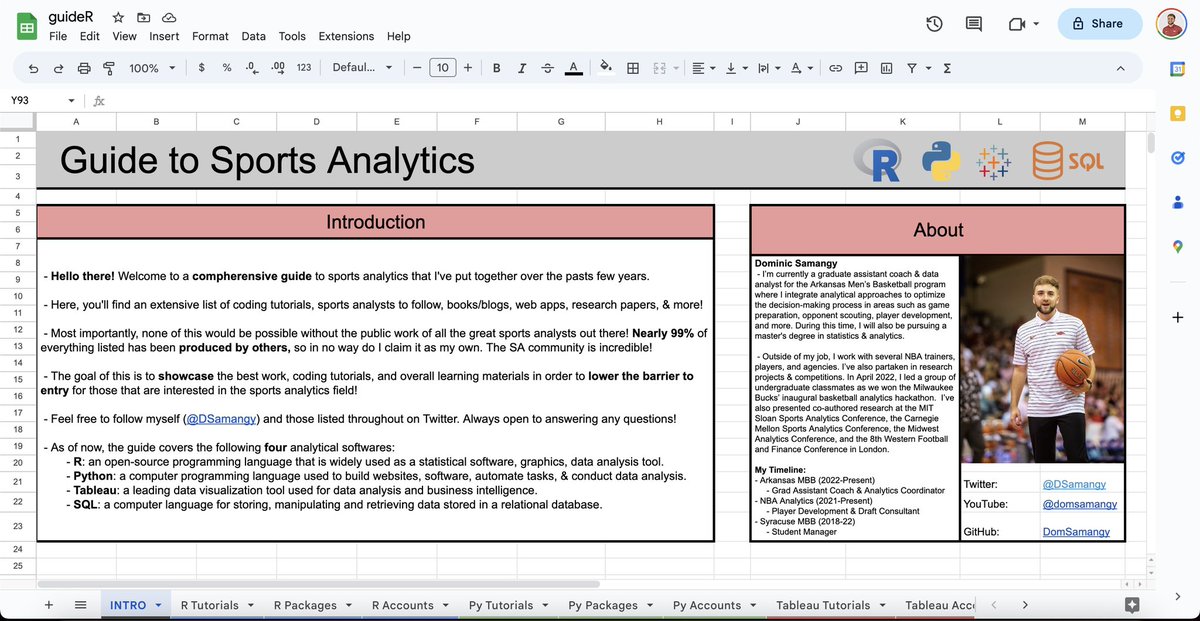
🚨 Guide to Sports Analytics 📊
New design & we now cover 4! softwares in-depth (R, Python, Tableau, SQL). In total, links to 500+ tutorials, 250+ data sources, 125+ accounts to follow, 50 books, 40 cheatsheets, 40 papers & more. All in ONE place!! ⬇️
https://t.co/ZeFuzwVPmY
@alittlefitness@crow_data_sci@CapitalCityCody@liammannix A smoothed model is your first step in building an equity based player ratings model ala PR. But you’re improvements for this will definitely be marginal. Love what you’re doing!
Hard to imagine a worse performance (both onfield and off) than that by the aussies. You can write it off as India being good, but England won’t be pushovers by any means.
So it’s pretty clear now that England are the ones to reap the first mover advantage of analytics in short form cricket.
They’re incredibly well drilled, innovate (weakest bowler opening the bowling, fewer yorkers at death etc) and set plans to opposition so well.