🇺🇸 AAII
When the AAII bull-bear spread drops below −20, stocks have tended to rebound. After readings like last week's, the S&P 500 has posted a median gain of 2.8% over the next month and finished higher 68% of the time
👉 https://t.co/blMxcoG7WG
@DeutscheBank#AAII $spx #spx
All this talk of firing Dabo is divorced from financial reality. If Clemson wants accountability, start with Graham Neff, who has overseen years of runaway spending and contractual commitments that were indefensible from the outset.
I was there yesterday. It was awful. But I’ve reviewed Clemson’s financials: FY25 athletics posted a surplus of just $894K. Dabo’s buyout is $57M. Clemson already carries $245M in athletics bonds, and Moody’s has flagged weak debt coverage and downgrade risk. (A credit downgrade would likely mean higher interest rates on future bond issuances, driving up Clemson’s borrowing costs and compounding an already precarious financial situation.)
Dispatching Dabo without outside funding wouldn’t solve Clemson’s problems. It would compound them. Dabo is a great coach, great person. The numbers aren't there for Clemson. Replacing him would not help Clemson in the least. Let's be real.
The AI selloff is not about demand evaporating. It is about cash flow, financing cost and how long the market is willing to wait for the returns.
Demand signals remain extremely strong.
SK hynix just reported Q3 revenue of 104.6 trillion won (+328% YoY) and operating profit of 83.3 trillion won with an ~80% margin. Management said DRAM and HBM volumes are effectively sold out through 2029, customer HBM requests are roughly double what they can supply, and they expect the supply shortage to persist through 2030. Long-term agreements already cover more than half of 2027–2028 capacity with 14 major customers. That is not a demand problem.
Anthropic’s S-1 shows the unit economics at the model layer improving sharply. Revenue per dollar of compute and infrastructure expense rose from $0.40 in Q1 2025 to $2.08 in Q2 2026 - a 5.2× improvement in five quarters. Compute costs fell from 251% of revenue to 48%. The company generated its first quarterly operating profit. Revenue grew 1,368% YoY while compute expense rose only ~300%. Efficiency is rising, not collapsing.
GPU rental prices have turned higher again. B200 on-demand rates rose more than 20% in a month in some indices; H100 and H200 also firmed. Tightness in the spot and short-term rental market is consistent with the hyperscalers’ own comments that they still cannot meet all the demand they see.
On the supply side the hyperscalers themselves are not signalling a slowdown. Amazon maintained ~$220 billion 2026 cash capex and said it will spend “meaningfully more” in 2027, with Andy Jassy noting that even at these levels demand will still exceed capacity. Alphabet kept its $195–205 billion 2026 range and said 2027 capex will rise significantly. Meta raised the bottom of its range. These are the companies closest to the demand. They are still leaving demand on the table and planning higher spend next year.
What the market is reacting to is the cash flow and financing picture.
In Q3, Amazon, Alphabet and Meta reported negative free cash flow. Theses companies are now funding the gap with a combination of operating cash, new debt and equity issuance. Amazon alone raised substantial long-term debt in the quarter. Combined 2026 capex guidance across the major hyperscalers is now in the $700+ billion range.
This is the classic tension Philip Fisher described in Common Stocks and Uncommon Profits: exceptional companies will temporarily depress free cash flow and reported earnings when they invest heavily in capacity that expands long-term earning power. The market often treats the near-term cash burn as a problem rather than the necessary cost of building the next phase of growth. Fisher’s view was that investors who focus on the long-range profit outlook and are willing to look through the temporary expense should benefit when the results arrive.
The valuation backdrop is also different from prior bubbles. The NASDAQ Composite’s trailing PE is in the high-20s today versus roughly 190× at the March 2000 peak. The multiple then was several times higher. This is not a pure multiple-expansion story running on narratives alone.
The risks are there and they are mostly about financing and timing, not about whether the underlying demand for AI compute exists:
- How long free cash flow stays under pressure and how expensive or available the external capital becomes.
- Whether power, memory and data-centre delivery constraints stretch the payback further than expected.
- Whether core businesses (search, advertising, traditional cloud) slow enough to offset the AI-driven growth in the near term.
Nonetheless the primary evidence from the companies building the capacity (hyperscalers), the companies supplying the critical components (memory) and the companies delivering the models (Anthropic and others) points to demand that continues to exceed available supply. The stocks have sold off because investors are now focused on the cash flow gap and the cost of bridging it, not because the demand data has broken.
That distinction matters for the next 8–12 months. https://t.co/YKr5pL78cE
If there are any Out of Spec viewers that live in the Raleigh, NC or Richmond, VA area our office is right in the middle of those places
Always looking for passionate folks to work for us. We have had a few applicants in the past that may have not been responded to, if that's you - resend your interest - we have a much better sorting process now!
Looking for folks with specialized interest in EV testing, general videography, editing, podcasting, car related news, and whatever else you think would benefit our team.
Email [email protected] and we will (actually) be in touch and keep your info on file for when a position opens up that matches your skills!
$MSFT and $AAPL make up 13.6% of the S&P500 that is really where the funds are hiding within the Mags.
If you throw in $PANW, $CRWD, and $PLTR all of the above account for 15.1% of the S&P500.
If you toss the entire energy sector in which is 3.7% of the S&P500, you get to 18.8%.
What is interesting is that energy is still a very small % of the S&P500. Now, let's throw healthcare in at 9.7%.
You get to 28.5%. This is why S&P is only 3% off its highs while the market feels so bifurcated. % of S&P500 stocks above 50-day below.
🇺🇸 S&P 500
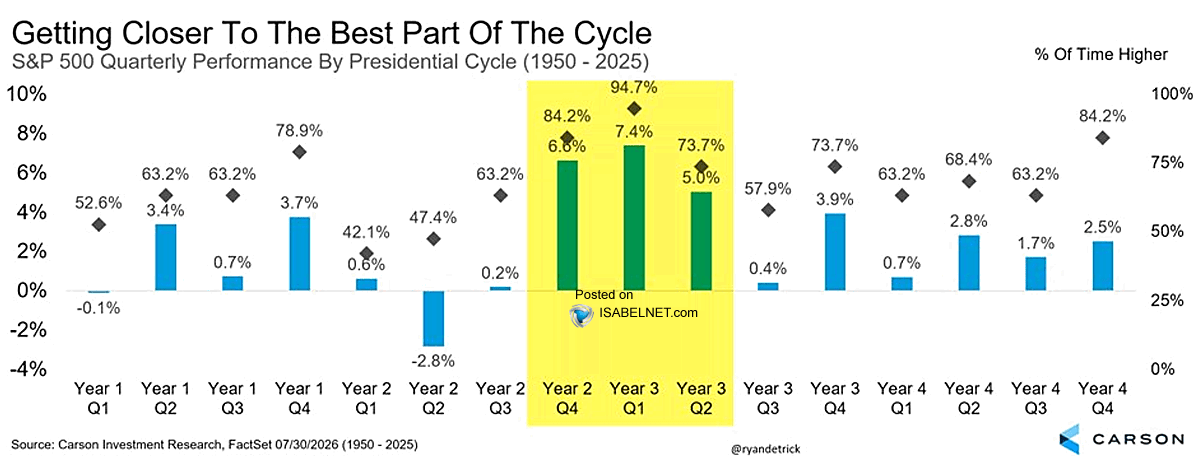
Bulls are still smiling. Historically, the S&P 500 has found its sweet spot from the fourth quarter of a president's second year through the second quarter of the third year, a roughly nine-month window
👉 https://t.co/yIk7SZYp6p
h/t @RyanDetrick $spx #spx
ANTHROPIC HAS JUST FILED IT’S IPO PROSPECTUS
REVENUE WAS UP 1,088% Y/Y LAST YEAR TO $4.59 BILLION
IT LOST $41.97 BILLION LAST YEAR GAAP NET LOSS UP FROM $8.31 BILLION YEAR EARLIER
GAAP OPERATING LOSS WAS $8.06 BILLION UP FROM $2.98 BILLION
COMPUTE AND INFRASTRUCTURE EXPENSE WAS UP 190% TO $7.33 BILLION
58% OF TOTAL OPERATING EXPENSES
ANTHROPIC HAD CASH OF $20.28 BILLION AT YEAR END