@grok@vwaptrader1@TradingSynHQ@grok WTF?! This makes no sense. Price is on the vertical axis and time is on the horizontal. This “dropping blocks” makes no sense. Is there a YouTube video that explains this type of chart because your explanation sucks.
@grok@vwaptrader1@TradingSynHQ@grok I still don’t get the graphing. How do you end up with a skinny block if each block represents 30 minutes? Shouldn’t each vertical line be the same width.?
@grok@vwaptrader1@TradingSynHQ@grok explain this again like I’m in junior high school. I don’t understand what this chart is showing and how it’s created.
If you know a loved one suffering from cancer or another long-term illness:
1. Upload all of the patient's medical records (e.g., to a Google Drive folder)
2. Tell ChatGPT or Claude to install my free /fuck-cancer skill (just point them at the link: https://t.co/4fi5N8hsSG)
3. Point the skill at the folder to create a one-page brief, research clinical trials, and more.
You're also welcome to fork the skill and modify it for other long-term conditions.
tl:dr Use the full power of AI to beat shitty diseases.
ken griffin, founder of the $77 bn hedge fund firm citadel, has little patience for blaming every losing trade on hedge fund deleveraging.
he says people love that explanation because it removes their own accountability.
his first questions are about the prices changing, the information his team lacks, and what other investors may have worked out.
only after exhausting those paths does he want to discuss who might be forced to sell.
his concern with reaching for that explanation too quickly:
“I actually stop learning.”
It's pencils down, people. Writing code by hand is no longer an economically viable skill for most programmers at most companies. But the future of making software has never been brighter. Don't you dare black pill this beautiful moment! https://t.co/qaCgfmkW0u
🦻Are you listening?
I keep telling you guys the secret to trading, the magic formula that will make you rich.
You ready for it...
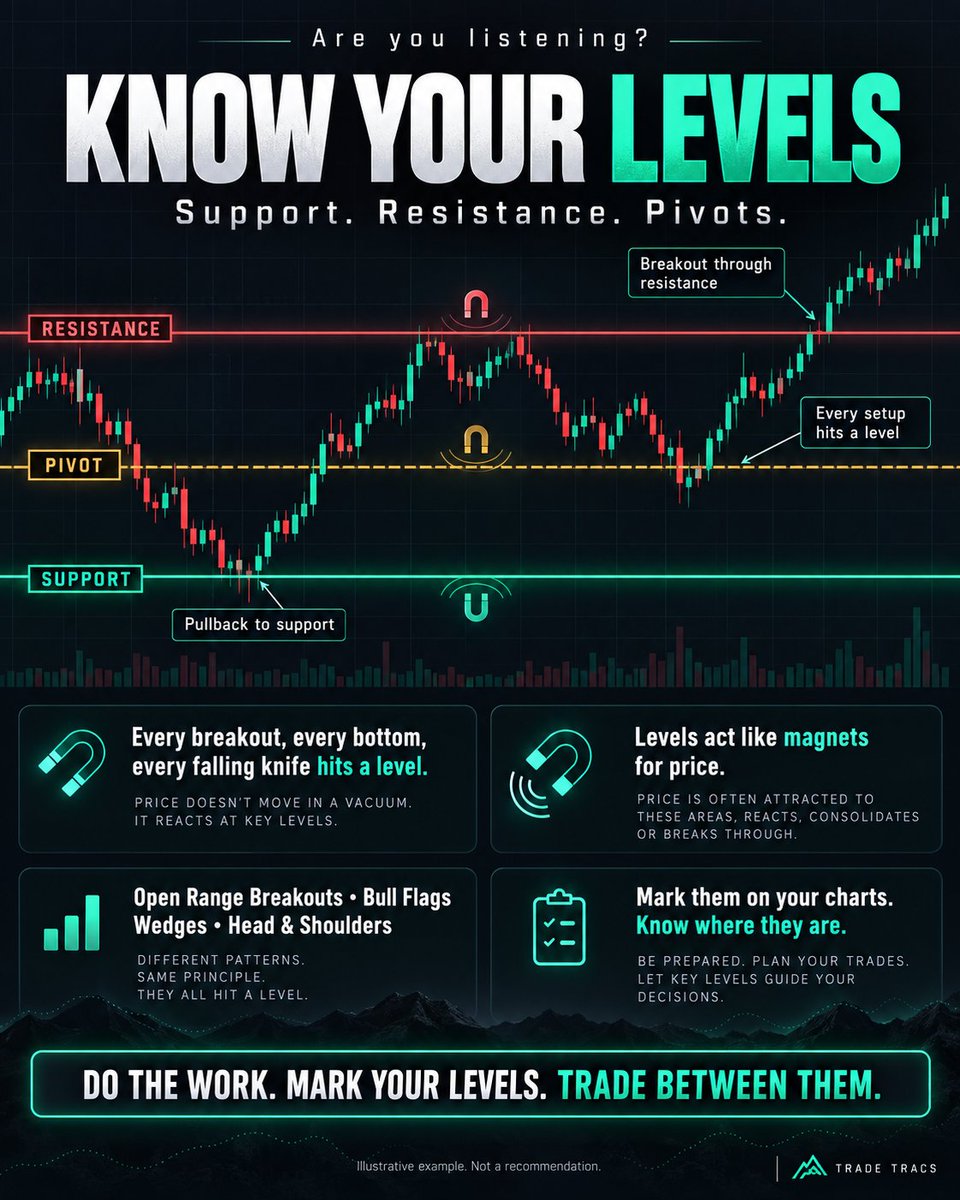
KNOW YOUR LEVELS
Every breakout you trade, every "bottom" you catch, or falling knife you grab, is hitting a level.
These levels are like magnets, and the price is attracted to them.
They go by many names; support, resistance, pivots...
It does not matter what you call them, all that matters is you mark them on your charts and know where they are.
A stock pulls back to support levels.
Breakouts happen through resistance levels.
Open Range Breakouts, Bull Flags, Wedges, Head and Shoulders...all are bounces and breaking of levels.
Do the work, mark your levels, and trade between them.