@ryanhanrahan same reason people vote presidents out of office when there is high unemployment, high inflation. when people are generally unhappy, they oppose anything the president touches.
@ryanhanrahan plus, Nixon himself was unpopular, and during Watergate people generally opposed most of Nixon's policy initiatives.
Technology has changed, daily schedules have changed, schools have changed, people used to let kindergartners walk to the bus stop by themselves in the 70s.
@ryanhanrahan a lot of things are different. when this was implemented there were lots of other things Nixon did for the energy and inflation/unemployment crisis in the early 70s that were deeply unpopular (e.g. wage freezes, lowering national speed limit.)
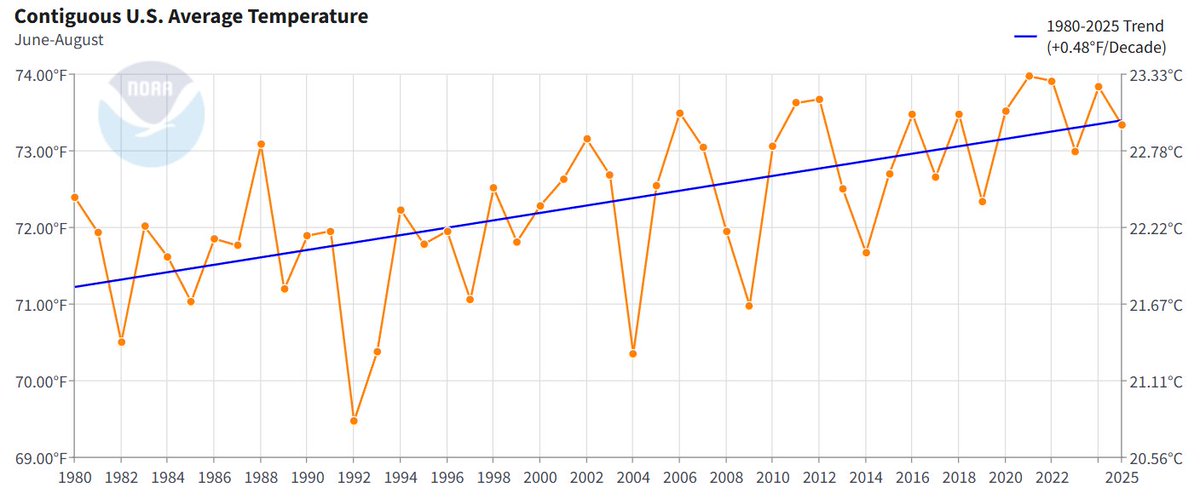
@Chigeorge72@commoditywx ergo, without any meteorological info at all, the baseline assumption should be that this summer would be 1.44 hotter than the 1981-2010 mean based purely on linear trend.
@Chigeorge72@commoditywx It's not 5 years... the climo is between 15 and 45 years old. CONUS summer trend (source NCEI) is 0.48/decade. This means the baseline for this summer is approximately 0.72F hotter than 2010 and 2.16F hotter than 1980.
@Chigeorge72@commoditywx Again though, these orange maps are not saying we are going to have a hot summer by 2020s standards. They are saying that this summer will be hotter than those 20-40 years ago. This, of course, is a no brainer and not very useful information.