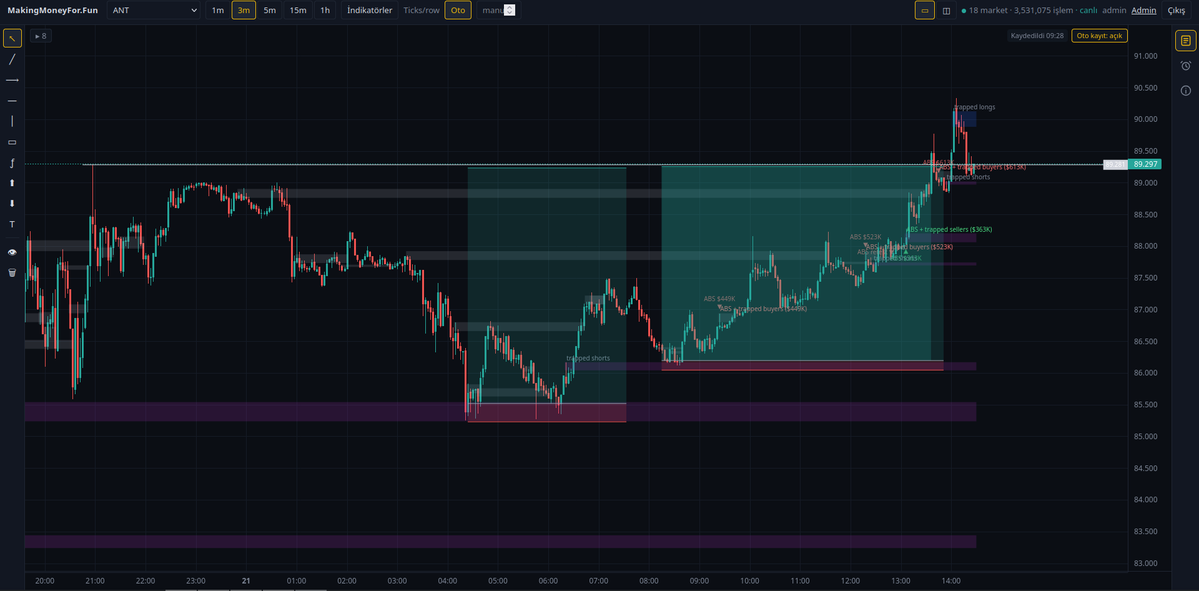
Zirve seviyeler yeniden görülecek mi? Jensen kısırlaştırılacak mı? Yıl sonu rallisi gelecek mi? Ben ai hisselerinde değildim benim ne suçum var?
Aklınızdaki tüm sorulara ve daha fazlasına cevap vereceğim yazı ile karşınızdayım
Çayınızı kahvenizi alın gelin uzun bir yazı olacak. En son bu uzunlukta bir yazıyı lise2 de ergen kız arkadışıma olan aşk ilanımda yazmıştım.(reddetti) Başlıyorum.
"The ones who endure the storm are the ones who witness the sunrise." -V for Vendetta
Önce pztesi için endişeli olanları, yarın ne olacağını bilsem bana yeter o kadar yazıyı okuyacak olsam seni mi takip ederdim a diyenleri aradan çıkaralım. Kulağınıza küpe olması için bir söz iliştiriyorum “Markets never bottom on a Friday”
Elimde 100 dolar olsa ve sadece; piyasa cumaları mı yoksa pazartesileri mi dip yapar bahsine bet ediyor olsam haklarımın tamamını pztesi için kullanırdım. Yine de cuma günü alım yaptım. Zamanlama konusunda çok iyi değilim biliyorsunuz :)
Şimdi, mart 2025 veya mart 2026 daki gibi v şeklinde bir yükseliş gelir mi? Şuan ki piyasa yapısı, Mart 2026 sonundakine benzese de önemli bir fark var: Nisan mayıs döneminde yoğun put pozisyonları, volatilitenin gerilemesiyle market makerların hedge amaçlı futures alımlarını tetikleyerek yukarı yönlü bir squeeze yaratmıştı. Ama bugün endeksin kritik 7.200 seviyesinin altına sarkmasıyla bu mekanizma baya zayıfladı çünkü atm putlarda iv düşse bile delta anlamlı ölçüde değişmiyor ve dolayısıyla hedge buyback oluşmuyor. Daha da mokoko bi durum 6.900 seviyesinin altında ortaya çıkabilir ki: otm putların itm hale gelmesi ve volatilitenin de düşmesi, market makerları daha fazla futures satmaya zorlayarak 2022 benzeri bir spot down, vol down feedback loop yaratabilir. Mart 2025’teki güçlü toparlanmanın arkasında ise JP Morgan collar pozisyonlarının roll edilmesi, market makerlara yeniden Vega ve vanna exposure kazandırılması, sistematik fonların oversold konumdan dönmesi ve 60/40 rebalancing gibi katalizörler vardı. Bugün aynı desteğin bulunmaması, toparlanmayı yeni Vega satıcılarının ortaya çıkmasına ve market makerların short Vega pozisyonlarını azaltmasına bağlı. Ama yükselen VIX ve sertleşen realized volatility bu süreci zorlaştırıyor. Öyleyse her şey bitti mi? Henüz değil. Spx tarafındaki yaklaşık 30 bin kontratlık 7.250 put pozisyonunun tasfiye edilmesi veya piyasaya geri satılması, market makerların short Vega riskinin yaklaşık yarısını ortadan kaldırabilir. Böyle bir senaryoda vix de hızlı bir çöküş, Vanna kaynaklı hedge alımları ve mevcut negatif gamma yapısının birleşmesiyle güçlü bir yukarı yönlü domino etkisi oluşabilir. Bu ortamda kendinizi 7500 de bulup ne olduğunu bile anlamayabilirsiniz.
Soru 2: santa gelecek mi? Bildiğiniz üzere yıl sonuna doğru ralli bekliyordum..bu hala geçerli mi? Belki burada beni yeni takip etmeye başlayanlar için Little bit of background vermek faydalı olabilir. Çünkü gelen bazı mesajlardan anladığım; millet beni zirveden ai hisseleri almışım da terste kalmışım ve yükseliş gelmesini o yüzden bekliyorum sanıyor gibi hissettim (bruhhhhhhhhh)
Ai hisselerinde hiç long olmadım. Mayıs ortalarında ai hisselerinde short poz başlattım ve her yükselişte pozları arttırdım. Oyun planımın ekim kasıma kadar düşüş sonra yıl sonuna doğru sert yükseliş ve 2027 nin bir anında big shorttu. Ve bu oyun planı içerisinde hareket ediyorum yaklaşık 7 aydır. 3 kasımda, kasımın ikinci yarısı için boğa olacağımı söyledim. 5 kasımda tüm short ve put pozlarımı kapattım.(Remember, remember the fifth of November.) 10 kasımda ufak bir feyk yükseliş gelince 'Ben içeri girmeden yükselişin başlayacağını düşünenlere' başlıklı paylaşım yaptım o ara bi kaç kişi senin yüzünden yükselişi kaçırdık falan diye yazınca kalbim baya kırılmıştı. neyse 16 kasımda vakit geldi ramiz dayılı tweet attım ve alımlara başladım.. tüm bu süreç ve yazdığım her şey hesabımda duruyor kendiniz de kronolojik olarak gidip bakabilirsiniz
Şimdi gelelim bu yıl sonu yükseliş hikayesine. Bi kere neden yıl sonuna doğru genelde piyasalar bi coşar önce buna bi cevap verelim? İki sebeple. Fon yönettiğinizi düşünün. Yıl sonuna doğru yönetim ücreti dışında o yıl boyunca hayalini kurduğunuz (daha çok karınızın kurduğu) yeni araba ve yeni tatil için hedeflediğiniz bir incentive fee var almanız gereken. Sizin gibi 4k tane daha fon yöneticisi ve karılarını da sayarsak 8k insan doğrudan yılı yukarıda kapatmak için adam vurmaya hazır bekliyor. Diğer taraftan ips de belirlediği şartları karşılamayı başaramamış mutsuz ve sinirli fon yöneticileri ve karılarını da hesaba katmak lazım. Bunların yapacağı şey Claude ı açıp en çok yükselen 10 hisseyi listelemelerini istemek olacak. Sonra da yarınlar yokmuş gibi bu trendy hisseleri almak için sıraya gireceklerdi. Catch up trade deniyor buna. Az kalan sürede başarılı rakiplerine yetişebilmelerinin tek yolu Hot hisselere yönelmek çünkü. Neyse uzatmayayım. Anladınız ne demek istediğimi. Yılı yukarıda kapatmak tüm tarafların yararına(ydı). Şimdi geldiğimiz noktaya bakıcak olursak kimsenin ne kutlayacak bir performansı ne de kristalize edecek anlamlı bir getirisi kaldı ortada. İkinci olarak yatırımcıların capital gains tax yükümlülüğünü ertelemek amacıyla yılın en iyi performans gösteren hisselerinde satıştan kaçınması beklenebilrdi (ki ortada satıcılar olmayınca piyasa yükselmeyip ne yapacak) Ama takdir edersiniz ki onların tamamı da gooooone olduğuna göre vergi avantajı da anlamını yitirmiş durumda. Santa her şeye rağmen gelebilir ama onun da işi Allah’a kaldı anlayacağınız. Gelecek yükselişin(gelecekse) geçmiş yıllardaki santa ralli mekanizmalarından ayrı bir dinamikte olacağı kesin
Yorucu ve volatil bir haftaydı biliyorum. Dümdüz aşağı yönlü oynayanlar dışında bu günlerde bırakın yumurtaları farklı sepetlere koymayı, her yumurtayı alüminyum folyoya sarıp, ayrı konteynerlerle farklı kıtalar gönderseniz bile korunamayacaktınız zaten. Dayak yemekle daha az yemek arasında ince bir çizgi var. Zaten çoğumuz dayak arsızı olduğumuz için o farkı da anlayamazdık zaten eheheh. İnanın seçtiğiniz hisseler %10 daha çok düştü diye hayıflanmaya gerek yok. %5 düşseydi de benzer duygular içinde olacaktınız. Bu arada neden volatilite artıyor yeri gelmişken bu konuyu da araya sıkıştırayım. bi kaç ay önce de sert hareketler ve sert gündemlerimiz oldu ancak vix in neden bir türlü kopamadığını konuştuk hep. Spx hisselerinde yılın ilk yarısı ort korelasyon %3 civarıydı yıllık ortalamaları %7 falan. Yüksek single stock volatility ye rağmen endeks volatilitesi hep baskı altında kaldı. Normalde endekslerin volatilitesi hisselerin ne kadar hareket ettiği değil, aynı anda ve aynı yönde ne kadar hareket ettiğine bağlı.
Düşük korelasyon dönemlerinde hisseler arasındaki fiyat hareketlerinin birbirini dengelemesini ve diversifikasyon avantajının korunmasını sağlıyor. Daha plain bir dille sizin ai hissleriniz günde %10-20 yaparken dsa ve garibanların sebepsiz yere düşen hisseleri dengeyi sağlıyordu. Edeksleri sakin tutan diversifikasyon avantajı stress anında ortadan kalktı ve vol patladı. Çıkarılacak ders: Piyasada volatility riskini değerlendirirken yalnızca vix e veya tekil hisse volatilitesine bakmak yeterli değil. Korelasyon da başlı başına bir risk faktörü.
Son olarak kimi suçlayalım sorusu var. ırz düşmanı jensen’i mi, onu geri getirmeyen yk üyelerini mi, size bu hisseyi gösteren finfluencerı mı, kaderi veya talihi mi? Böyle günlerde suçu birilerine atmak rahat hissettiriyor. Ben genelde korelasyonu suçluyorum. Yıllardır stres zamanlarında çeşitlendirme tam da en çok ihtiyaç duyulduğu anda koruma kapasitesini kaybedince şöyle ağız dolusu bi küfretmeden geçemiyorum. ciddi bir şekilde suçlu aramak isteyenler varsa kendisinden başlayabilir. Son raddede tuşa basan sizsiniz. Zayıflıklarınızı geliştirme şansınız olmasına rağmen kayıplarınızı başkalarına yükleyerek kolaycılığı seçtiğiniz an suçlu olursunuz. Abi nolursun illa birini suçlamam lazım gece gözüme uyku girmiyor diyenler için ise hafta içinde bir “takip edilmemesi” gereken hesaplar listesi paylaşacağım. Dinleyiciler, okuyucular, seçmenler olarak mikrofonu kime vereceğinizi siz belirliyorsunuz. Bu mikrofonu alıp yükselip yükselip en sonunda o mikrofonu bi yerlerinize sokmaya çalışan insanlara yine bir şans vermek sizin elinizde. Ben öyle yapmazdım. Eski rejimin çocuklarının sizi yeni dönemde de eğitmesine izin vermeyin. S. g. Önce kendini eğit demeyi bilin. Bu dediklerim takip ettiğiniz kobeissi letter, shay bloor, serenity, citrini gibi hesaplar içiin geçerli. Türk fintwitte içerik üreten herkesi seviyorum
@turkishwarsh@aleabitoreddit Cikmayi bilmeyen herkese sapladi amk ben ireni 48den shortlarken biri bull pairi neden shortliyon diye sormustu neden shortlamayayim ki
It's time to say goodbye to Hard Breach DLLs.
Next week, @Vest is introducing Soft Breach DLL, custom set by the user at any drawdown for each account, at no cost.
Hitting your Soft Breach will lock you out of that account for the rest of the trading session, without losing your account
All DLL plans will be removed once user set Soft Breach DLL launches.
Stay tuned for updates on this (and some other new products) over the weekend!
the @krakenfx /cad pairs selloff event (based on real trade and ob data pulled from kraken API):
$btc $eth $usdt $usdc (more pairs were affected, only illustrated my analysis on these 4 however)
this all started at 20:00 utc, and affected even fx pairs on kraken (usd/cad)
selling was dominated by one very large entity/participant. this is determined via consistent sizing and timing of the market sells. the slight offsets to their timing did not obfuscate their flow what so ever.
at the bottom, a single persistent bidder posted deep liquidity on the books, got filled twice, reposted both times. this buyer is the main reason kraken CAD pairs rebounded- the same massive seller flow, the consistent timing and sizing from earlier, actually ran for 2 hours after the buyer started posting. sell flow was absorbed at fair price each clip.
very low latency arbitrage takers also played a heavy role in this. arbs (and this single bidder in ob), lifted price from 29622 to 31823 on btc within seconds.
this was all just what happened on btc. other pairs tell a similar story. here's each event by the pair, with events/behaviors notated.
again, this analysis is based on accurate kraken API tick/trade/ob data. nothing here was assumed, all hard facts w/ the evidence to back it.
important to note: kraken CAD rails limit depositors to $10k a day deposit limit. this likely had a contributing factor.
LLM driven analysis of everything:
# Kraken CAD market, 20-21 Nov 2026
Window: 20 Nov 18:00Z to 21 Nov 12:15Z. Source: Kraken public REST (Trades, OHLC, Depth). No API keys used.
## 1. What happened
Every Kraken Canadian-dollar pair dislocated at once, starting at about 20:00Z on 20 Nov. BTC/CAD printed 24,250.00 CAD at 08:00:43Z. At the time that was roughly 16,900 USD, or about 70% below fair value. ETH/CAD printed 796.27 CAD. USDT/CAD printed 0.0022 CAD.
The trigger was not Bitcoin. Kraken's own USD/CAD pair traded from 1.4280 down to 0.6810, and touched 0.30. That is the Canadian dollar leg of the venue breaking, and it dragged all eleven CAD pairs down together. Pairs that have nothing to do with each other sat within a few points of one another at every checkpoint.
On top of that, one seller ran a scheduled, mechanical clip of Bitcoin into the book for over fourteen hours. The clip is what walked BTC/CAD from roughly 84,000 down to 24,250. The currency break is what made a 10% walk in USD look like a 70% collapse in CAD.
## 2. The tape
| pair | prints | volume | taker sells | market orders | low (CAD) | low at |
|---|---|---|---|---|---|---|
| BTC/CAD | 24,667 | 640.77 BTC | 74% | 30.6% | 24,250.00 | 08:00:43Z |
| ETH/CAD | 5,474 | 1,381.28 ETH | 54% | 11.6% | 796.27 | 08:02:47Z |
| SOL/CAD | 3,925 | 13,099.01 SOL | 65% | 13.4% | 32.00 | 08:16:38Z |
| USDT/CAD | 5,425 | 2,003,930.55 USDT | 66% | 0.6% | 0.0022 | 09:01:08Z |
| USDC/CAD | 17,101 | 9,429,539.11 USDC | 49% | 13.6% | 0.4868 | 08:02:27Z |
BTC and ETH are lopsided (3:1 and 1.2:1 sells vs buys). USDC/CAD is 49% sells across 17,101 prints, which is genuine two-way flow, not a one-way dump.
## 3. The seller: one machine on a clock
Bitcoin's selling was not organic. It arrived in clips of about 20.8333 BTC, all of them at the same second past the hour, 04:34. The run started at 19:04:34Z, before the dislocation, and continued hourly to 03:04:34Z. Each clip is one taker, one side, inside one or two seconds. Twenty clips in that size band total 297.7 BTC, which is 63% of all taker selling in the window.
From 05:30Z the pattern changed to half-size clips of 10.4167 BTC, and they landed at :00:43, :15:43, :30:43 and :45:43. Six of them are 10.4167 exactly, which is exactly half of 20.8333. That is a schedule, not a decision.
| clip lands (UTC) | size (BTC) | prints | price walk | book consumed |
|---|---|---|---|---|
| 20 Nov 19:04:34 | 20.8349 | 199 | 3.9% | 83,274 -> 80,000 |
| 20 Nov 20:04:34 (ignition) | 20.8333 | 202 | 10.3% | 83,596 -> 75,000 |
| 20 Nov 21:04:35 | 20.8338 | 175 | 24.6% | 82,045 -> 61,880 |
| 20 Nov 22:04:34 | 15.8300 | 120 | 25.2% | 77,241 -> 57,775 |
| 20 Nov 23:04:34 | 20.8336 | 249 | 21.9% | 73,003 -> 56,986 |
| 21 Nov 00:04:34 | 21.0695 | 186 | 20.2% | 62,180 -> 49,612 |
| 21 Nov 01:04:34 | 20.8333 | 191 | 15.1% | 72,224 -> 61,340 |
| 21 Nov 02:04:34 | 20.8333 | 211 | 11.2% | 57,698 -> 51,260 |
| 21 Nov 03:04:34 | 20.8333 | 245 | 11.4% | 58,399 -> 51,738 |
| 21 Nov 08:00:43 (the low) | 10.4167 | 104 | 21.8% | 31,000 -> 24,250 |
| 21 Nov 08:30:43 | 10.4167 | 130 | 21.7% | 35,765 -> 28,000 |
Details that mark it as an execution algorithm rather than a panic seller: clip size is constant to four decimals; the arrival second is identical; each clip is priced through the book as market orders, and 183 of the 202 prints in the ignition second are market orders; the walk ends on round numbers, 75,000 then 24,250, which is where resting orders sat. Across the whole window 30.6% of BTC/CAD prints are market orders, against 11.6% on ETH/CAD, 13.4% on SOL/CAD and 13.6% on USDC/CAD. USDT/CAD is the odd one out at 0.6%, almost pure resting-order flow.
The same clip schedule appears on the other pairs. Aggregated at second granularity, 3,720 seconds in the window show two or more CAD pairs printing in the same second, and 1,283 show three or more. The clips were fired across pairs together.
## 4. The buyers and the resting bids
Somebody bought the lows. In the low second itself, 08:00:43Z, 104 prints of 10.4167 BTC all sold into the book and walked it from 31,000 to 24,250. The bid that took the last of it was a resting order, because the fill volume is tiny: 0.0772 BTC at 24,250. The other extreme prints are the same shape, all dust on resting orders: 0.0075 ETH at 796.27, 0.1782 SOL at 32.00, 811.9 USDT at 0.0022, 186.98 USDC at 0.4868.
That matters because it means the bottom was not a withdrawal of liquidity. Someone had orders posted far below the market and got filled. On USDC/CAD, the largest pair by volume, the tape stays two-sided all the way down: 9.43m USDC traded on 17,101 prints with a 49/51 sell/buy split.
The sharp side of the buying is visible on the way back. At 04:06:40Z, with the pairs trading near 1.0-1.2 CAD, resting bids filled at par: 41,712 USDT at 1.4270 and 25,228 USDC at 1.4280, both in the same second, plus 4,995 USDC at 1.4290. Someone was willing to buy dollars at fair CAD value while everyone else was dumping them. At 08:06:04Z a buyer lifted 131.38 SOL at 53.00 on a market trading near 50. At 09:46:50Z a single resting bid at 1,275.00 absorbed about 30.5 ETH of selling across twenty prints, and the price did not move at all.
## 5. Everyone else
- The quoting algorithm on USDC/CAD. Its order sizes repeat exactly: 47.052216 x200, 52.322704 x145, 15.004501 x135, 5.000000 x10⁶. One quoting process kept a two-sided USDC/CAD book open through a 66% dislocation, which is why that pair has the deepest and most balanced tape.
- The absurd liquidity. The live book still holds bids at 0.01 CAD and asks at 642,005,453 CAD (ETH/CAD) and 1,307,831 CAD (USDT/CAD). Those are not real quotes. They are participants parking orders to sit first in a queue or to make a book look deeper than it is.
- The makers who came back. After the event the offer side rebuilt much faster than the bid: BTC/CAD 248 bid levels against 500 ask levels, ETH 99/367, SOL 42/242. Market makers were willing to sell CAD pairs again before they were willing to buy them.
- The CAD leg itself. Kraken's USD/CAD is a thin book, and whoever sold it down to 0.30 set the price of every other CAD pair on the venue. That was the single most important participant action of the night, and it was not in Bitcoin at all.
## 6. Is it a CAD problem or a Bitcoin problem?
Restate every CAD price in USD twice: once at external FX (1.432537 CAD per USD) and once at Kraken's own USD/CAD cross. Against external FX, the median 5-minute bucket is about -0.11% for every pair and 17% of buckets sit below -10%. Against Kraken's own cross, the median residual is 0.00% for BTC, ETH, SOL, USDT and USDC alike. The worst 5-minute buckets are -8% to -13% (USDT -13.2%, SOL -10.6%, BTC -10.1%).
So the dislocation was overwhelmingly the venue's CAD leg being wrong, not the crypto assets being wrong. There is a real asset-level component of up to roughly 10% at the worst moments, and it is not BTC-specific. Anyone reading the tape on BTC/CAD and calling it a Bitcoin crash was reading the wrong leg.
## 7. How to read the charts
Each chart is one CAD pair on 5-minute candles from 20 Nov 18:00Z to 21 Nov 12:40Z, with three panels and a phase strip.
- Price panel, 5-minute candles. Consecutive buckets with no trades are bridged with a thin line so the series reads as continuous price action rather than a gap.
- Dashed grey line: fair value, the same-venue USD pair converted at external FX. The distance between the candles and this line is the size of the dislocation.
- Phase strip across the top: Act I ignition 20:00-21:00, Act II the CAD cross breaks 21:00-04:00, Act III the vacuum 05:30-09:45, Act IV snapback 09:45-11:45.
- Middle panel: 5-minute volume split by taker side, buys above the line, sells below. This is where the 3:1 sell imbalance is visible.
- Bottom panel: one dot per print, positioned at the second inside its 5-minute bucket. Dotted horizontal lines mark the recurring clip seconds such as :04:34. Vertical stripes of dots on those lines are the algorithm firing.
- Orange ruler: one aggressive sweep. Each tick is a price rung that filled, so the length of the ruler is how far through the book the order walked. A long ruler is a thin book.
- Callout boxes name the four or five events that matter, and always carry the print count, the size and the walk.
## 8. What is still true now
- The CAD basis has not fully closed. CAD pairs sit 1.6-2.4% below the same-venue USD pair converted at external FX. The pre-event baseline was -0.1% to -0.6%.
- Kraken's USD/CAD cross is still away from external FX. Until that book is healthy, every CAD pair on the venue is priced off a thin reference.
- The book is ask-heavy. Bids have not rebuilt to the same depth as asks on any of the five pairs.
- The extreme prints are dust. 24,250.00 CAD was 0.0772 BTC, and 0.0022 CAD was 811.9 USDT. Headlines that quote the low as a market price are quoting a single small resting fill.
## 9. Data and method
Trades and order books came from Kraken's unauthenticated public REST endpoints. No credentials were used. The tape was paged with the API's own nanosecond cursor returned verbatim; an earlier version of the pull dropped the tail of every page-boundary second, which is worth knowing if you reproduce this.
The tape is verified against Kraken's own OHLC: 1,226 of 1,227 five-minute buckets reproduce open, high, low, close and print count exactly. The single exception is the last USDC/CAD bucket in the window, whose OHLC was fetched while that bucket was still forming.