Fed days have become a complete free-for-all.
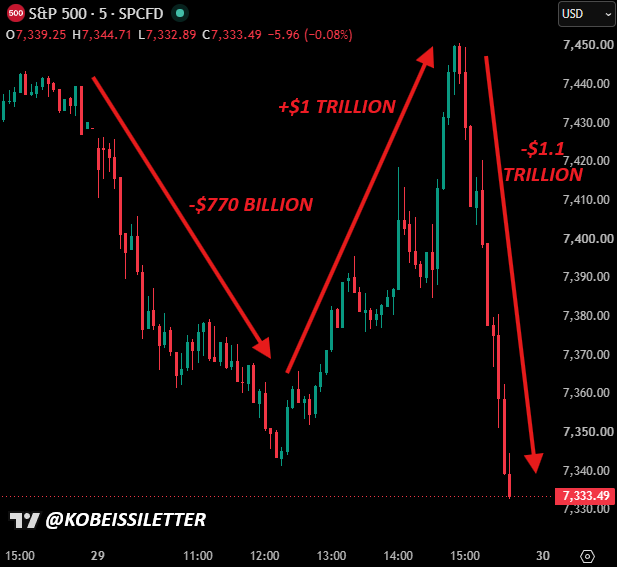
The S&P 500 has now seen THREE swings totaling ~$2.9 TRILLION in market cap during today's session.
Between 9:30 AM ET and 12:15 PM ET, the S&P 500 fell -85 points, losing -$770 billion.
Between 12:15 PM ET and 2:55 PM ET, the S&P 500 rallied +110 points, adding +$1 trillion.
Between 2:55 PM ET and 3:45 PM ET, the S&P 500 fell 120 points, losing -$1.1 trillion.
The era of Fed guidance is over and the market is not liking it.
Absolute insanity:
In just 2 hours, oil prices have now fallen -$10/barrel and risen +$11/barrel, with prices now nearing $90/barrel again.
This is unprecedented volatility.
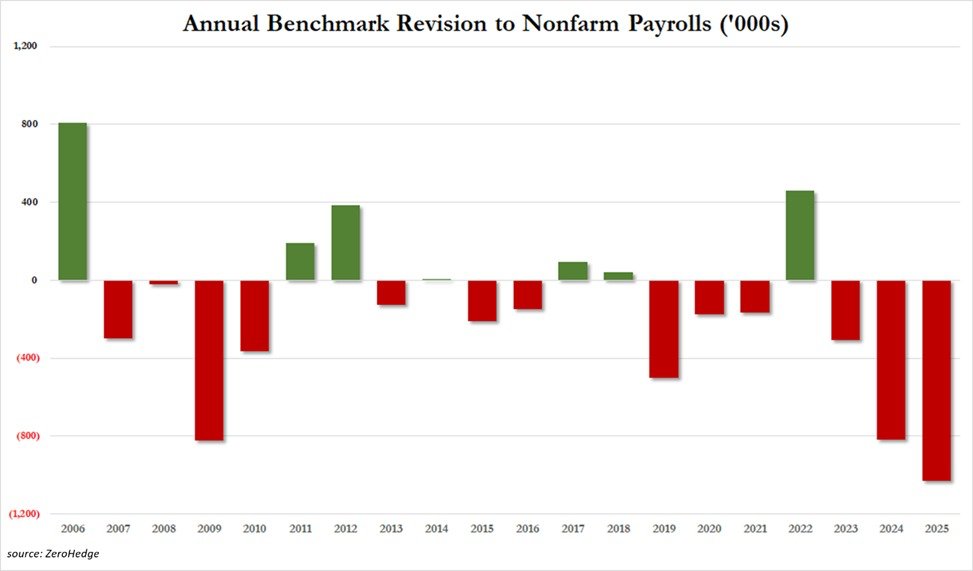
BREAKING: US job numbers were revised down by -1,029,000 jobs in 2025, the largest annual revision in at least 20 years.
This follows downward revisions of -818,000 in 2024 and -306,000 in 2023.
In total, -2,153,000 jobs have been revised out of initially reported data over the last 3 years.
Since 2019, -2,500,000 jobs have been erased from official data, with negative revisions occurring in 6 of the last 7 years.
By comparison, 2009-2010 combined downward revisions were roughly -1,200,000.
What is happening with US labor market data?
Broad commodity rallies can also reflect supply constraints, geopolitics, and inventory cycles not just systemic stress.
Correlation isn’t causation.
Markets have repeated patterns, but no macro setup is destiny especially in a world reshaped by energy shocks, reshoring, and fiscal dominance.
Declines in car and apparel prices—which some forecasters had thought would show early tariff effects in May—led to a cooler-than-anticipated core CPI reading last month
January’s US CPI figures came in hotter than expected across the board, likely extending the length of time that the Fed will now sit on the sidelines.
Full thoughts from Senior Strategist @MrMBrown 👉 https://t.co/vXnBMxcsmz
Euro fx futures ( $6e ) or $EURUSD collapses lower in the biggest intra-day decline since March 2020, as pro-greenback $DXY sentiment ramps up on the back of a Trump election victory, in addition to fears of trade pressures in the Eurozone as the market prices in tariffs.
The Dixie (US Dollar Index) $DXY made its third retest of 1 Hour Demand, and could be preparing to reverse or rotate higher. If this happens, then it will build a case for downside pressure in today's equity markets. (This is on the 15 Minute Chart.) $USD #Forex
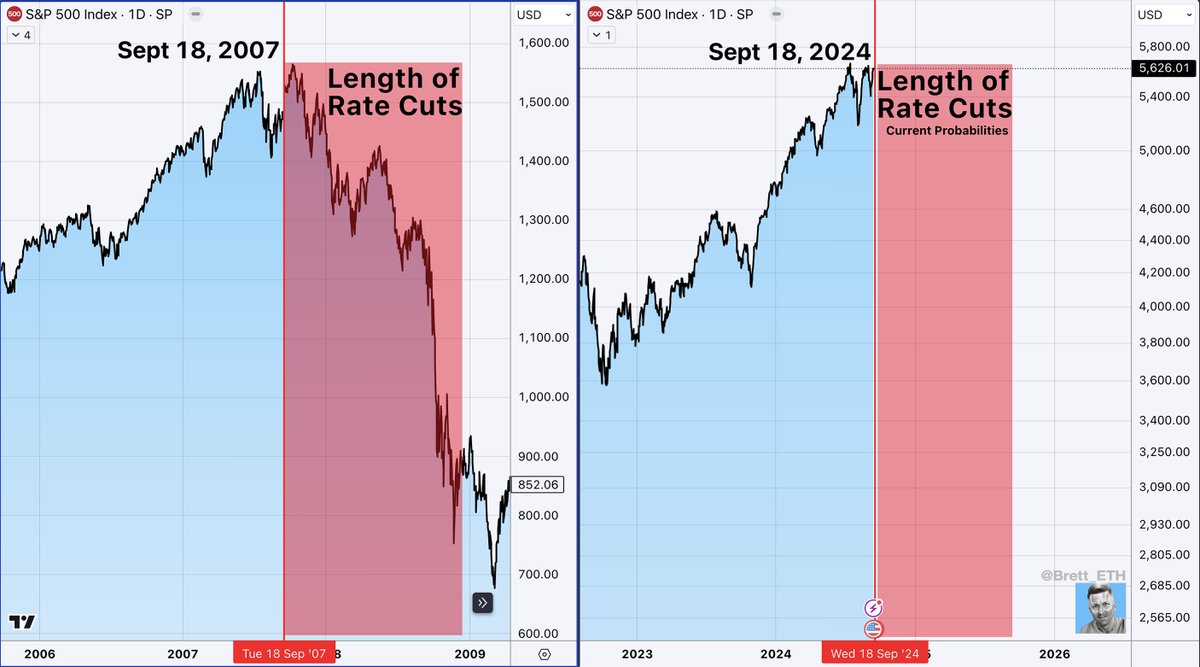
Four days until the #FOMC meeting, where Powell will likely cut by .25 (odds are currently 50% for .25 and 50% for .50).
The similarities between 2007 and 2024 are wild!
Charts in comments:
Fed's First Rate Cut:
Sept 18, 2007
Sept 18, 2024 (high probability)
Unemployment Rate
Sept 2007: 4.7
Sept 2024: 4.2
US Inflation Rate YoY
Sept 2007: 2.5
Sept 2024: 2.5
US Housing Starts:
Sept 2007: 1.238
Sept 2024: 1.235
US Leading Economic Activity
Sept 2007: 100.4
Sept 2024: 100.4
US Existing Home Sales
Sept 2007: 4.5 Million
Sept 2024: 3.95 Million
(This post is not calling for a 2007 crash. I am simply pointing out the intriguing similarities in timing and economic indicators.)
$SPX $QQQ #Recession #Economy
ECB Not Pre-Committing To Any Particular Rate Path
- Inflation Likely To Stay Above Target Well Into Next Year
- Raises Inflation Forecasts For 2024, 2025