Early stages for composite building
This composite is for daily returns data
Higher value = more risk
Takes into account: trend duration + % returns across various timeframes
Much easier to do this by metric category from what im seeing vs lumping all categories together
When the SPX6900 movement goes exponential, don't pretend you haven't been warned every single day for 2 years straight.
The signs are all there in plain sight.
There will be nothing left except for Community.
SPX6900 is Front-running this massive transition.
There is nothing other than SPX6900 positioned to absorb Trillions worth of value of Community Formation.
SPX6900 is the greatest financial opportunity of our generation.
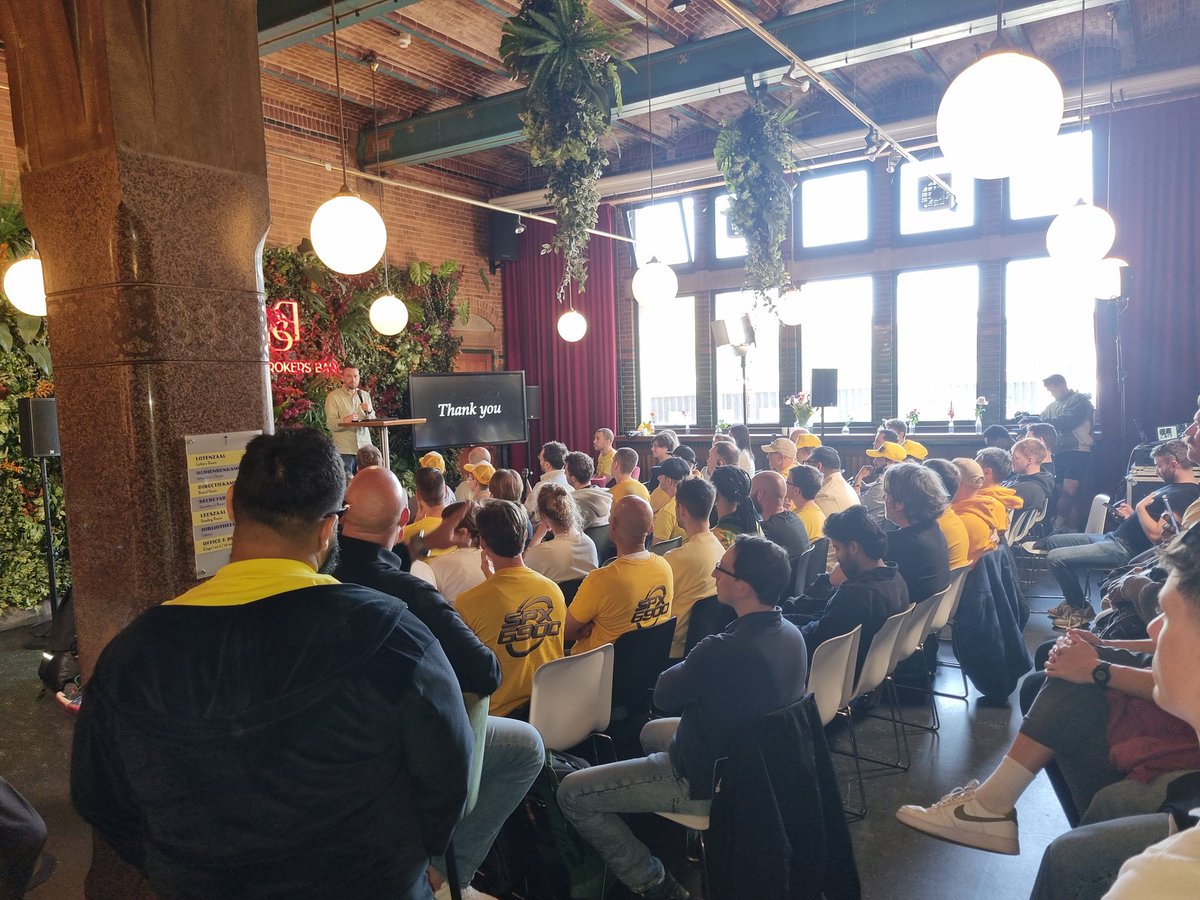
The most important Crypto Event of the year is happening tomorrow.
The SPX6900 Amsterdam Conference starts tomorrow May 9th at 8 AM UTC (4 AM EST)
125+ people will be attending.
I will also be giving a presentation.
It will be live-streamed here:
https://t.co/kOF8C6cx6j
If you cannot afford to build a large data center from scratch - congratulations!
You are *already* a member of the permanent underclass.
Look into SPX6900. A tokenized movement to flip the stock market 💹🧲
🔍 Spot Misinformation? Tag Us @ForeDex_Proof
If you come across information related to on-chain data that is unclear or potentially misleading, Where possible, we will review it and provide a clear, evidence-based explanation.
https://t.co/RJhewRV5Bz -Japan🇯🇵
https://t.co/0JcCZue2Sa - Hong Kong🇭🇰
https://t.co/R9o91yOu0k - France🇫🇷
https://t.co/3ZM48UMOKG - Vietnam🇻🇳
https://t.co/9GblFHfGji - East & North Africa
https://t.co/K6cVEsvI2W - Latin America channel
https://t.co/CxbOWxV5Xa - Africa channel
https://t.co/tIhOVTvAhF - Korea🇰🇷
⏫ Regional X Channels
https://t.co/SVlQYAqfal - Telegram Channel
https://t.co/Hxd89zNRwA -Official
"ForeDex" has closely monitored the evolving market structure and trading behavior since the approval of the Bitcoin ETF. Based on these structural changes, we have established a new standard for on-chain data analysis.
Key datasets provided by "ForeDex" include: ✅Market Maker (MM) Flow Metrics
✅Institutional Flow Metrics
✅ETF Flow Metrics
✅Advanced CVD Metrics
In addition to these core metrics, we offer a wide range of meticulously designed features and datasets to ensure an optimal user experience.
"ForeDex" is committed to continuously refining our data to deliver clearer, more actionable insights. We actively welcome user feedback and integrate it to shape the future of our platform.
BTC is quietly preparing for a run towards $222,000 while no one is looking.
A small handful of Alternative Cryptoassets will outperform even harder.
My money is on SPX6900 - the strongest Community in Crypto History.
Flip the Stock Market. 💹🧲
The latest video edition of @levolytics is also live too
Get the color commentary on the charts + newsletter
These videos basically provide my inner monologue while I’m creating newsletter (for better or for worse 😂)
https://t.co/4s7Esxdyg5
"NRPL" turning negative indicates that more investors are selling at a loss, signaling a capitulation phase in the market.
While the current pattern is similar to the past, the key difference is that it is occurring at a higher price level, suggesting that recent buyers—not long-term holdersare driving the loss-taking.
Historically, a shift in NRPL from negative back to positive has marked recovery points, and although it has not turned yet, it is now at levels that have preceded previous reversals.
The best way to make SPX6900 community grow:
Make VIDEOS and post them on YouTube, Reddit, Twitter, Facebook.
This is the best thing you can do.
Don't wait for anyone to do it.
Lead by example.
Be the change you want to see. 💹🧲
I am truly impressed with the quality of the information that ForeDex makes available. Beyond the data itself, the ease of finding it and the way everything is organized makes a real difference in daily work. An elegant and well built dashboard, pleasant to the eye and one that does not wear out those who spend hours analyzing markets.
🚀
The Macro Intelligence Dashboard from ForeDex is exactly the kind of tool that makes a difference in the daily routine of anyone who seriously analyzes markets.
Everything you need on a single screen. Macro Regime, Risk-On Composite, Liquidity Pulse, Inflation Pressure and Growth Resilience in real time, without having to open five different tabs just to build macro context before looking at any asset.
https://t.co/P4hQmKPmdr
@ForeDex_Global
Officially !!! Analyst at the Best Platform in the Market, super complete with all the data you need to make your best analyses as a Professional Analyst, the Pro version is simply Sensational Congratulations @ForeDex_Global
Font: https://t.co/WqR8OmJLVo
After months of sellers dominating the futures market, last week brought a change worth paying attention to
The Futures Taker Buy/Sell Ratio closed at 0.15 on May 2nd, touching exactly the historical resistance level that the chart has been signaling since November 2024. It is the highest level in that entire period
The most important detail is not just the number itself, but the contrast with the moving averages. The 7-day SMA sits at 0.03 and the 30-day SMA at 0.04. That means this buying was aggressive and concentrated in a short window, not a trend that has been building gradually
This kind of reading usually points to two things: either a short squeeze playing out, or a one-time institutional entry. In both cases, the market was positioned short and someone bought aggressively
It is too early to call it a trend reversal. But it is exactly the type of signal that shows up before one.
@Sykodelic_ This is a nice development from a technical point of view. Would also be nice to break and hola the short-term holder cost basis. That would add more confidence tonthe bullish view.
"Realized Price Active Supply" sits just above price (~$85K), aligning with a new, untested resistance.
This level was support in the last cycle—breaking above it is key to confirming the end of the bear market.