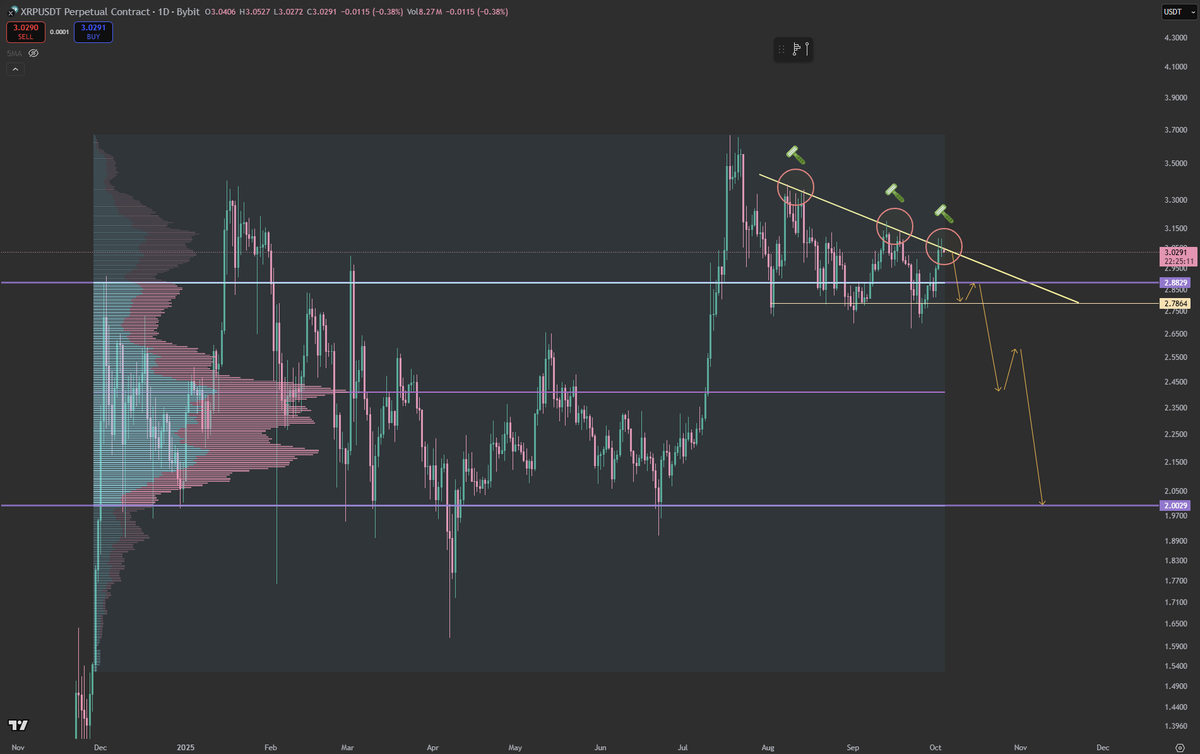
I know that this post is not going to go over well with the $XRP Army, and I am by no means saying that this is absolutely going to happen, but given the chart, I actually think that there is a solid chance something like this plays out.
@Alejandro_XBT BTC and ETH have textbook parabolas on the daily. Parabolas end in spectacular fashion. Expecting a true capitulation candle for the "blowoff" to the downside before any meaningful correction.
@Alejandro_XBT We are on the same page. $2,160 roughly is my exact target for a capitulation wick, and possibly even lower tbh. Lots of liquidity sub $2k.
https://t.co/UkuixOoFQQ
$ETH is now at a pivotal moment where we find out if it's truly going into a brutal bear market or not. Sharing this chart to demonstrate the two main targets I have for it in the case that it breaks below the weekly 20sma ($3,870).
We're hosting a live event on Wednesday, Nov. 19 to share the latest images of the interstellar comet 3I/ATLAS, collected by several NASA missions.
Tune in for the details—and send in your questions for the livestream with #AskNASA: https://t.co/vcFamtcjK2
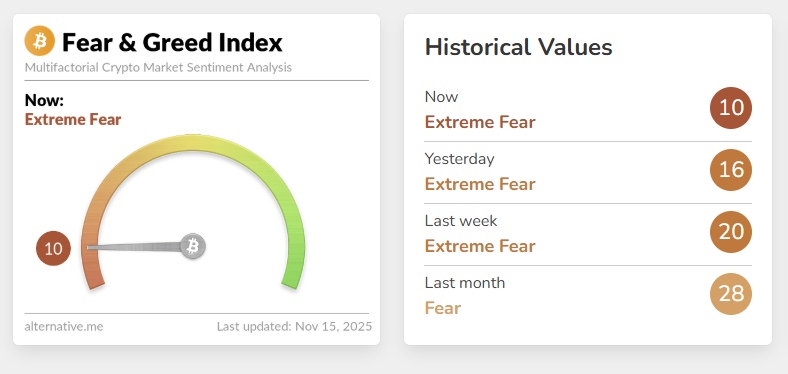
I'm telling you right now, not even the bears are bearish enough. The prices that we are about to witness on these coins in a very short period of time will be so low you think you are dreaming. But you probably won't care because the world will be in chaos.
Stay safe frens. 🙏
@alammers14@KillaXBT That is exactly right tbh. It's the same situation in any major capitulation event. Lower highs create a downtrend, which creates a shorters market until the final low is in. Opposite of a bullish trend.
1/2
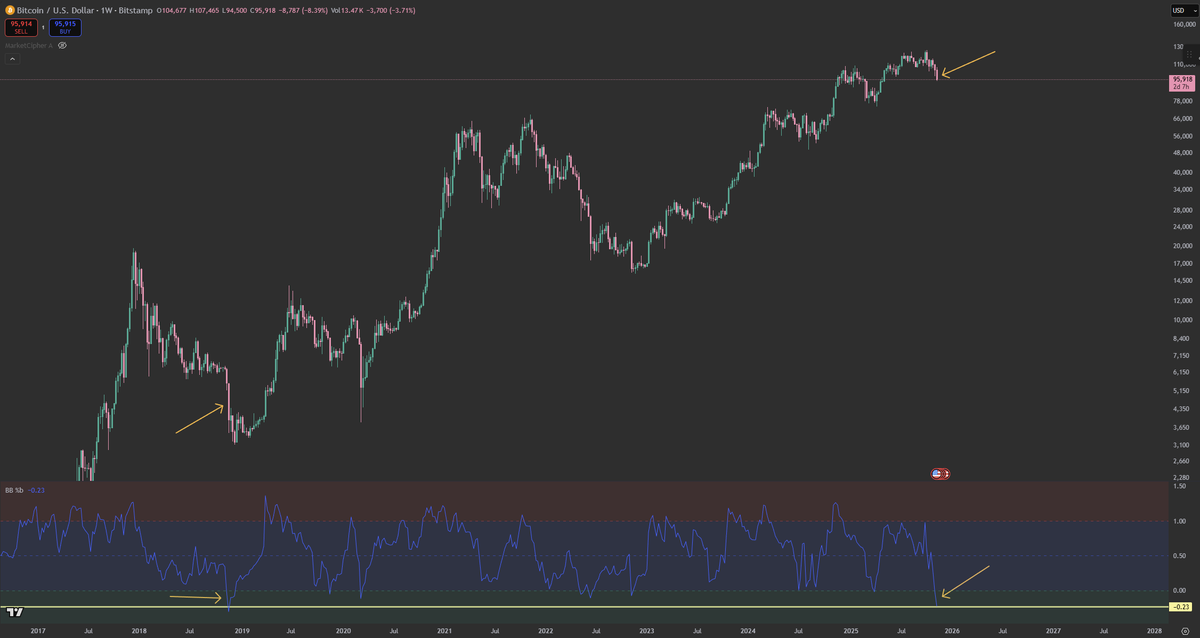
The Bollinger Bands b% indicator shows the BTC weekly currently at the second lowest reading ever. It is very rare that we even come this low on this indicator. Always marking bottoms of capitulations. The lowest reading back in 2018 was a -37% weekly candle.