BTC has now broken below the accumulation zone around $80.8K on the 12H chart, and price is trading near $79.8K.
The next major support is around $75.6K if selling pressure continues.
What do you guys think? Will this breakdown turn into a fakeout, or are we heading toward lower support?
Share your opinion in the comments, and follow for more updates.
DYOR. NFA
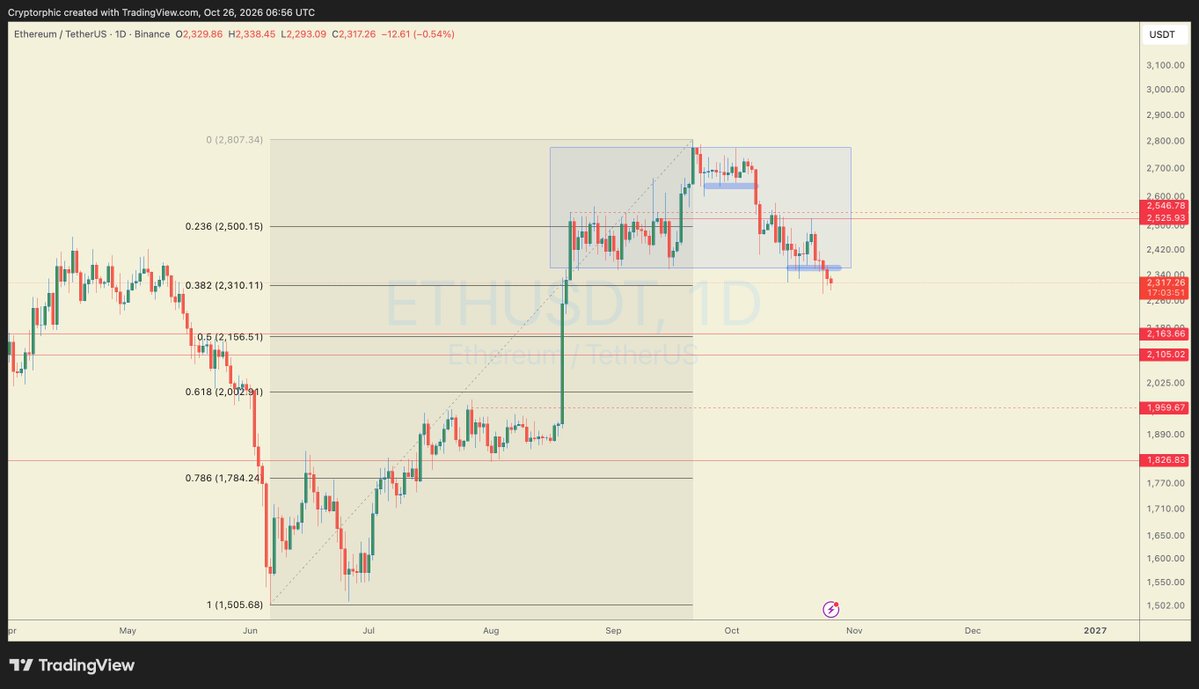
#ETH is currently below the $2,310 Fibonacci level (0.382 Fib) and is seeing continued selling pressure.
The next major support is around $2,160-$2,105, near the 0.5 Fib level. If this zone breaks, $2,020 (0.618 Fib) comes into play.
For now, the ETH needs to reclaim $2,370 to show recovery. Meanwhile, I’m playing it safe.
DYOR, NFA
After years in financial markets, I know how expensive outdated information can become.
The same principle applies to AI.
An agent making the right decision using yesterday’s instructions can still produce the wrong result.
Most people are about to buy the wrong version of "tokenised stocks" and only notice when they try to exit size.
One structure pulls liquidity straight from Nasdaq and NYSE. The others are still manufacturing their own on thin books.
The difference is already measurable in basis points, and it compounds every time volume shows up.
Ondo just published the clearest breakdown yet of what separates its tokenised stocks from the rest of the field.
The short version is simple.
Most platforms have to create liquidity from scratch onchain. Ondo does not.
It mints and redeems through US registered broker dealers that sit directly against the order books of traditional exchanges. When you buy or sell, the flow can hit real market depth instead of whatever thin pool exists that day.
They put numbers on it.
Price impact on a $200,000 SPY trade, some competing platforms:
about 200 basis points
Same trade on Ondo:
about 2 basis points
Same asset, same size, a hundredfold difference in what the trade costs you in slippage.
That gap exists because one design inherits liquidity with billions of dollars behind it, and the other has to build it from nothing.
The rest of the advantages stack on top of that core choice.
Tokenised stocks and ETFs available to eligible non US investors:
450+
Total value locked, first to cross:
$1B
They were the first to run true 24/7 minting and redemption for the most liquid names, including Apple, Nvidia, and Tesla. Transfers work anytime.
Each token is fully backed by the underlying shares plus cash in transit. An independent agent verifies the backing every business day.
A separate security agent holds a first priority claim for token holders, and the structure is designed to stay protected if the issuer goes bankrupt.
Dividends, net of withholding tax, are reinvested into the position. The token tracks the full return of owning the stock and reinvesting the payouts.
And the tokens move. You can transfer them and use them across DeFi instead of being locked inside one brokerage app.
Most tokenised stock products still force a tradeoff. Better liquidity with weaker onchain features, or stronger onchain features with worse execution.
Ondo's design is the attempt to keep both.
If you hold or are considering tokenised equities, the useful filter is not the logo on the token.
It is whether the structure can absorb real size without punishing you on the way in or out, and whether the backing and redemption rights hold up when markets get stressed.
Marketing is easy. Execution quality and legal structure are much harder to fake.
The full breakdown, with the diagrams and side by side comparison, is in the first reply.
Which of these differences would actually change how you size or hold a tokenised stock position?
Most people will choose the loudest campaign. The ones who check the liquidity path first will keep more of every trade.
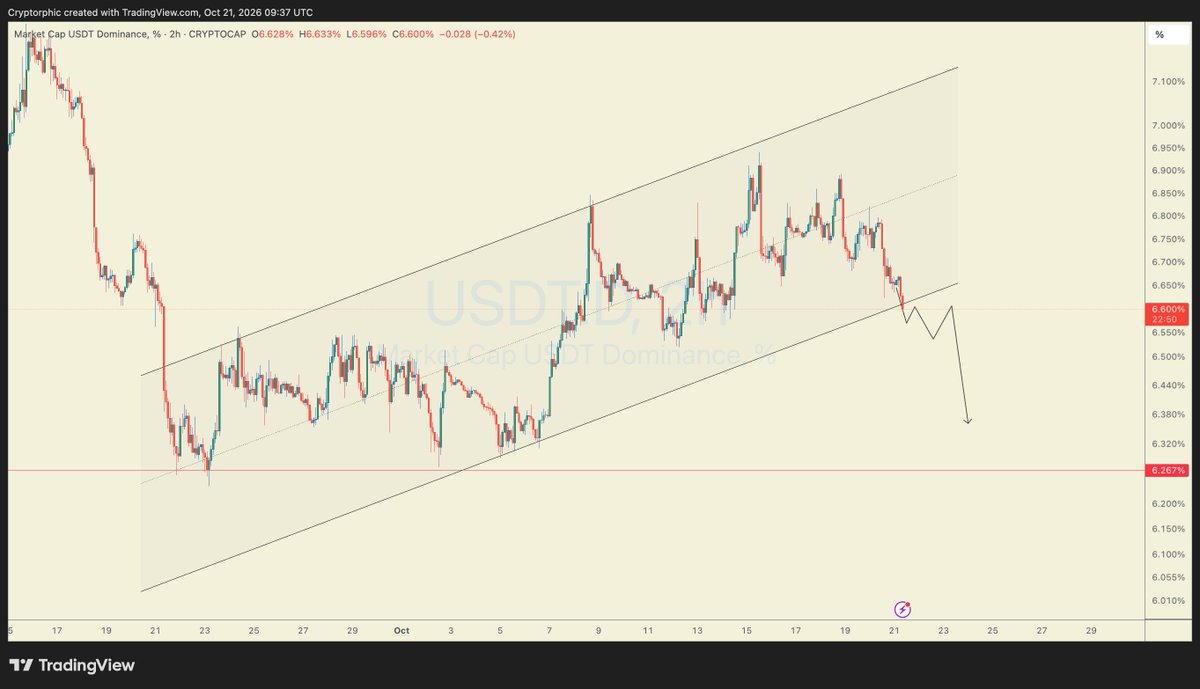
USDT.D is pulling back toward the lower boundary of the rising channel, currently trading around 6.60%. This is a key area to watch, as a breakdown could change the short-term outlook for the crypto market.
My view is that if USDT.D loses channel support and fails to reclaim it, we could see a move toward 6.38%–6.27%. That would be a positive sign for BTC and altcoins, as capital could start rotating back into the market.
However, a bounce from the channel support could keep USDT.D moving higher for now. I’ll be watching how price reacts here before drawing any firm conclusions.
DYOR. NFA.
Building an AI company has made me appreciate the human side of business even more.
You can learn a lot from data, but nothing replaces seeing a product in the real world and understanding the people behind it.
And yes, sometimes that research involves beautiful powerboats.
Everyone posts price targets. Almost nobody says what has to happen to hit them.
Here is the one thing each of my 2029 picks needs to get right.
$ONDO: a fee switch that pays holders
$TAO: subnet revenue that outgrows emissions
$HYPE: volume that keeps funding buybacks in a bear market
$LINK: banks settling tokenised assets on its rails
$ETH: layer twos that send value back to the base layer
$SUI: apps that keep users after incentives end
$ZEC: privacy demand that survives the regulators
$BNB: Binance staying the default exchange for the world
Which one has the hardest job?
A price target without a catalyst is just a wish with a dollar sign.
$USDT Dominance: Rektober or a BEAR TRAP?
USDT.D is trading around 6.88%, recovering from its recent lows and approaching a key resistance zone.
Here's what I'm watching:
6.88%–6.95%: Immediate resistance. A rejection here could trigger another move lower in USDT.D, potentially benefiting BTC and altcoins.
7.17%: Key resistance. A breakout and sustained move above this level could signal further downside for the crypto market.
6.75%–6.65%: Immediate support. Losing this zone would strengthen the bearish outlook for USDT.D and be extremely bullish for BTC and Alts.
5.95%–5.75%: Potential downside target if bearish momentum accelerates.
RSI is recovering, so a short-term bounce in USDT.D remains possible. However, the price is approaching a crucial resistance confluence.
My view: I want to see USDT.D reject resistance and resume its downtrend. That would be a positive signal for crypto, particularly altcoins. Not to forget, BTC is still holding the $80k zone.
DYOR. NFA.
#CryptoNews
You bought the AI narrative.
Bittensor built the AI revenue.
$50M a year from real customers.
Up 40% in one month.
Halving already done.
$ONDO has $4B onchain and sends its token zero.
$TAO subnets already buy back their tokens with revenue.
One is a story. The other is a business.
Which one are you holding?
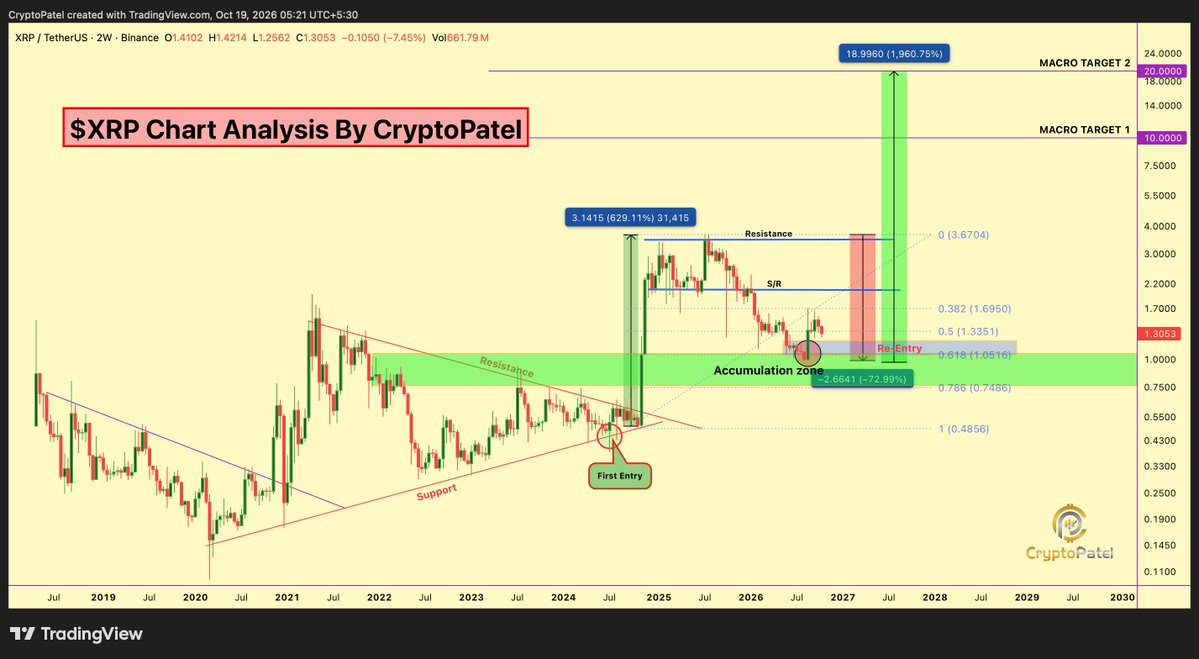
99% WILL IGNORE THIS $XRP CHART AND REGRET IT IN 2030
Technical analysis on the HTF chart: the accumulation zone filled and paid +73% 🚀
✅ Accumulation zone: $1 – $0.70 (filled)
✅ Profit after the fill: +73%
✅ Multi-year triangle breakout confirmed in Nov 2024.
✅ 0.618 Fib Strong Support Must Hold for Bullish Rally.
Re-entry zone: $1.22 – $1
Price targets: $4 → $10 → $20
The bull run is reloading. Don't miss the second leg.
TA Only. Not Financial Advice. ALWAYS DYOR.
You check the $TAO price every day.
The number that actually decides your bag is the one the blockchain still cannot show you.
Bittensor can prove almost everything onchain. Stake, emissions, pool balances, alpha prices, all of it, live.
What it cannot prove is how much real money customers pay subnets, because most of that business happens offchain.
Here is the simplest way to see why that matters.
Emissions are a company paying its workers in stock. Revenue is customers paying the company.
One keeps the lights on. Only the other proves the business works.
And I will hold myself to this too.
The $50M subnet revenue number I shared this week is reported, not audited. It is the best signal we have, and it still needs proof.
So stop refreshing the chart and watch three things instead.
1. Revenue backed by real receipts, not usage claims
2. Gains spreading across many subnets, not just a few
3. Pool liquidity deep enough to exit at size
The chart tells you how the crowd feels. Verified revenue tells you whether they are right.
Ondo is the second largest RWA issuer onchain, and its token just dropped 25% in three weeks.
One of those two facts is mispriced, and the chart is about to show which.
Ondo distributed RWA value:
$4.0B
Breakout wick high:
$0.61
Price now:
$0.455
From July to September, $ONDO was trapped under $0.42 to $0.43. Every rally into that zone got sold.
Late September it finally broke through, and that old ceiling is now the floor being tested.
Twice this month sellers pushed price into $0.42. Twice buyers closed it back above $0.44.
The problem is overhead. Since the $0.61 top, every bounce has peaked lower, first at $0.53 and then near $0.48.
Momentum agrees for now. Daily MACD sits under its signal line and daily RSI near 47 has slipped below its average.
The business keeps growing while the chart retests.
Resistance to reclaim:
$0.50
A daily close above it breaks the lower high pattern and puts $0.53, then $0.61, back on the table.
Support to defend:
$0.42
Lose it and price falls back into the old range, with $0.35 as the next real floor.
That is the entire trade.
Textbook retest, or failed breakout?
Breakouts that hold their retest become trends.
Breakouts that lose it become lessons, and $0.42 decides which one this is.