Calling ALL coders! 📢
Here's your chance to win $500.
If you know Pine Script® or other languages, this challenge is for you. Test your skills and try to beat the markets at the same time.
Click and read to join: https://t.co/Eo9j8R2qWe
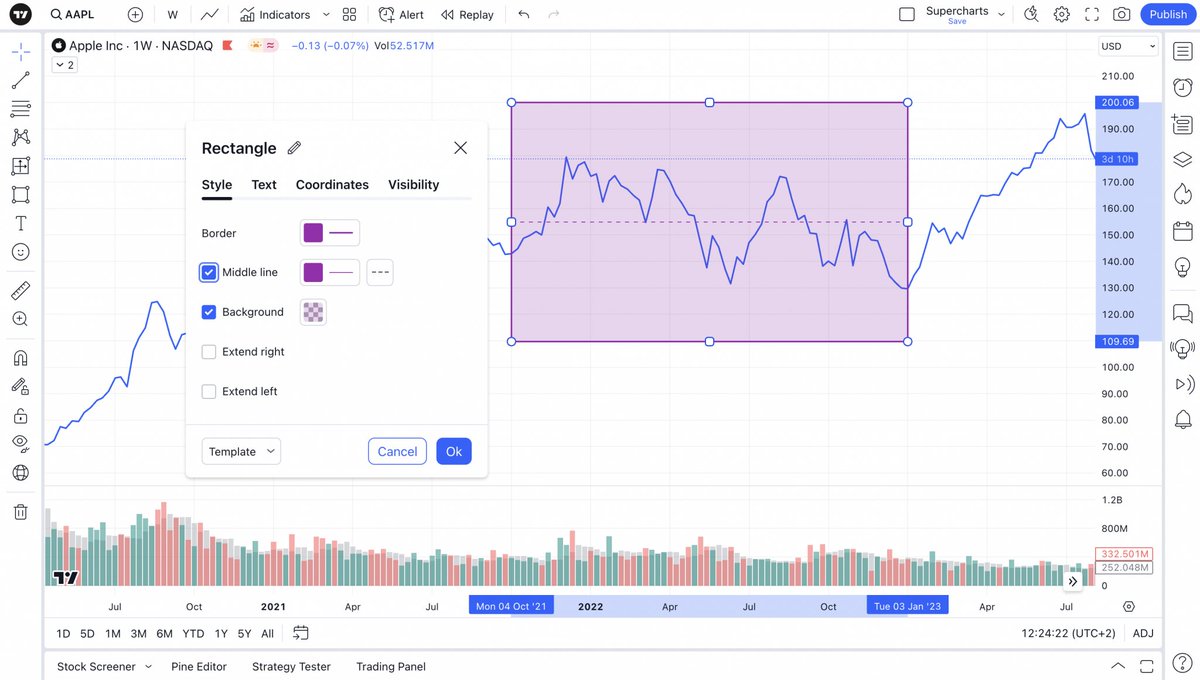
If you love drawing support zones with our Rectangle tool or utilizing the latest ICT drawing methods, we've got a new feature to show you... ⤵️
Our Rectangle drawing tool is now equipped with a middle line. This means traders can add perfect midpoints within any drawn rectangle.
Why does this matter?
• Oftentimes support zones take up plenty of area and the middle line shows an average of that area.
• The middle line can be used as another way of drawing support or resistance.
• For traders who want more creative annotations, the rectangle tool has new functionality.
Go ahead and give it a try!
We look forward to seeing all your charts, trades and drawings.
- TradingView team
Tesla $TSLA 🫣
Shares have fallen -10% since yesterday's earnings report.
Wtf happened?
• Missed EPS estimates
• Missed revenue estimates
• Reported lower operating margins
But long-term investors always know to zoom out, as Tesla is still up nearly 100% since the start of the year. It's doubled in 2023.
That also means that Tesla remains one of the best performing large cap stocks in both the S&P 500 and Nasdaq 100.
Netflix $NFLX is popping.
Here's why:
- Added about 8.8 million net new paid subscribers.
- Raised two of their plan subscriptions by 15% and 20%.
- New $10 billion share buyback program.
- Beat EPS and revenue estimates for the quarter.
- Plans to spend $30 billion on content within the next two years.
- Free cash flow is expected to rise from $5 billion to $6.5 billion.
This would be Netflix's best earnings report in over a year.
Most new traders overestimate the short-term and underestimate the long-term.
That mindset needs to be flipped.
Far more can be accomplished in 10 years than what can be accomplished in 10 minutes.
One of the oldest and largest metal exchanges is now available to all TradingView members.
Want to chart cobalt?
Want to research the latest in aluminum?
Please join us in welcoming the London Metals Exchange to our platform. To get started, type LME: into the search box as shown in the image below. Then, when you're ready, select the futures contract that you want to chart and research.
For example, here's a chart of Cobalt futures, directly from the LME.
LME was founded in 1877 and over 134.2 million lots traded just last year.
To read more about this new data and how to access it, read our official launch post here: https://t.co/FARFGTwjAP
Oh, don't forget, you can also follow LME on X @LME_news.
Thanks for reading and we hope you enjoy this new data!
- TradingView team
⬡ Introducing Constellation: a Chainlink Hackathon ⬡
- Compete for $350K+ in prizes.
- Attend expert-run workshops
- Get real-time support
Take your developer journey to the next level👇
Here are 5 custom coded indicators to improve your research, charting, and trading.
All of these indicators were coded in Pine Script by individual traders & investors. Be sure to thank these coders for sharing their work freely and openly. ❤️❤️❤️
Let's begin! ⤵️
1. AI Support & Resistance by ThinkLogicAI
Let machine learning do the hard work for you as this indicator will automatically detect support and resistance levels looking for clusters and similarities.
Get it here: https://t.co/KlIZAjeBbs
2. Tops and Bottoms by sbtnc
This indicator tracks tops and bottoms by time and displays the stats directly on your chart. This way, you know when the most important turning points happen.
Get it here: https://t.co/aGfsjU4mQo
3. The All Candlestick Pattern Backtest by MUQWISHI
This indicator shows historical returns for specific candlestick patterns. It allows traders to better understand the candlesticks that matter most.
Get it here: https://t.co/Wjop7pr8uX
4. Monte Carlo Simulation and Your Strategy by KioseffTrading
Combine your strategy with a Monte Carlo simulation to generate multiple random future outcomes.
Get it here: https://t.co/gKXyXTckP3
5. Multi-Asset Performance by LeviathanCapital
This indicator calculates the percentage changes or returns of 30 symbols and neatly displays them on your chart. Compare and contrast different assets whenever needed.
Get it here: https://t.co/HiPRkk3Mma
We hope you enjoy these custom coded indicators! Thanks for reading. 📈🤗
Yearly performance update by asset 👇
The winners, so far 🕺
Orange juice +90%
Bitcoin $BTCUSD +61%
Ethereum $ETHUSD +29%
Nasdaq-100 Tech $NDX +37%
US Dollar / Yen $USDJPY +14%
Crude oil +14%
S&P 500 $SPX +13%
The middlers 😃
Gold +5%
US Dollar $DXY +3%
Russell 2000 Small Caps $RUT -1.7%
Euro / US Dollar $EURUSD -1.5%
Those in the red 😥
Turkish Lira / US Dollar -33%
Corn futures -28%
Volatility $VIX -16%
10 Year US bond -8%
Silver -5%