We add value to our CRE Suite platform through services that put your ROI front and center. For example, our expert analysts can act as a third-party sounding board to stress-test your numbers and assumptions in the model. They live and breathe the platform and can help you accomplish key tasks faster and optimize your performance.
The only full-featured real estate development platform built for developers.
Budgets. Pro formas. Waterfalls. Pitch books. CRM. Reporting. Mixed-use.
All in one: The CRE Suite from CREModels.
🎯 Get a demo: https://t.co/lCbiUlbCnr
@dexhorthy gave a great presentation at @aiDotEngineer code summit. def worth a watch. how do you know when you're out of quality context? you'll see...
🆕 No Vibes Allowed: Solving Hard Problems in Complex Codebases
https://t.co/k9lTJJK9ka
@dexhorthy returns for the epic sequel to his viral talk on Context Engineering, sharing how to avoid slop and stay out of the dumb zone with Harness Engineering with TONs of practical advice/examples
Interesting to watch the continuation fund trend evolve. @CREModels analysts, in addition to modeling for the GP, can act as a sounding board in situations where LPs have questions and want to make sure the process is fair. https://t.co/CiVHprG9GY
Continuation funds are taking off. CREModels can walk you through how to model this flexible, LP-friendly approach to extended ownership and higher value. Learn more... https://t.co/Etu8oUnesQ
Great to see the difference it makes for @CREModels developer clients as they start using our CRE Suite platform and outsource some of their heavier financial modeling work to our team. Check out our case study: https://t.co/5pdMn0BBtH
Growing real estate firms need scalable expertise. See how Inception Property Group partnered with CREModels to streamline underwriting + asset support in our new case study: https://t.co/IsIGo9Kuqv
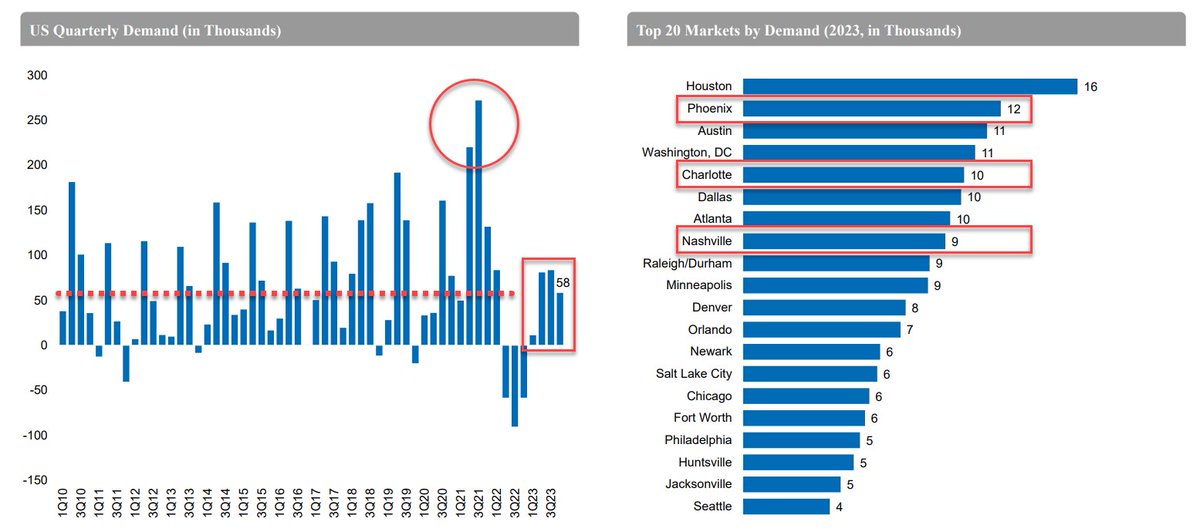
Do you know how quickly supply and demand can change? Sifting through the 50+ pages of Newmark's 4Q 2023 US Multifamily Report (https://t.co/ojBHmQRuKY), I was reminded the differences between supply and demand. We often treat these as "balancing acts" where supply can offset demand and vice versa. The problem we tend to gloss over is that supply in almost every industry is extremely slow, time-consuming, and capital intensive to produce. Whether that's building apartments, hiring a team, manufacturing widgets, or writing software. "Making things" takes time and energy. But demand, on the other hand, can change instantly at the whim of the crowd. A city can be hot today and cold tomorrow (or vice versa). Tech can be a must-have one day and old news the next. Supply is turning an aircraft carrier, while demand can be more like the weather.
So I look at these two charts and I see a few things...
1. The supply coming online will be building. And there's not much you can do to change it. It's coming. And while there is a drop-off coming in 2025, there are still a lot of "area under the curve" so to speak that needs eaten up.
2. Based on this chart, the "excess supply" (if it is excess, which many would argue is just catching up) looks like it's about 2yrs in a inverted "v" shape. if we somehow manage to architect a "v" shape on the opposite side, then that would seem to balance out. and so far, it seems like we are on track for this.
3. The supply projected in 4Q 2025 looks to be less than any year going back to 2Q 2013. Again, this is unlikely to change much.
4. According to this chart, demand was crazy for two quarters in 2021, otherwise it wasn't that insane. And demand seems to have settled into historical norms in 2023.
5. The top 20 markets include Phoenix, Charlotte and Nashville, which were also mentioned by CBRE in a recent post (https://t.co/tL1JzUU0cc) as those that are likely to bounce back fast... worth noting here.
Where is "normal" M2? And, does "normal" M2 get us to a "soft landing"? I am not an economist, nor do I play one on TV. But I did notice this on the @federalreserve's FRED. When you look at a chart of M2 from 2000 to today, a few things jump out at me... and I'm left with a lot of questions also...
1. There is definitely a difference between the slope of the line from Y2k to GFC vs the slope from GFC to COVID. In the early years, it's not as noticeable, but as you extrapolate over time, it's significant.
2. There was a huge jump due to COVID stimulus that "gapped up" bringing us farther away from both.
3. To get to the goldilocks "soft landing" scenario, do we need to asymptotically revert and rejoin one of these trend lines? What if we overshoot? What if we never even get there? Do we even NEED to get there?
4. Interest rates initially looked like they were bringing M2 back down, but recently, it's been trending back up again. Is this good or bad?
5. Was the difference between POST-GFC and PRE-GFC M2 growth a key cause of that era's immense growth in asset values?
6. If we DO need to revert to one of these trend lines, which one is "better" and what will it "feel like" to go through this reversion?
7. Does this "gap" represent excess money in the economy that is allowing interest rates to remain high yet also maintain strength? Can interest rates alone reduce it? Should they be used to do so?
8. Does this chart show where the "sticky inflation" is coming from?
9. Looking at this chart alone, if the @federalreserve decides to close this gap, then I suppose high interest rates could do so over time, or do they need help from other areas? Why the recent upward trend?
10. How long would it take to close this gap? M2 was shrinking from April 2022 through October 2023, but now we've erased about 7 months of that decline. Will this push the goal posts farther away?
It was good to chat Real Estate + AI with Joel Groover for @ICSC's article, along with @GreggKatzCRE -- Read the article (no paywall) here... https://t.co/iPshJGTNp7
@TAYVAY_ IMHO this totally depends on the market. in a hot market, $100M is prob easier than $1M. in a tough market, $100M much more difficult. large deals seem to follow general capital flows more closely.
In the current market, efficiency and optimization are key. If you are looking to add bandwidth to your your bench with the brainpower to execute day one, consider @CREModels
Maximize the potential of your real estate assets with @CREModels comprehensive 360° Analysis Services. From stress-testing for changing market conditions to creating eye-catching investor pitch decks, we've got you covered! #retwit#CRE
https://t.co/3EgBHkLzHK
@CasJam great idea! could also mean "started" and "completed"... i always envisioned this as a single box with multiple staged interactions, like open -> half full -> full or something like that... this is even better. do u know any UI that implements this? u need a name for it...