Brooklyn's Finest Classical Chartist.
Fiercely determined with a powerful sense of possibility.
Technical analysis insights for education only.
Long swing on $AI
Chart just broke out from a 12-week ascending triangle reversal pattern.
Using the Last Day Rule here. Stop placed at $9.53 (low of the candle that pierced the upper boundary).
$AI 10.99 #AI#Articialintellegence long term face as low as 8.80 now looks like a great reversal starting
Confirmation above 13.16
Gap fill : $20+
Comment below if you follow the setups and what you like about my posts
Could this be like the $NVDA call $18 or the $PLTR
@CredibleCrypto@Trollgee@Ramyelshafay Daily triple tap on ethereum:0xd533a949740bb3306d119cc777fa900ba034cd52
Sellers are running out of steam, and buyers are stepping in.
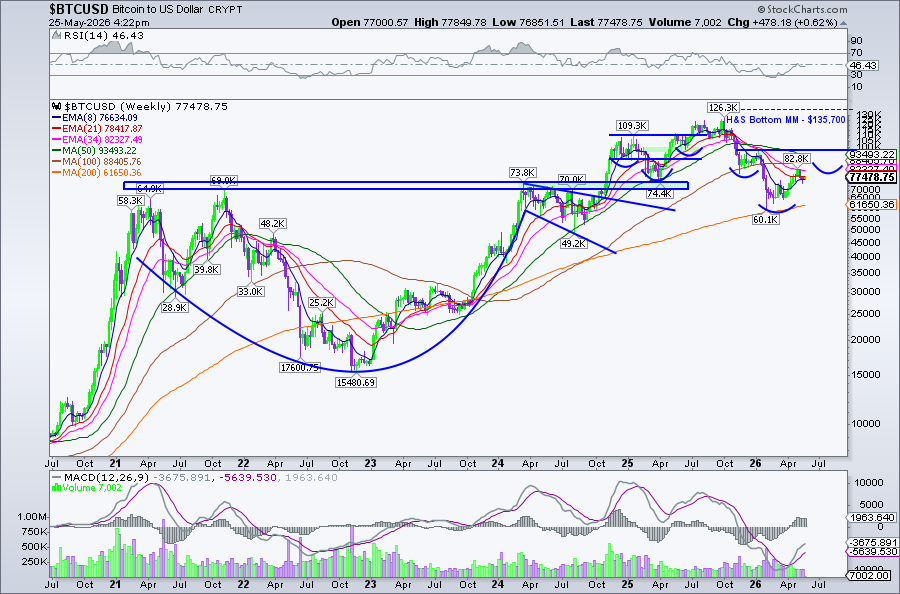
Still bullish on #Bitcoin long term.
One potential outcome in the months ahead: the bottom is in, and we’re forming a Head & Shoulders bottom.
A potential neckline could form in the weeks ahead around $98,000.
If this scenario plays out, I’d be looking for a break above $82,813 as the next key step.
Nothing is concrete yet. Just something I’m observing.
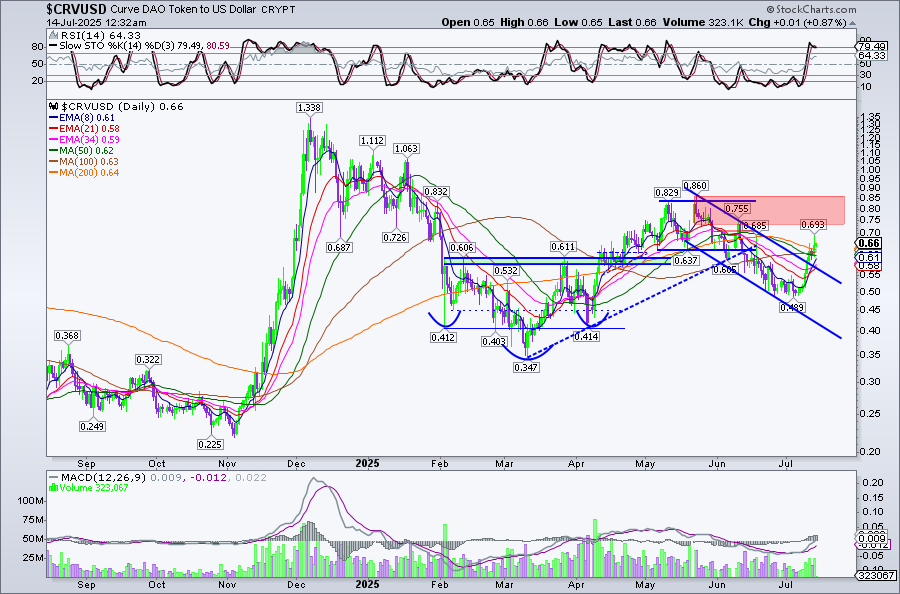
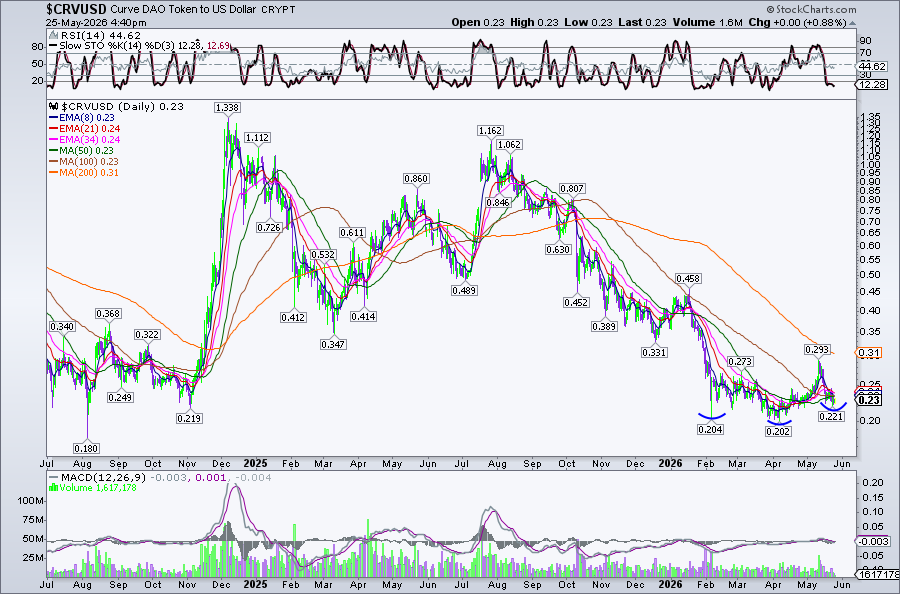
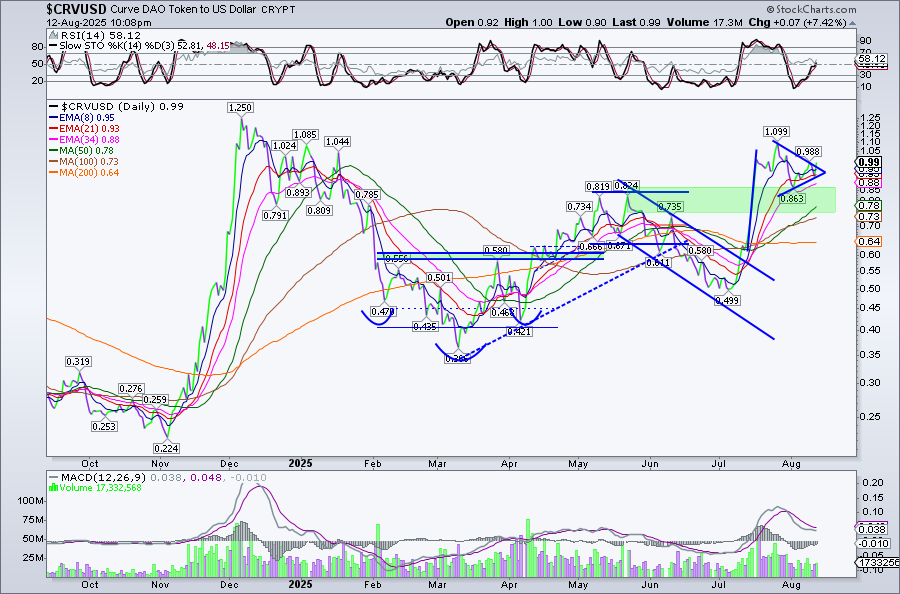
$CRV completes a 12+ week rounding bottom reversal pattern with strong volume flowing in and a big green candle above the horizontal boundary.
Given the length of the base and the overall structure, this starts looking less like a bounce and more like a potential major trend reversal if continuation follows through.
$MARA showing a similar ascending triangle reversal pattern setup to Bitcoin, but has already confirmed today. Measured move projects toward ~$13, aligning with the 200MA.
@PeterLBrandt Chart 3: upward slant into the neckline with clean symmetry across both shoulders.
Diary of a Professional Commodity Trader calls this out 🤝
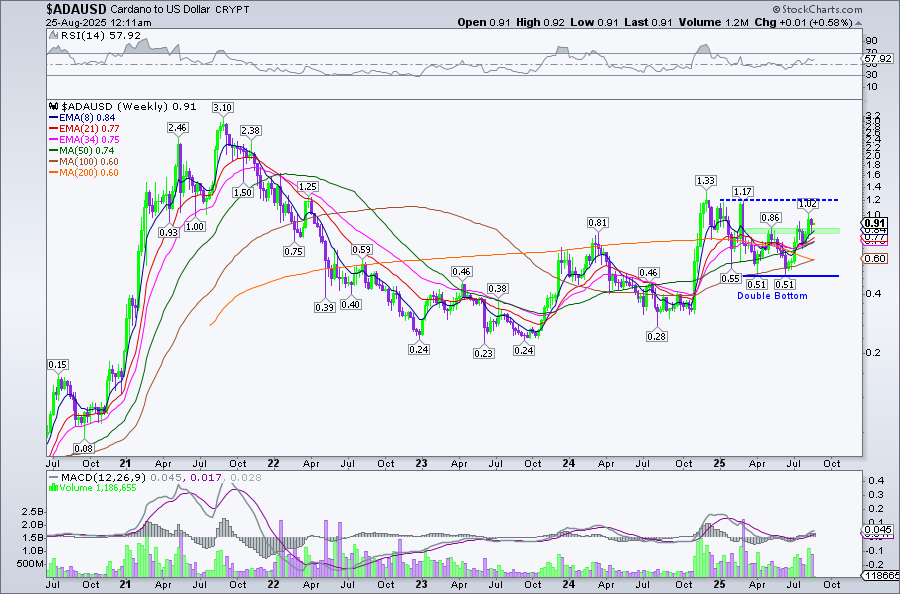
$ADA
✅ #Cardano has completed a 5-month Double Bottom reversal on the weekly timeframe, with a throw-back to the top boundary and the rising 8EMA confirming a resistance-to-support flip.
This is a major bottoming pattern that sets a measured move target at $1.17.
If that target is achieved, the structure morphs into a bullish Rectangle with clearly defined upper and lower boundaries — setting the stage for a potential follow-up move toward $1.83.
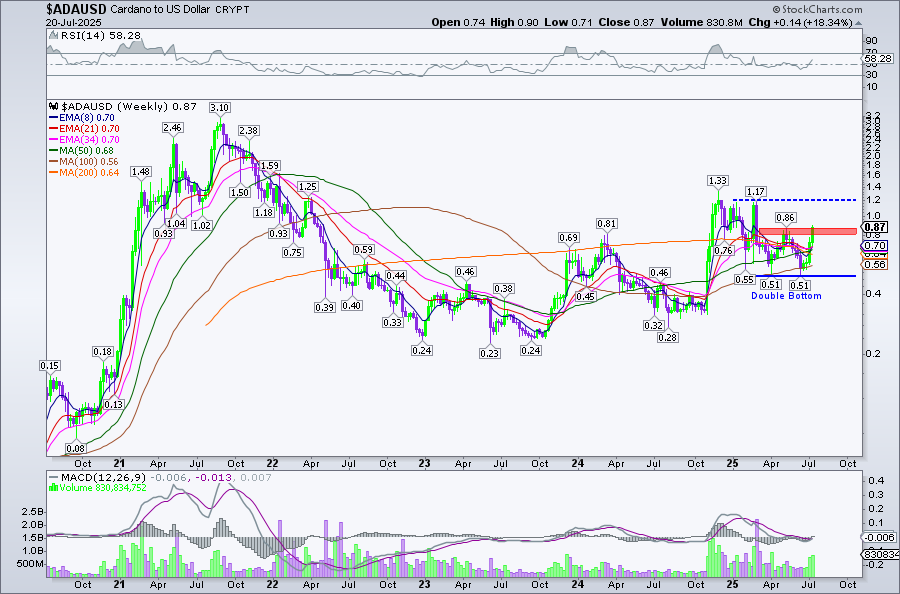
$ADA is setting up to complete a 5-month Double Bottom reversal pattern — a major bottoming structure. On the weekly timeframe, a close today above the horizontal boundary at $0.86 would complete the pattern and set a measured move target at $1.17.
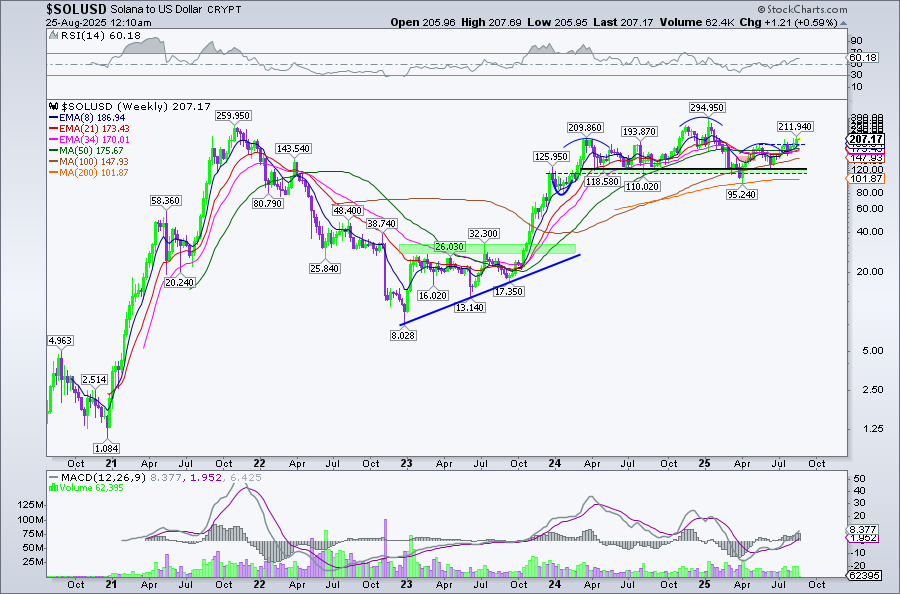
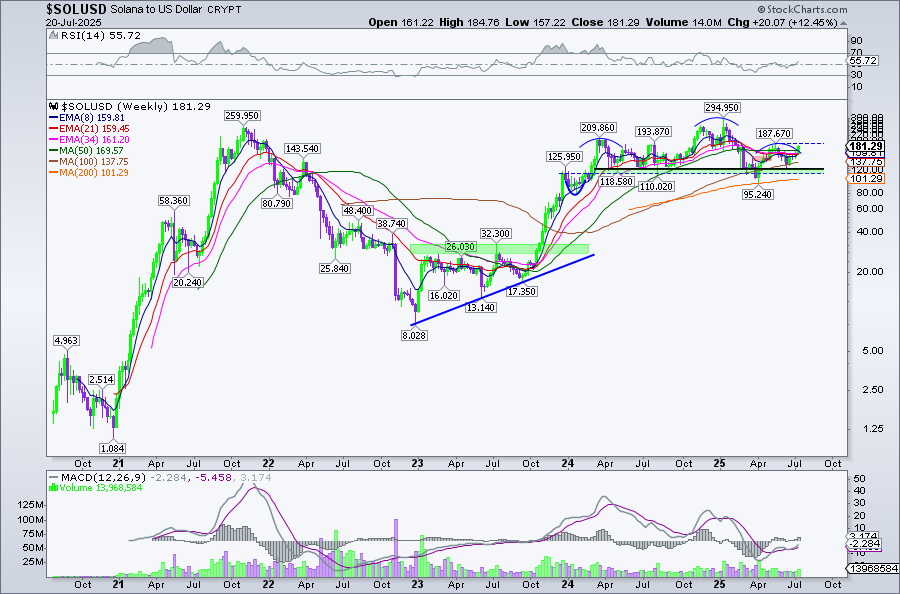
$SOL
✅ The weekly close above the right shoulder at $188 confirms a Head & Shoulders Top Failure completion.
This sets the stage for a measured move toward $373, with #Solana now eyeing all-time highs and potential price discovery in the weeks ahead.
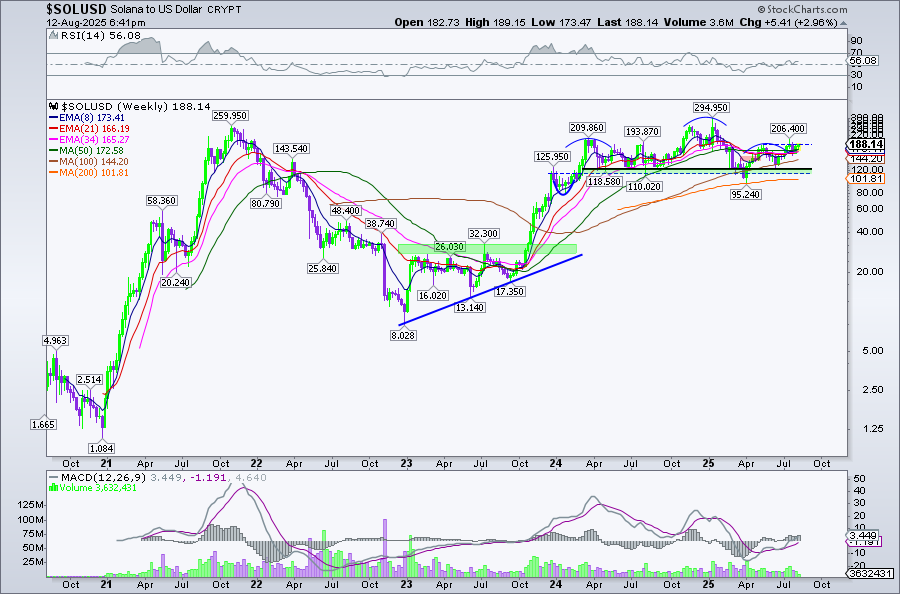
$SOL has spent the last 16 months forming a Head & Shoulders Top pattern with a neckline at $110 and a right shoulder building since April.
Instead of breaking down, price held firm at the neckline, and the structure is now positioned to flip bullish upon confirmation.
A weekly close above the right shoulder at $188 completes a Head & Shoulders Top Failure pattern, invalidating the bearish setup and opening the door for a measured move toward $373.
With this level cleared, $SOL would be eyeing all-time highs and potential price discovery in the weeks ahead.
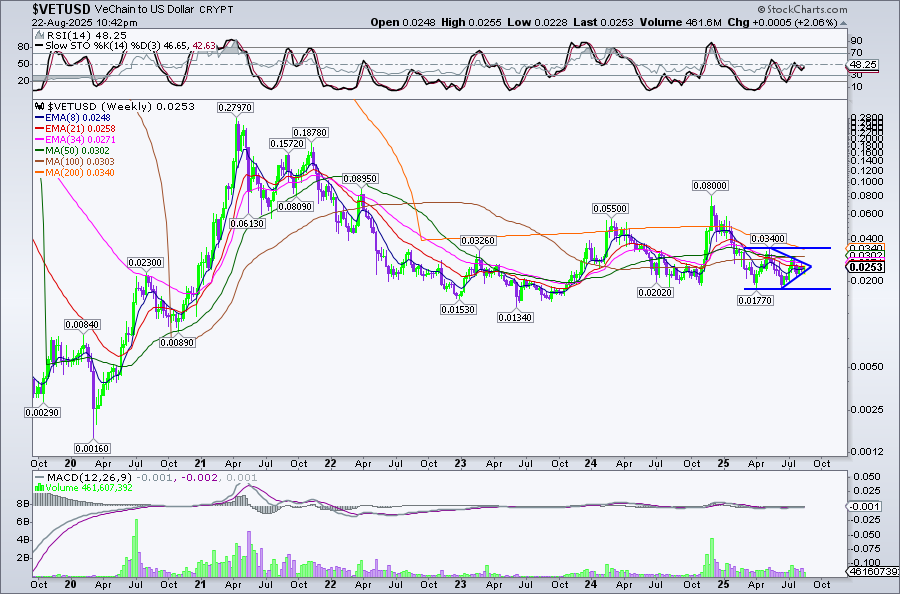
$VET
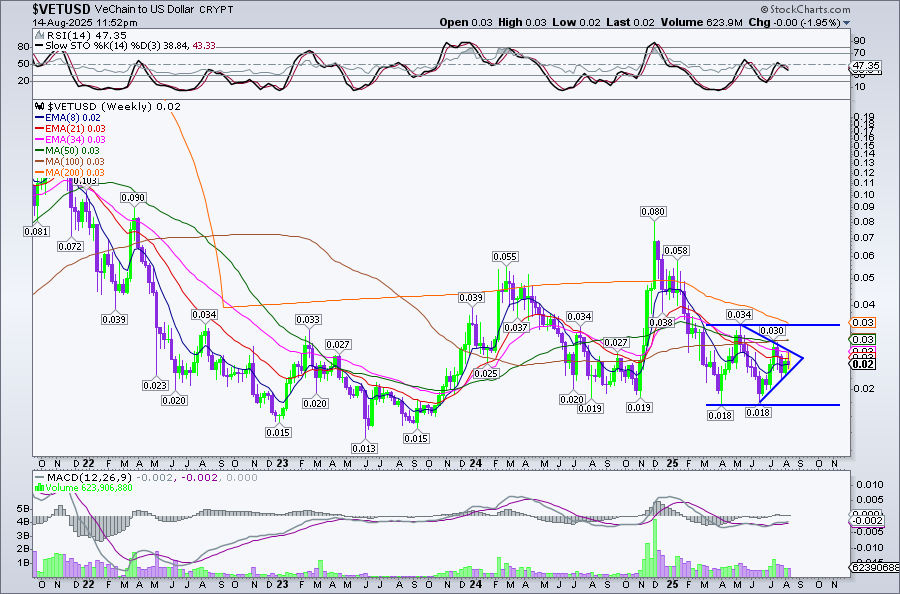
Double bottom is still in play, with the lower boundary at 0.018 and top boundary at 0.034. A weekly close above 0.034 would confirm the pattern, setting up a measured move target toward 0.05.
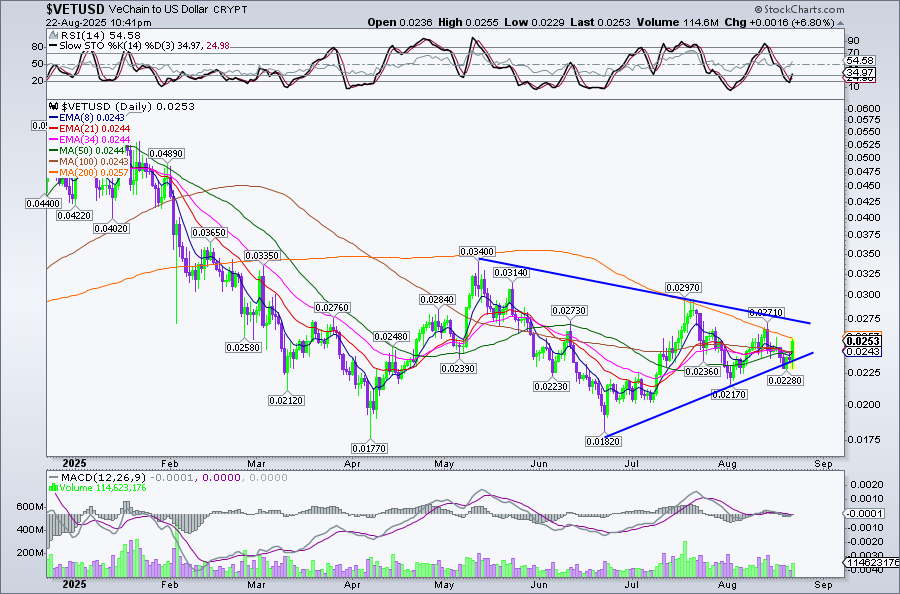
On the symmetrical triangle, $VET has now printed a higher low at the ascending lower boundary. With price action pressing into the apex, we’re entering the zone where decisive moves tend to happen.
#Bitcoin and #Ethereum are both showing strength, adding momentum to the possibility of an upside breakout on the horizon.
$VET has formed a Double bottom pattern with the lower boundary at 0.018 and the top boundary at 0.034. A weekly close above 0.034 would complete the pattern and set a measured move target of 0.05.
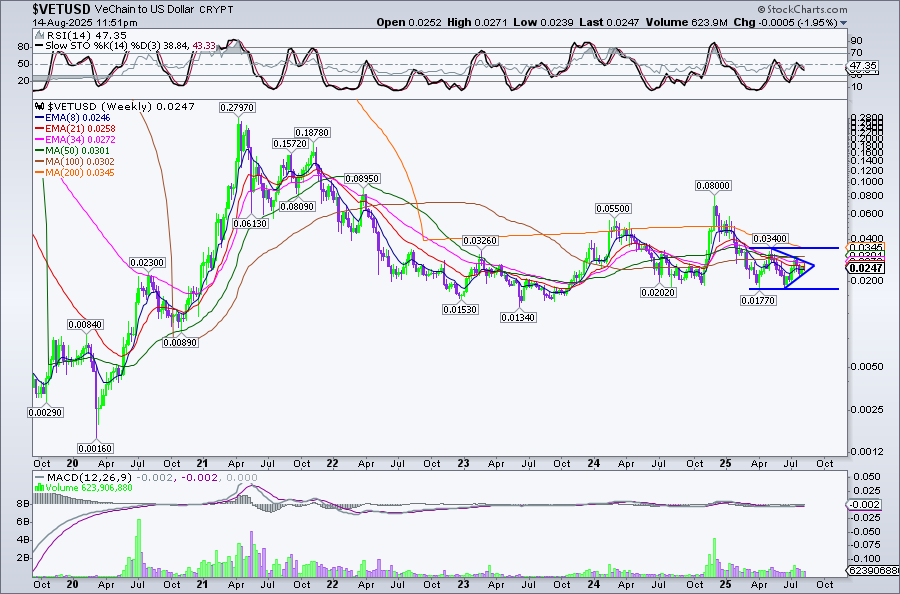
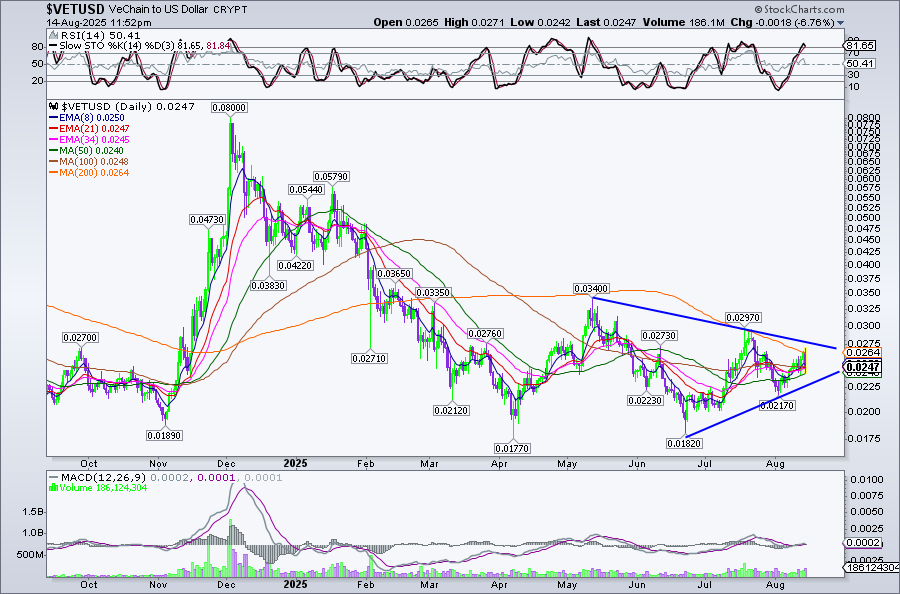
On both the weekly and daily charts, price action is also approaching the apex of a Symmetrical triangle. We’re nearing the 3/4 mark of the apex, which can often precede a breakout. A decisive move above the triangle’s upper boundary, which also aligns with the 200MA, could trigger momentum toward the double bottom’s top boundary at 0.034.
$VET has formed a Double bottom pattern with the lower boundary at 0.018 and the top boundary at 0.034. A weekly close above 0.034 would complete the pattern and set a measured move target of 0.05.
On both the weekly and daily charts, price action is also approaching the apex of a Symmetrical triangle. We’re nearing the 3/4 mark of the apex, which can often precede a breakout. A decisive move above the triangle’s upper boundary, which also aligns with the 200MA, could trigger momentum toward the double bottom’s top boundary at 0.034.
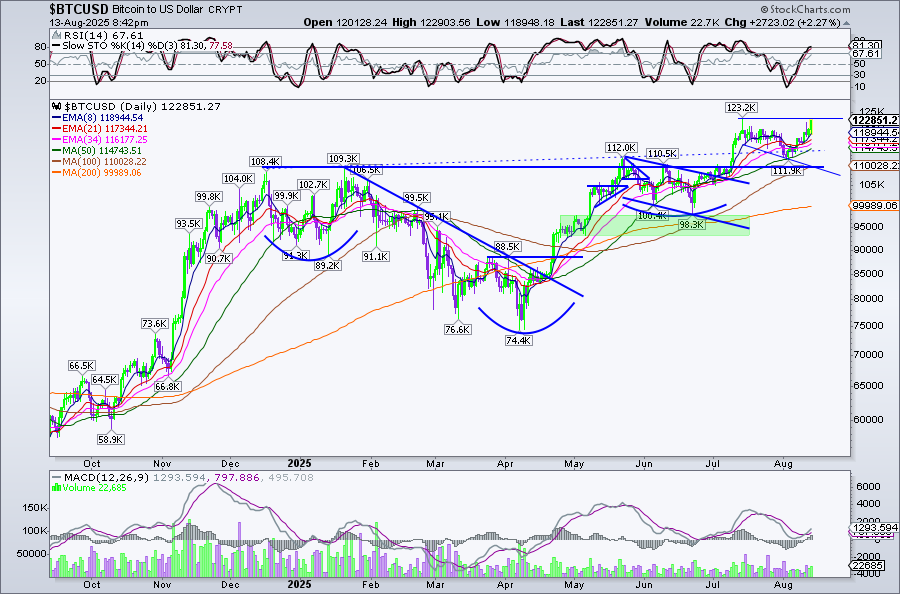
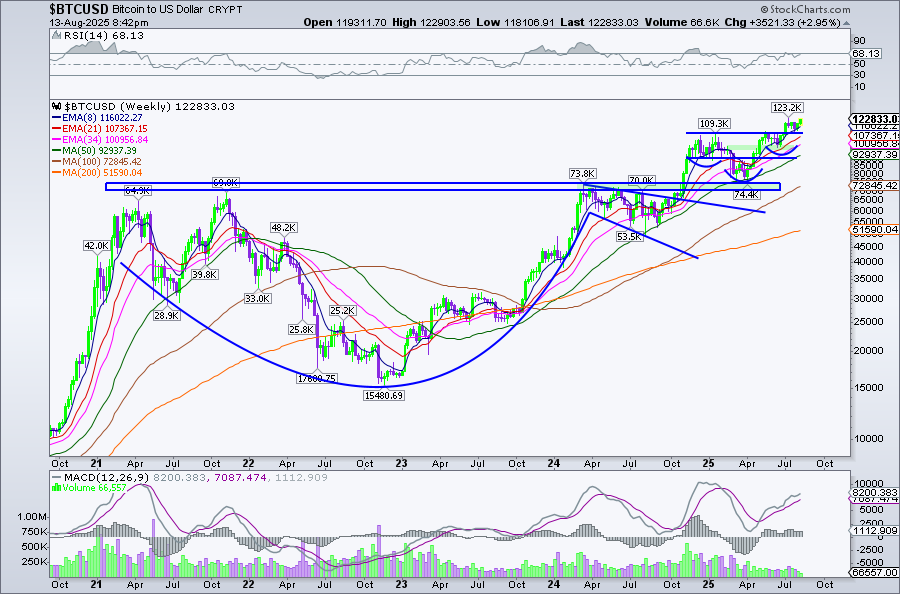
#Bitcoin is nearing the upper boundary of a right-angled broadening pattern formation.
A daily close above $123,220 would confirm the breakout, set a new all-time high, and continue the measured move from its earlier Head & Shoulders continuation pattern. Based on that structure, the projected target remains $144,200 in the weeks ahead.
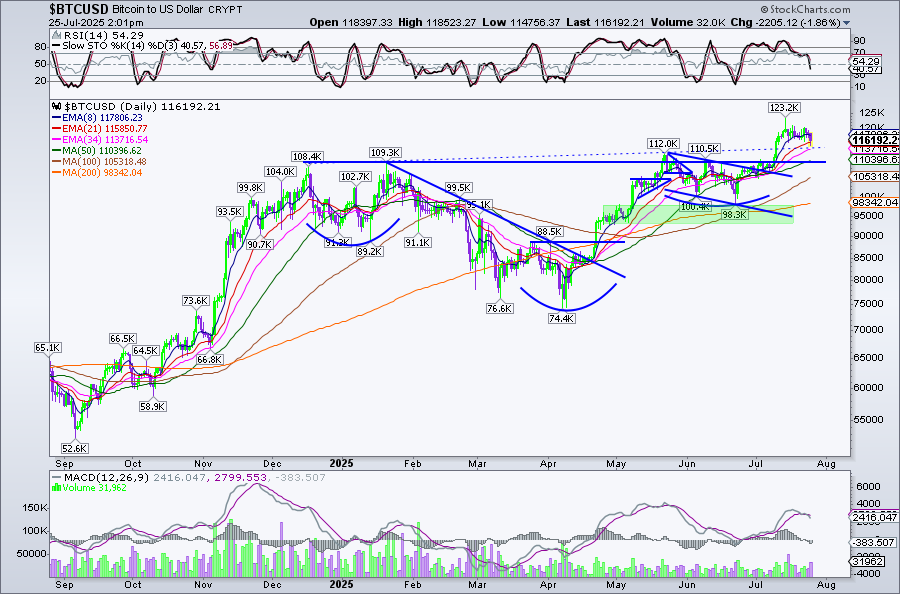
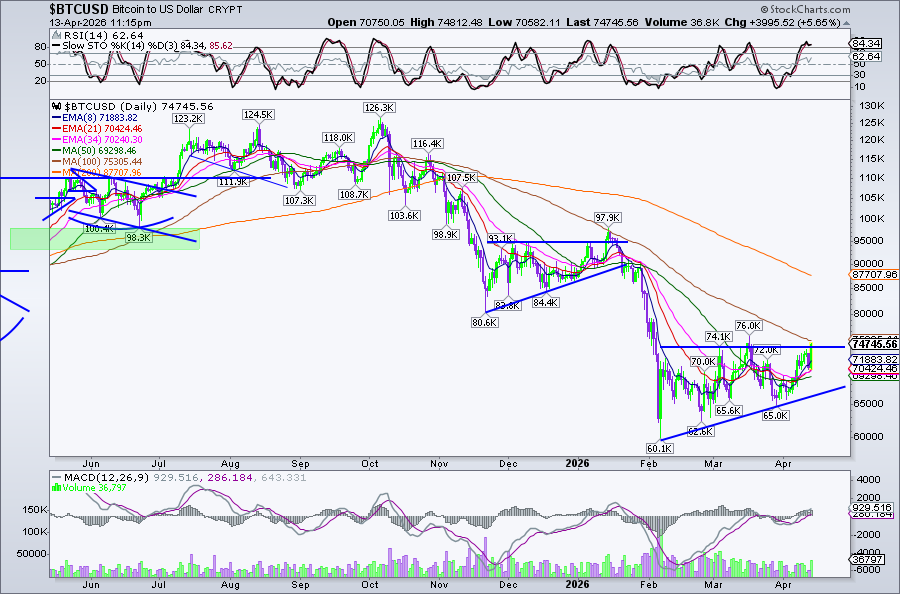
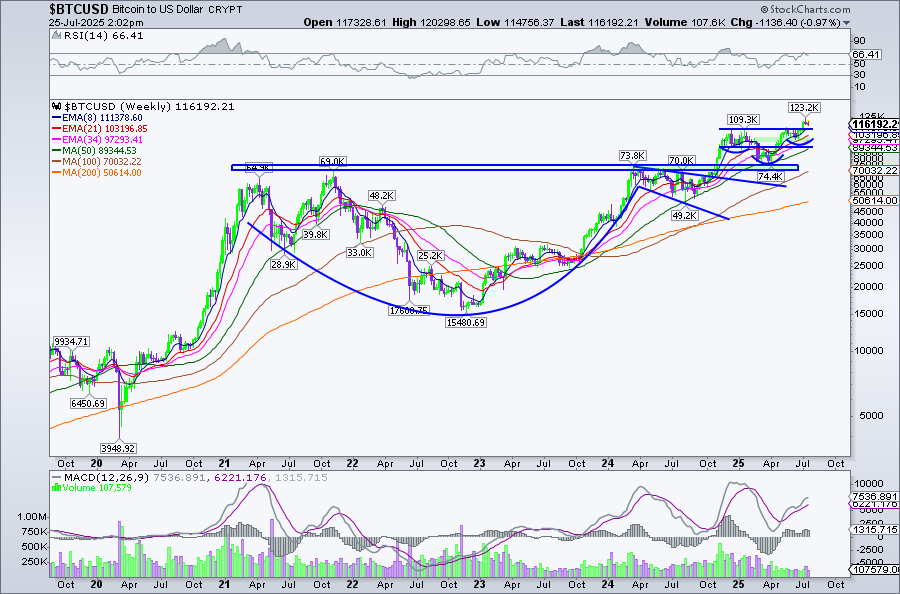
#Bitcoin is executing a healthy throw-back after completing a Head & Shoulders continuation on both the daily and weekly timeframes.
📉 Price is pulling back to retest the rising neckline, with $114K now acting as support — a key confirmation that former resistance has flipped.
Adding confluence, we have rising EMA support at:
• 21EMA: $115.8K
• 34EMA: $113.7K
As long as this zone holds, the structure remains intact — and buyers have every reason to remain confident in a continued trend of higher highs.
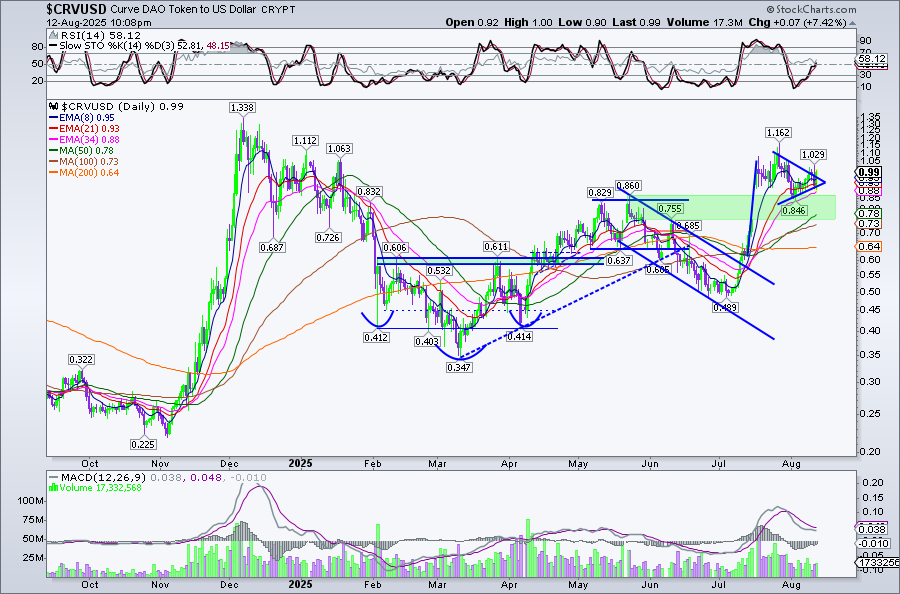
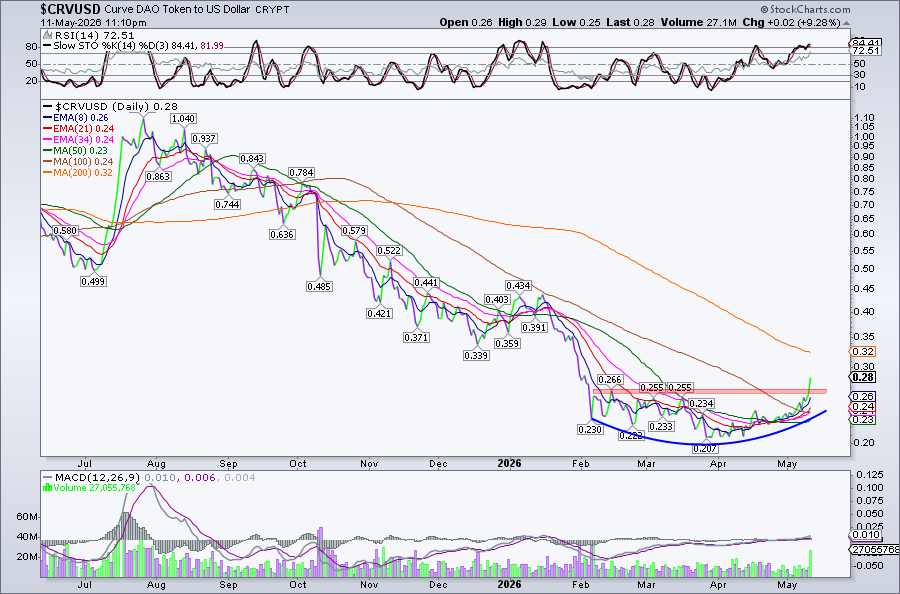
$CRV has been coiling and consolidating since its late-July highs, forming a bullish pennant pattern as the upper and lower boundaries converge.
Price is now breaking out near the apex of this formation — a clear break above the top boundary could trigger the next leg higher.
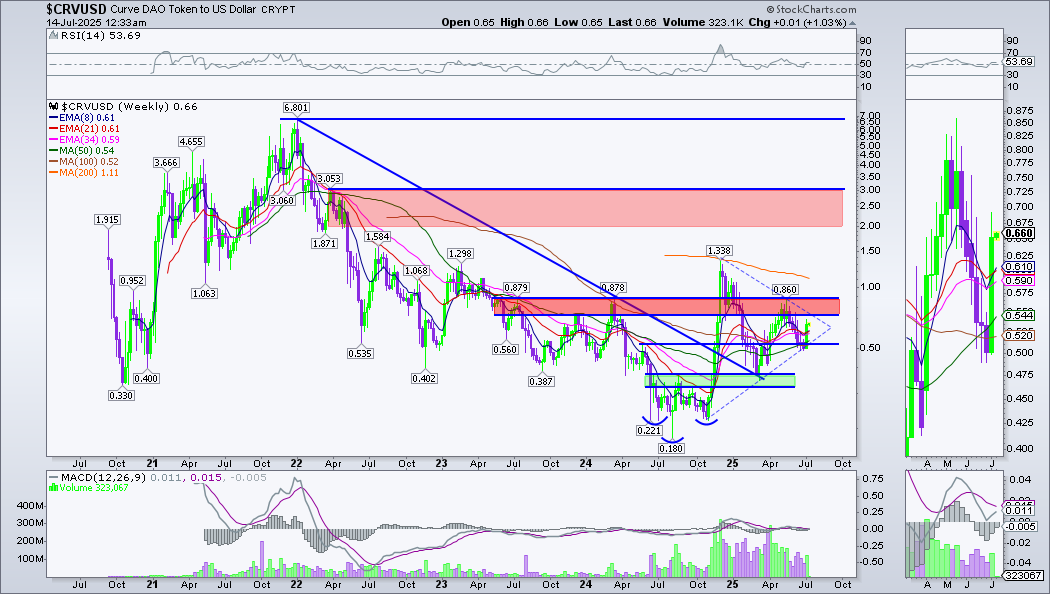
$CRV locks in its breakout—completing the multi-week Descending Channel and reclaiming the 200MA, a key trend filter I watch for bullish confirmation.
While some are questioning if we’ll retest the $0.50 zone, this breakout targets the next resistance band between $0.755 – $0.86 (prior lower highs).
A decisive break through that supply zone would open the path toward $1.34.
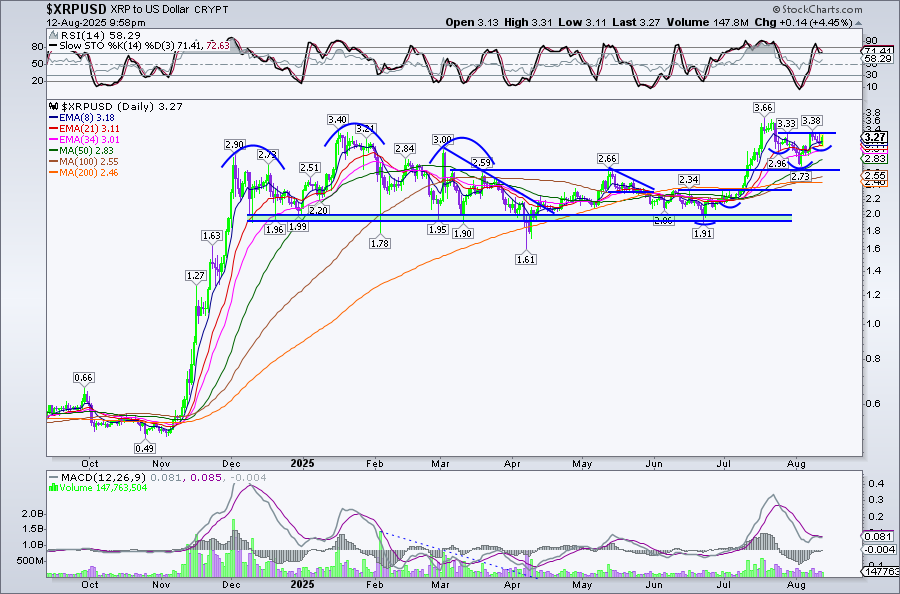
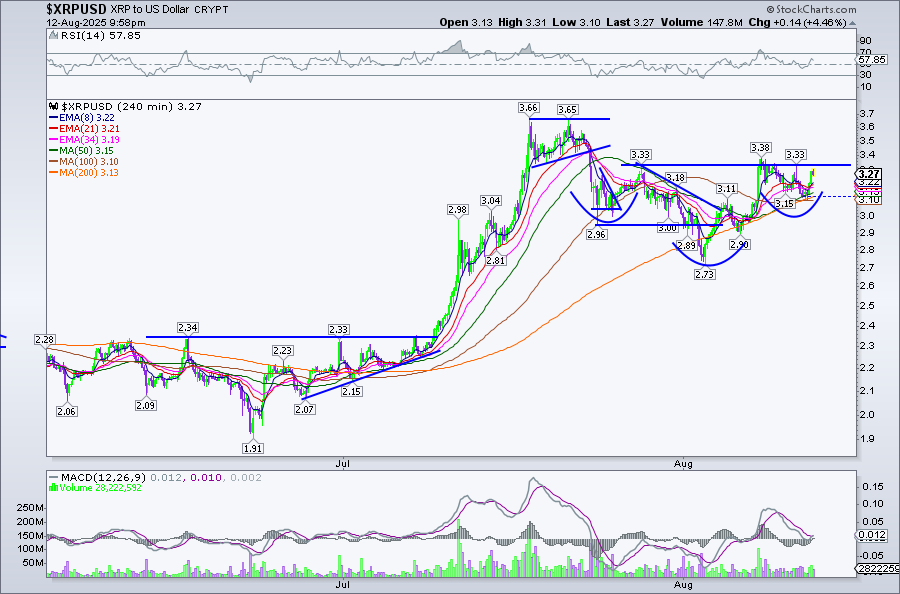
$XRP is forming a short-term H&S bottom reversal pattern on both the daily and 4-hour timeframes.
The key level to watch is the horizontal neckline at 3.33, where supply sits. A breakout above this zone would open the door for a retest of the prior all-time high — and potentially price discovery beyond.
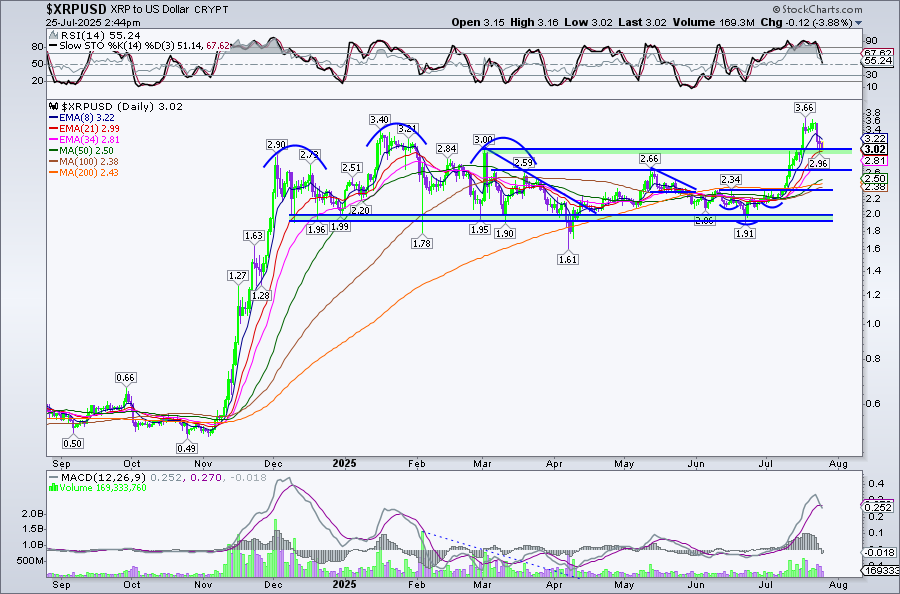
$XRP is testing a key level of support — the prior lower high at $3, now acting as a potential new demand zone.
This level also aligns with rising daily 21EMA support ($2.99), adding confluence to the area. If we can consolidate and hold here, it strengthens the bullish outlook.
📉 Should this level break, the next major support sits at $2.66 — a key buy-the-pullback opportunity for long-term positioning.
$SOL has spent the last 16 months forming a Head & Shoulders Top pattern with a neckline at $110 and a right shoulder building since April.
Instead of breaking down, price held firm at the neckline, and the structure is now positioned to flip bullish upon confirmation.
A weekly close above the right shoulder at $188 completes a Head & Shoulders Top Failure pattern, invalidating the bearish setup and opening the door for a measured move toward $373.
With this level cleared, $SOL would be eyeing all-time highs and potential price discovery in the weeks ahead.
$SOL has been forming a 16-month Head & Shoulders Top pattern with a neckline at $110. Since April, price has been building the right shoulder while holding key support at the neckline. Now, the structure appears to be morphing into a Head & Shoulders Top Failure. A weekly close above the right shoulder at $188 would confirm the failure pattern — setting a measured move toward $373, pushing $SOL into all-time highs and price discovery.
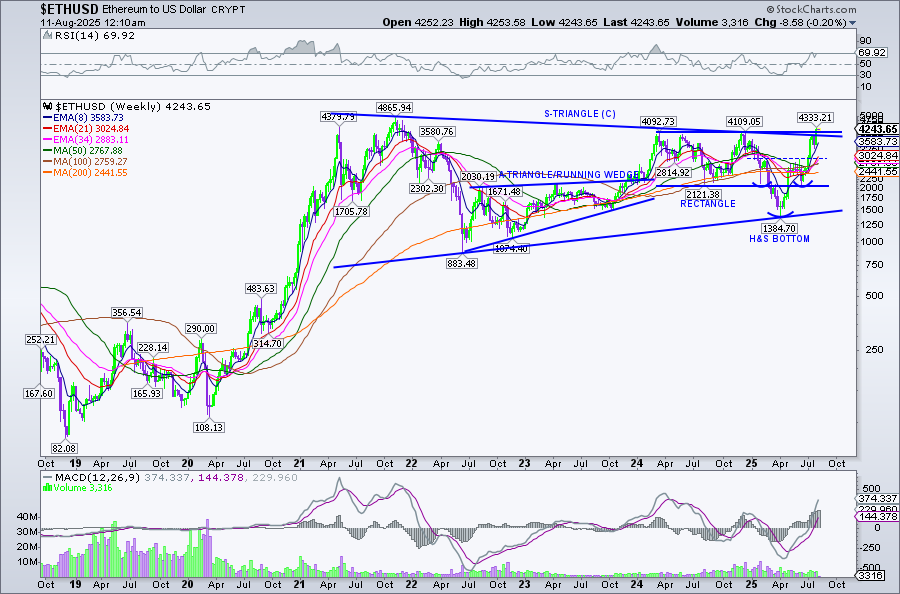
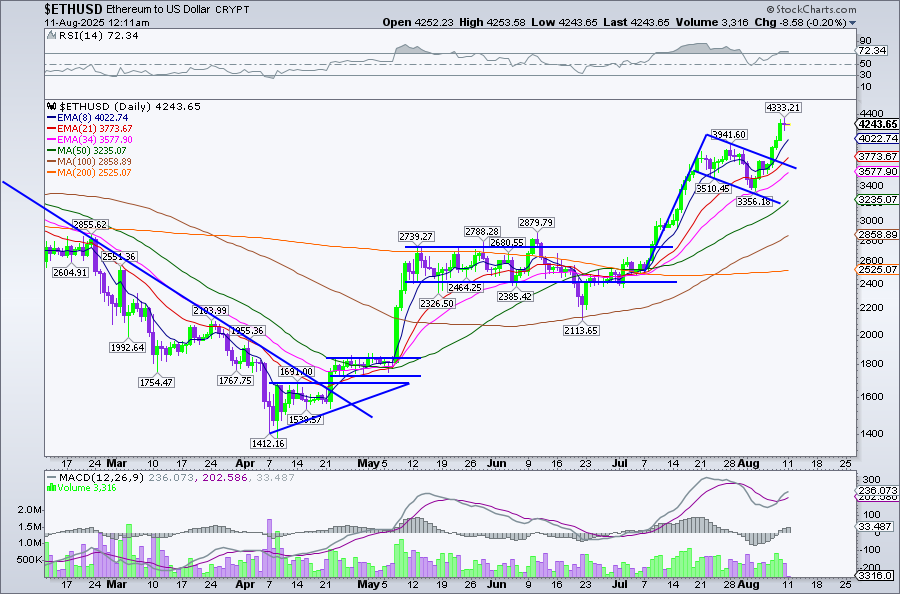
#Ethereum breaks out and completes a multi-year Symmetrical Triangle.
A Bull Flag formed just beneath the top boundary, acting as a smaller launch pattern into the larger breakout.
This week’s close above $4,110 confirms the move and sets a measured objective toward $8,092.
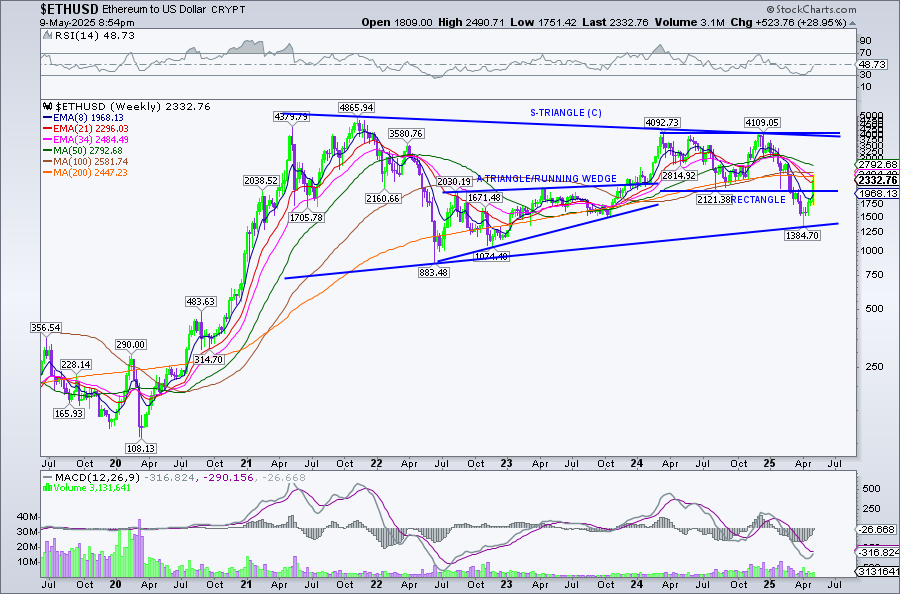
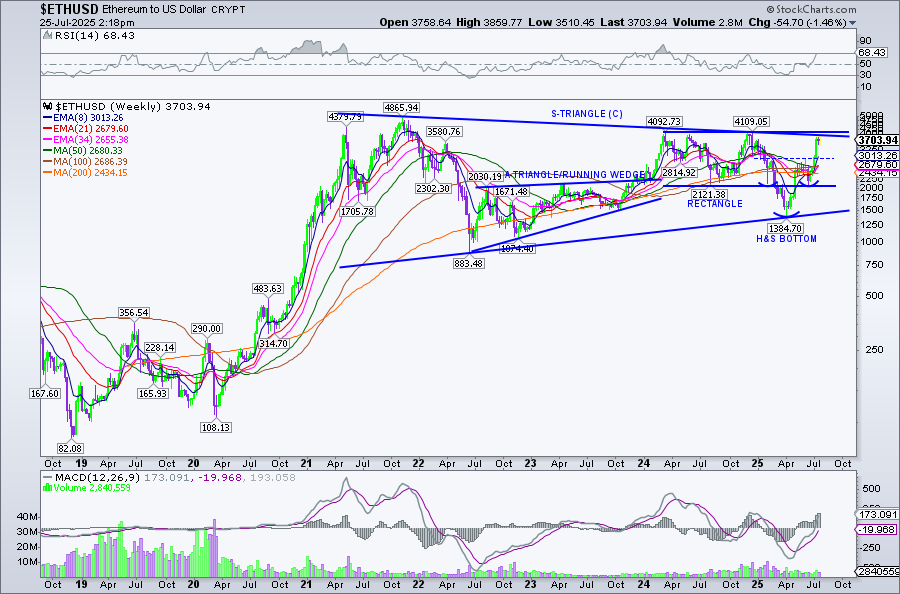
Over the past few weeks, $ETH has formed a higher low on the weekly chart—establishing the lower boundary of a multi-year Symmetrical Triangle continuation pattern.
This past week, price cleared resistance at both the 8EMA and 21EMA, as well as the underside of a previously broken Rectangle pattern. That reclaimed level—$2,121—was a major resistance and now serves as a potential throw-back zone. A higher low here would further support a reversal.
Key Levels to Watch:
➡ $2,121 – potential throw-back support and higher low.
➡ $4,110 – a weekly close above confirms breakout from the Symmetrical Triangle
Measured Move Objective:
➡ Upon weekly confirmation, the structure projects a potential move toward $8,092—supported by the size and duration of the formation.
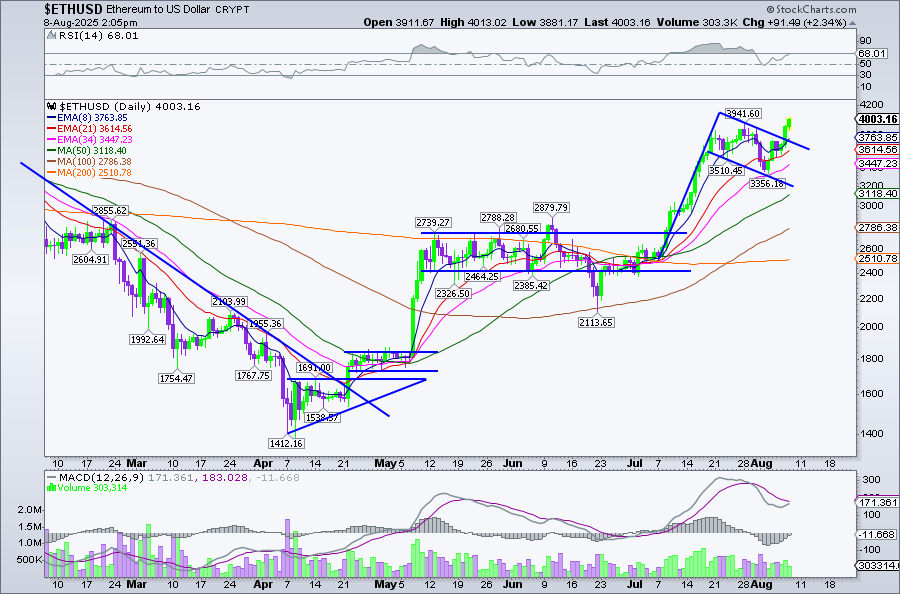
#Ethereum eyeing continuation as it breaks out of a Bull Flag and prints a higher high.
This flag has formed just beneath the top boundary of a multi-year Symmetrical Triangle. This breakout could serve as the launchpad for a higher timeframe move.
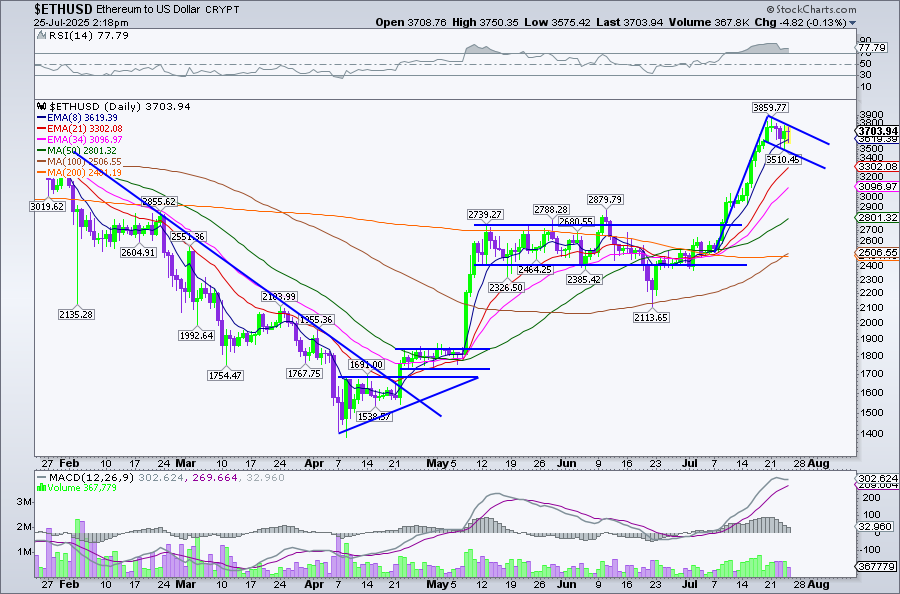
#ETH is setting the stage for a major move.
✅ On the weekly, #Ethereum recently completed a Head & Shoulders Bottom
✅ On the daily, price action is forming a textbook Bull Flag
This flag sits just below the top boundary of a multi-year Symmetrical Triangle — a breakout here could act as a launchpad for the higher timeframe continuation.
Key Level to Watch:
➡ $4,110 — A weekly close above confirms the Symmetrical Triangle breakout.
Measured Move Objective:
➡ Targeting $8,092 — based on the size and duration of the formation.
Confirmation could unlock the next major leg up.