Today's Chart of the Day was shared by @granthawkridge
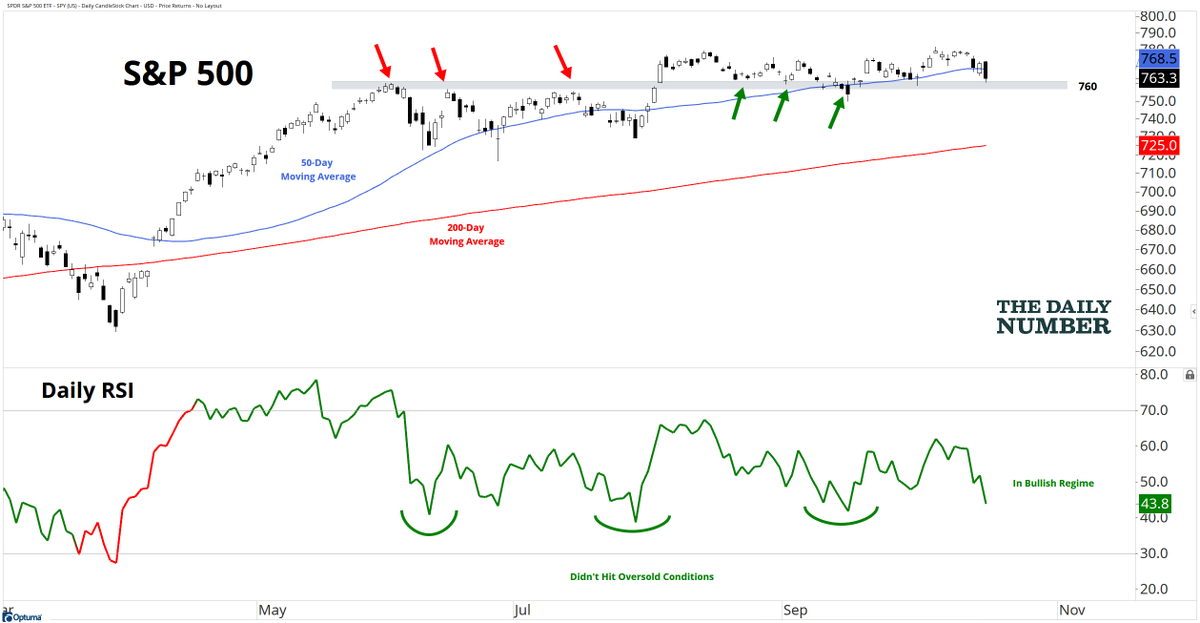
$760 has acted as a powerful polarity level since the summer, first serving as resistance and more recently as support.
As a result, $760 remains a critical line in the sand for the S&P 500.
Get the full details in today's report plus more great charts. ⬇️
https://t.co/biLLTsM2Xk
760 is the key level I’m watching on $SPY
It capped earlier rallies, then became support. Above 760, the bulls keep the benefit of the doubt. Lose it, and the case for a deeper pullback grows.
A failed breakout in FANG+.... $FNGS pushed to new highs, then gave back the move and slipped below its prior breakout area. That puts some of the market’s biggest growth names under pressure.
My Bellwether Stock Index is stuck in a range. The longer-term uptrend remains intact, but the latest rally stalled near the top of that range. Now it’s back near the lower end. I’m watching whether buyers defend support here.
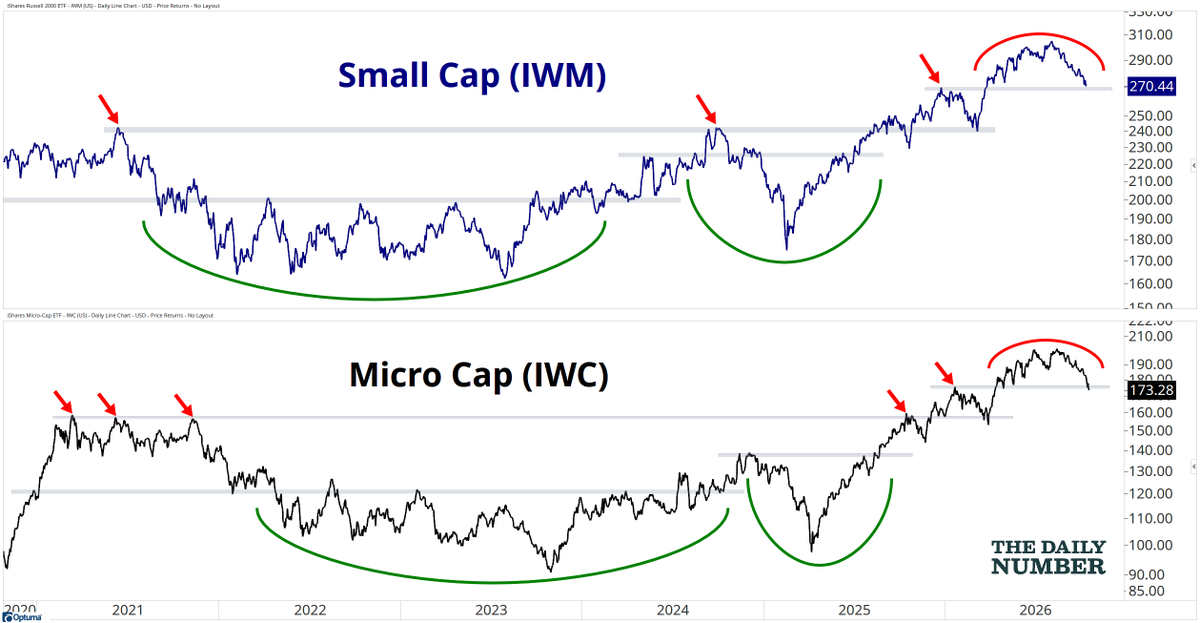
Further out on the risk curve, traders are taking money off the table. Small caps ($IWM) and microcaps ($IWC) have both rolled over and are testing their prior breakout areas. This is where I want to see buyers step back in. So far, sellers have control.
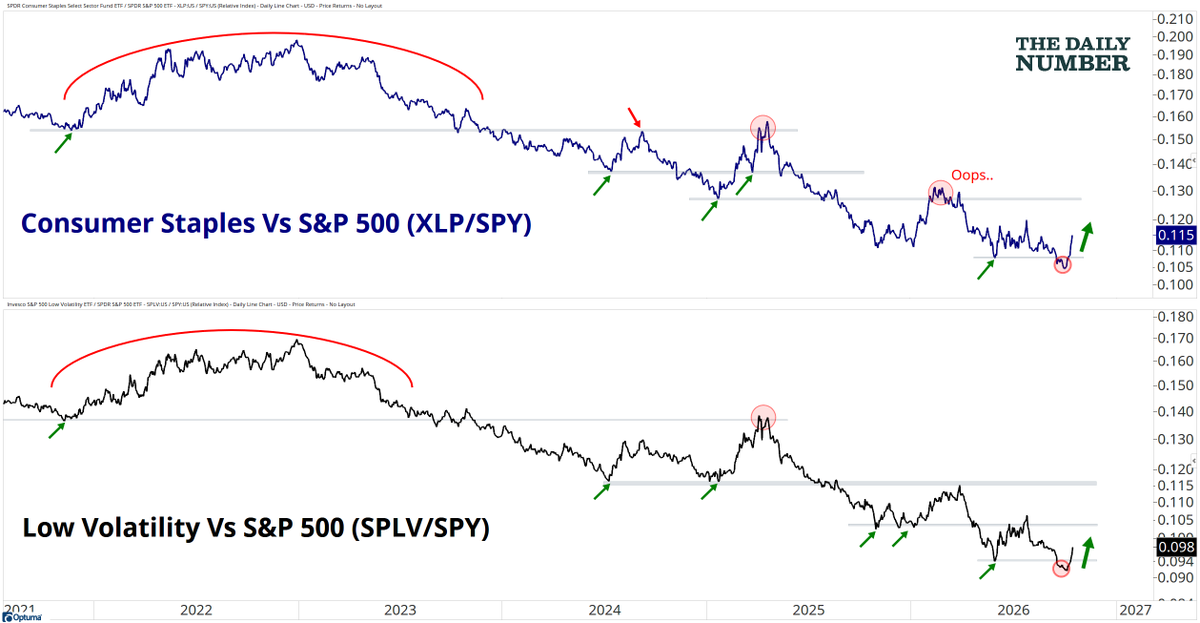
Defensive areas are starting to fight back.
Consumer Staples and Low Volatility stocks are both gaining ground against the S&P 500 after undercutting their prior lows. Both remain in longer-term relative downtrends. So.... I’m watching whether this bounce has legs.
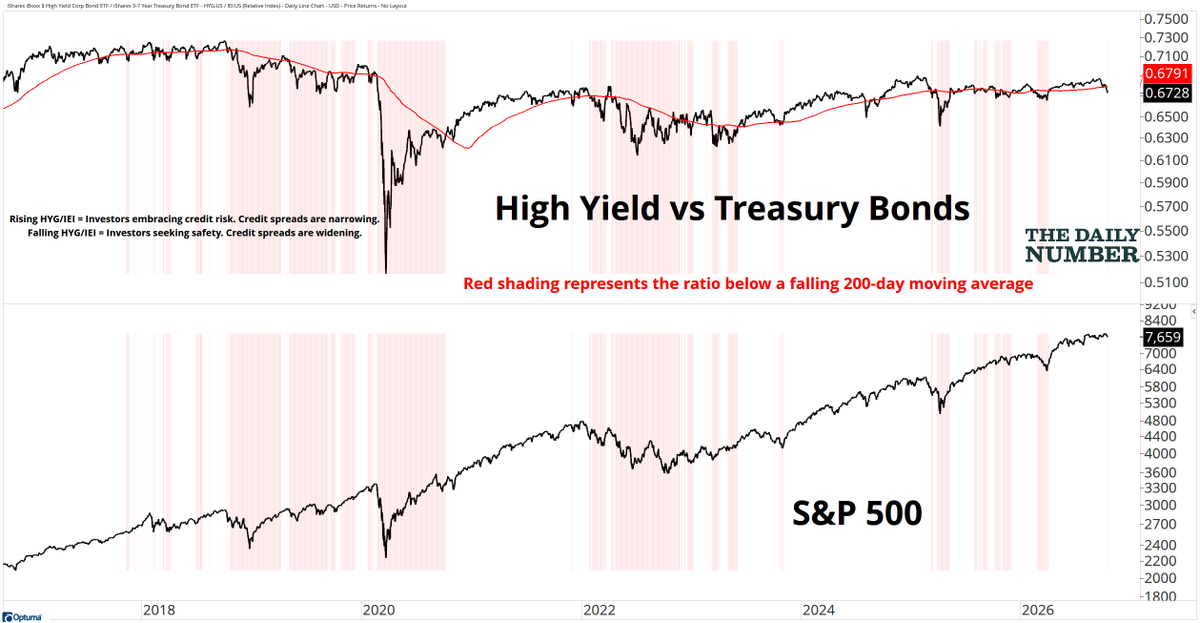
🔴 The first red signal on my Bear Market Checklist since April 2026.
Credit Markets has turned bearish, taking the count to 1 of 6.
The other five signals remain clear, and the primary trend is still bullish. An early warning worth watching, with the checklist still well short of a bear market.
If you didn’t know, I write a free email called The Daily Number.
One number. One chart. A closer look at what’s happening beneath the S&P 500.
Every Monday, you also get my Bull Market Checklist. Eight signals. How many are still bullish?
Get it here: https://t.co/OTFqEYprY4