Top in week 6 ✅
1 week dump ✅
Final flush out ⌛️
Pump to 94k to 99k+⌛️
To be honest, I expect 100k+. 🐂
Are you ready for the heavy short squeeze?
Be prepared for higher Bitcoin prices!
There is NO time left to be bearish. 🐻
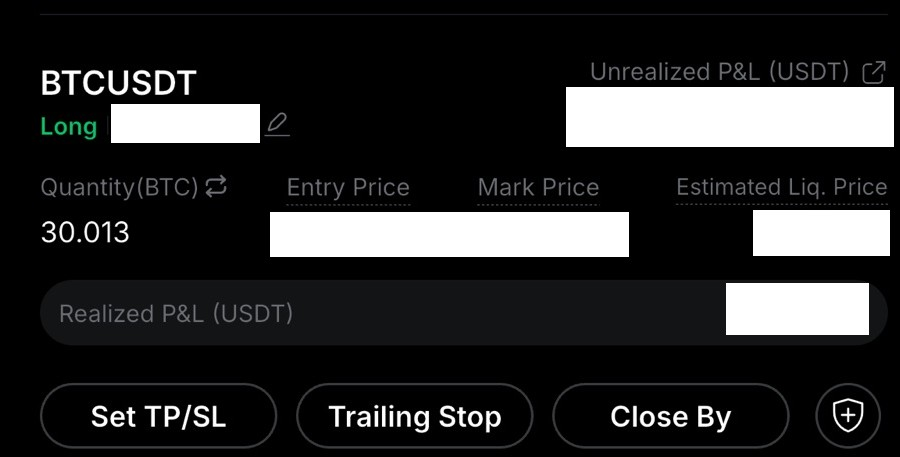
I shorted the top and closed at the local bottom and opened a big swing long position.
I’m entering this trade with the mindset that it might be in drawdown for a maximum of 3–4 days, though I highly doubt that, since that wick will get bought up faster than fake Dubai chocolate.
I expect the $77,000 to $78,000 range to hold if we get a dump.
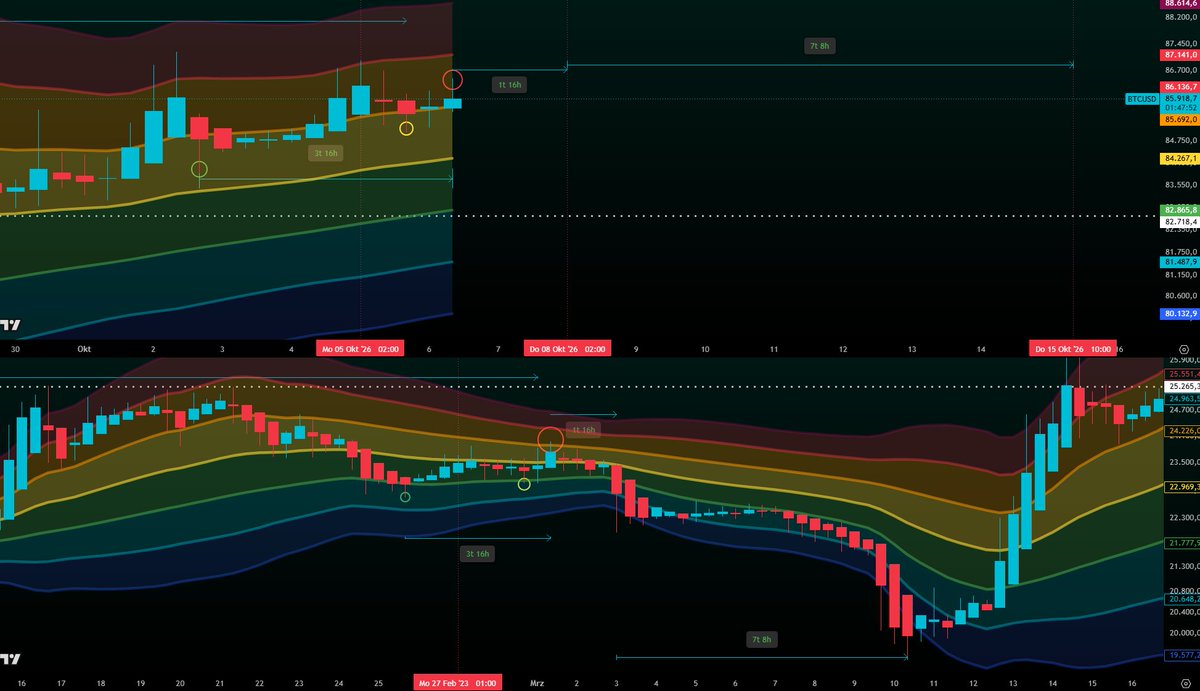
Bitcoin followed the pattern perfectly so far.
I’m not betting on it, that the final flush will happen, but if it happens, I’ll take the opportunity.
This is the last chance to enter at cheaper prices before we go to heaven.
Be prepared and not sidelined.
100% hit rate 🎯
use your chance and join XAPA's WORLD
https://t.co/6atyr1dSg7
bitcoin:native
#ShortTermSaturday - Episode 3 (10/10/26)
✒️My dear followers,
I hope you have had wonderful week this far in life and at the digital Frontier in the $BTC trenches. Well, I must admit, it all worked out the way I anticipated it to be. Let's see what Sheriff's crystal ball has prepared for this weekend, shall we?🔮
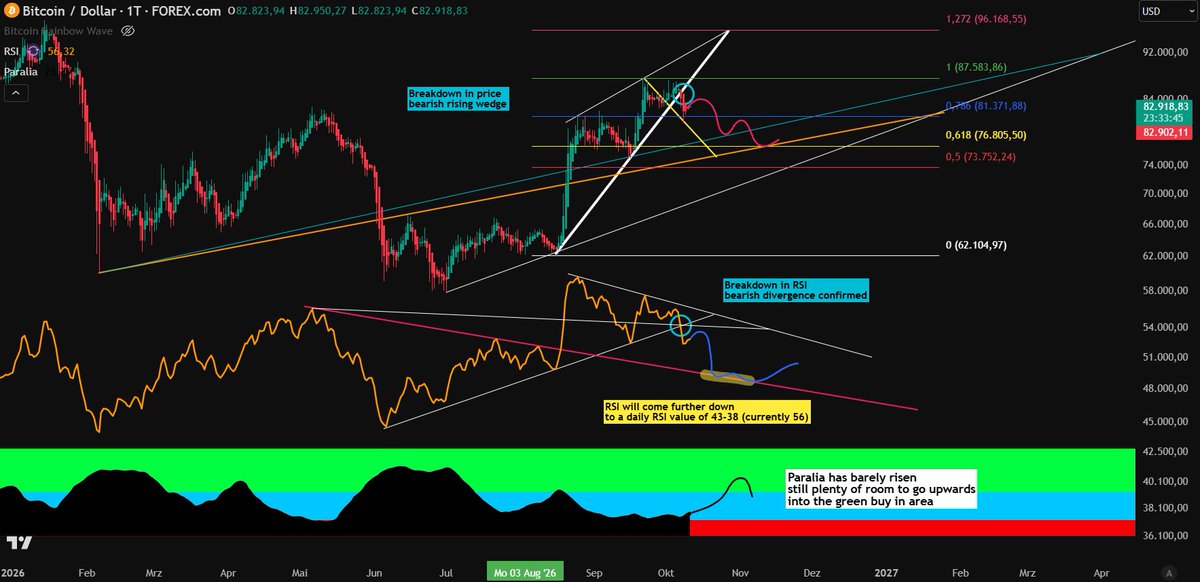
1) Starting in the daily timeframe, we can clearly see that the bearish divergence has played out perfectly. We broke through the white rising wedge bottom line and found support at .786 fib as a first impulse wave. Daily speaking, Paralia has barely moved so there is plenty of room for Paralia to go upwards, thus, plenty of room for $BTC to even further correct to the downside. RSI has reached a modest fair but still momentum-like median level of 56 which might be coming down to a 44-38 cluster in RSI value.🧮
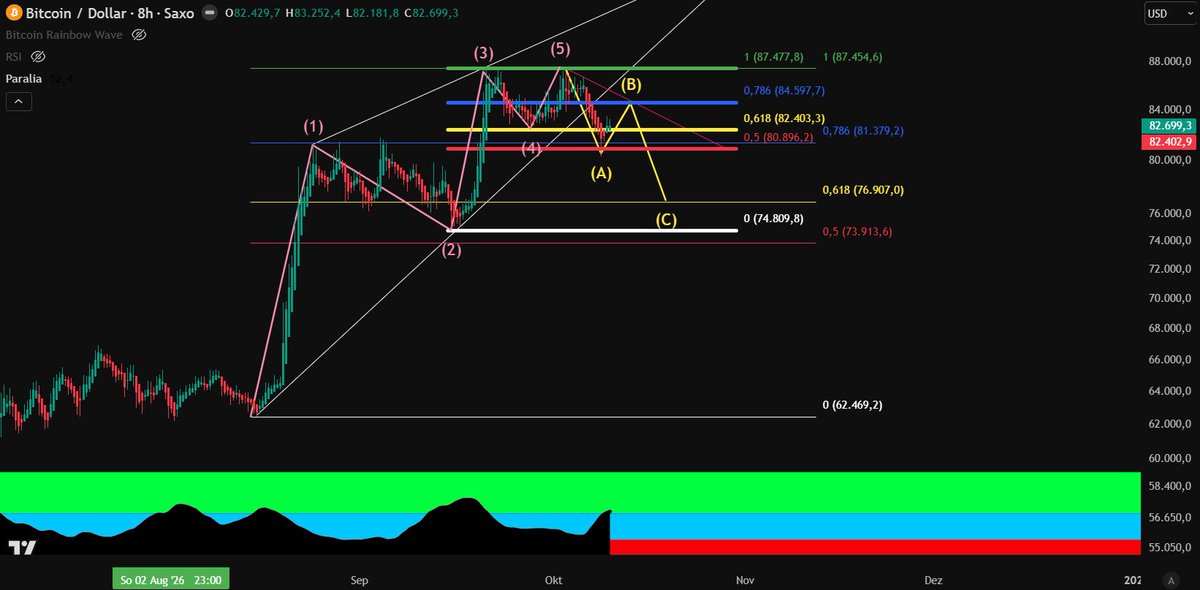
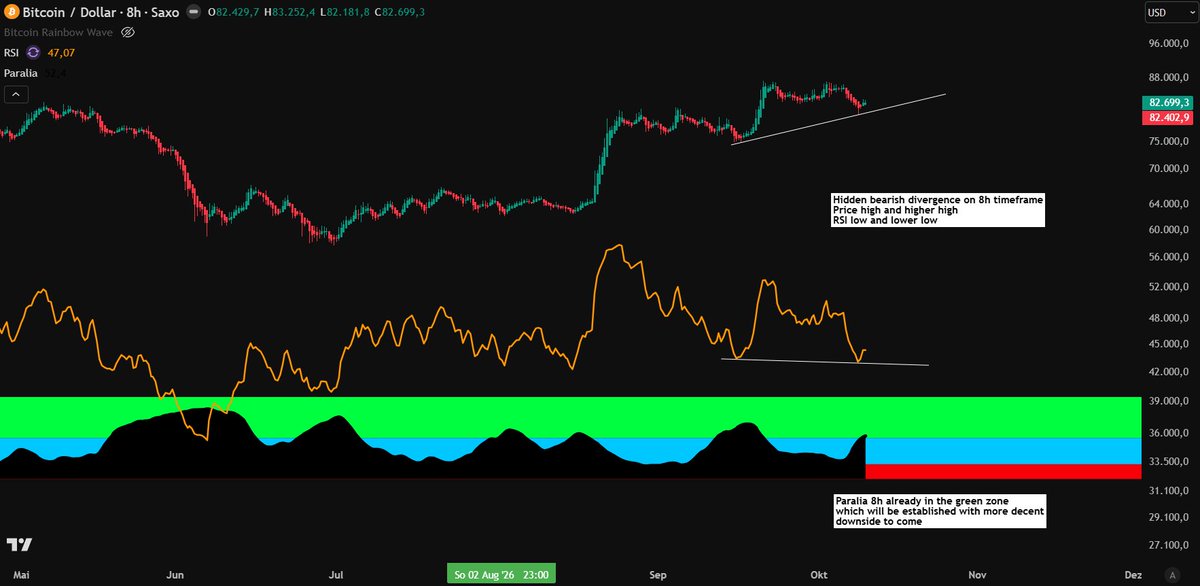
2) Zooming into the 8h timeframe, we can observe a small but meaningful hidden bearish divergence: Price has made a higher high while RSI has made a lower low (super slightly but it counts imo). Textbook-wise, there must be one final lower low in price for $BTC, a final flushout so to say which to me, the $77k cluster is the perfect spot to form it.📉
3) Fib-levels in price underline my thesis: We might see an $84k-$84.6k lower high (trendline coming down from the top of the breakdown) and when everyone seems convinced enough we were through the worst, a final flushout might be happening, finding its low in the $77k area as a sweet spot. This whole move would correspond with a textbook A-B-C Elliott Wave corrective pattern that will continue as a bullish pullback finding a higher low in the macro perspective. At $77k, we find strong fib support (.618) AND we also find a solid rising trendline coming from former resistance and support behavior.⚠️
Let's see how it will play out. Next week might already be final flushout time, at latest, end of October. 🎲
Enjoy your weekend and stay tuned for fresh weekly data next #MomentumMonday
Cheers!
Sheriff🤠
Nailed 🔨
I expected a test of the $2,500 area first, but it seems that this area is not a support level, but rather the next resistance level.
Lose that zone and the green cluster is my area for next long entries, between $,2300/$2,200.
I bought spot today because I do not care about the price when it comes to spot buys.
Ethereum is on the verge of a historic turning point. After 2028 and 2029, the area below $3,000 will be history, a price we’ll only see in old charts and old memories.
The time when we could still call Ethereum cheap” is coming to an end.
Next week, the pattern could repeat itself 1:1.
If that happens, a radical, final flush awaits us.
One last brutal sell-off that will scare many and wash the weak out of the market.
This is exactly the moment patient traders have been waiting for.
This will be our last chance to buy Ethereum in this price range.
After that, a new era begins, one in which the entry will be significantly more expensive and the opportunity to meaningfully change our lives will be gone.
Not with leverage, not with fear, not with the next trade on your mind.
But with the calm of those who understand that the real theater is ending and the real profits come after.
Use this week!
Not because anyone is forcing you to, but because you don’t want to look back later and say, I knew it and still hesitated.
ethereum:native
After I said Bitcoin would see the $80,000–$82,000 area and that the current low would hold, we are back at $82,500.
I expect Bitcoin to do what it did last bullrun after a 16-hour dump, a short sideways phase where it builds liquidity.
As I already said, I expect a small pump before the final flush next week. (maybe 4%, maybe 5% pump before)
Over the next few days the newly arrived bulls will get euphoric.
Then next week comes the next drop, a final flush.
That’s the pattern, and it fits the current situation perfectly.
Those same new bulls will turn bearish again.
It is already starting with the big accounts, watch for it.
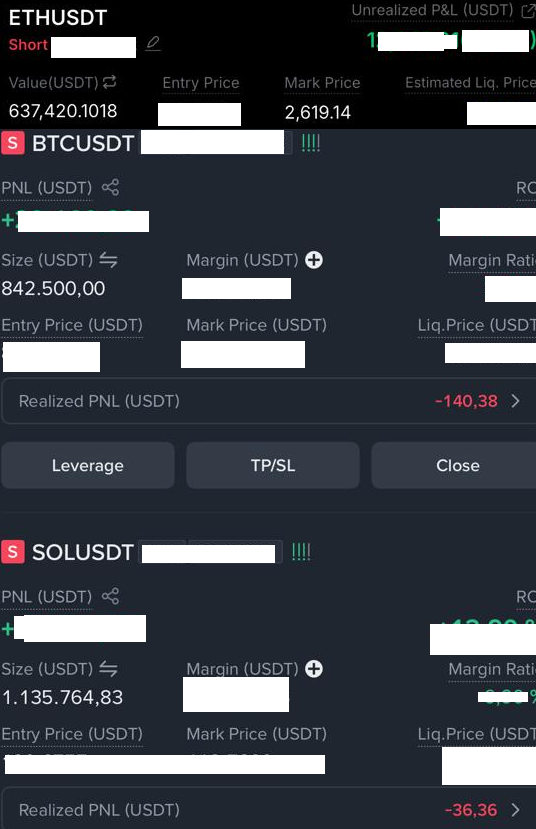
I am bullish, i opened a big swing long position at yesterday's low's for ETH and Bitcoin. 🎲
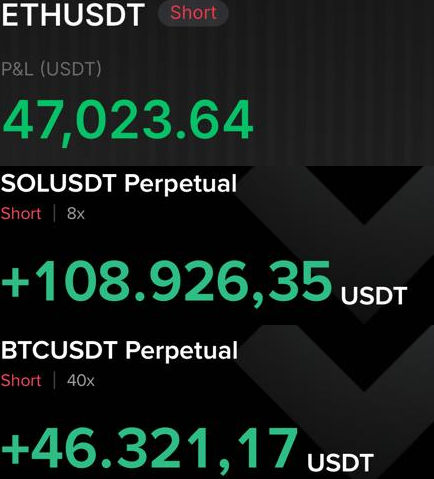
Closed my shorts for a $200k profit. Just a quick scalp.
Yesterday evening I said in Discord I’d exit all my shorts.
Do not miss any live updates and join XAPA's World.
https://t.co/6atyr1dSg7
bitcoin:native
You gave the perfect call at exactly the right time, strong and accurate.
This is the genius behind every indicator i am using.
He’s my partner, a friend, and I value him deeply.
Please follow him, it would mean a lot to me.
@thebtcfrontierX
Nailed 🔨
I have shown you the perfect path for Bitcoin for months.
I called the local top, and I expected the first low for today.
We should see the low in week 9, next week.
What I expect now is a pump of at most 2–4%.
I expect this week’s low to hold before Bitcoin builds liquidity over the weekend and drops one last time next week, before heading toward $94,000–$99,000 in November.
It is no longer time to be bearish.
I have built my swing long and am already 33% invested.
I still expect one last correction by October 15 at the latest, which will make the newly arrived bulls feel like we are going lower.
The noise will be loud and the crowd will demand lower prices again.
That is exactly when I expect the violent short squeeze.
If that thesis holds, I expect the lowest price (and I will not bet on it) will be between $78,000 and $79,000.
After we see prices above $90,000 in November, I expect the lows we reach today and next week will not be seen again, and the upper $80,000s will become support.
Valhalla Pump is coming soon. ⌛️
bitcoin:native
🚨Literally "BREAKING" News🚨
We are right now in the middle of breaking down our macro uptrend we have been establishing since August 2026. I predicted this move back last weekend in my #ShortTermSaturday update. Make sure to check the attached post below. 👇
🍿Today, I herewith want to let you know that the trendline has been broken to the downside, even one day before my inital first "make it or break it" date which I publicly scheduled for October 8th - 10th to be happening. This implies temporary weakness in $BTC but definitely neither an end of the macro uptrend starting in June 2026 nor a lower low to be established. It's just a healthy pullback that is upon us.
Yet, my downside targets remain the same:
- $82.8k (super short term)
- $79k to $80k cluster (sweet spot at 0.786 fib)
- $73k to $75k cluster (worst case scenario around 0.618 fib)
- $71k (black swan ultra "deep" setback scenario at 0.5 fib)
Make sure to brace yourselves for further moderate downside and we will come back to it this Saturday again.🔮
Enjoy the ride, fellas!🎢
Sheriff🤠
On vacation, so keeping it short.
Bitcoin failed to form a higher high.
I expect a test of 84.4k first.
A break of that level puts 80–82k in play as the next target.
Invalidation, if Bitcoin prints a new high this week.
bitcoin:native
Goood morning, good morning here at the Bitcoin Frontier. It's a sunny day in the digital wilderness, no clouds or heavy forecasts for this week - simply golden times ahead in a broader and wider perspective for $BTC.🌞
Make sure to study my #ShortTermSaturday post for regular short term updates attached below this post.👇
For #MomentumMonday, we only observe higher time frame charts that cancel out the noise and give us a clear view for Bitcoin in reciprocity to a multi-year horizon.🌅
🎢For today's #MomentumMonday, I have prepared my four favorite charts for y'all. I hope you are as excited as I am, let's take a look at it together:
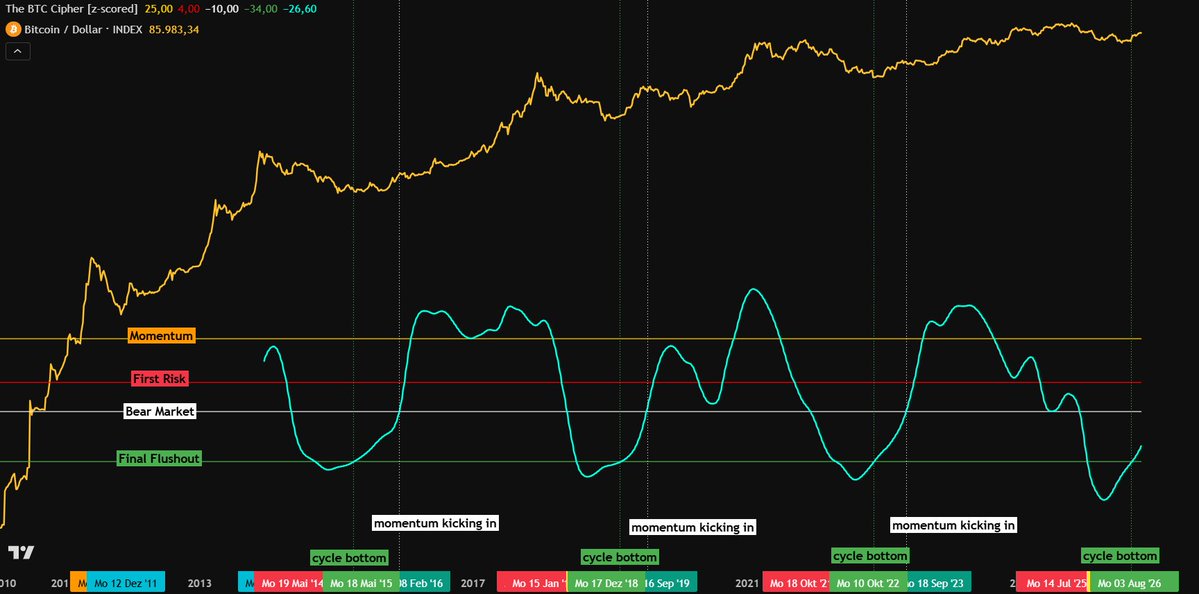
1) The Bitcoin Cipher is slinging its way even further and even more upwards, gaining a strong and steep incline. I cannot wait until we'll reach the "momentum kicking in" phase, but this will take a bit of our time.⌛️
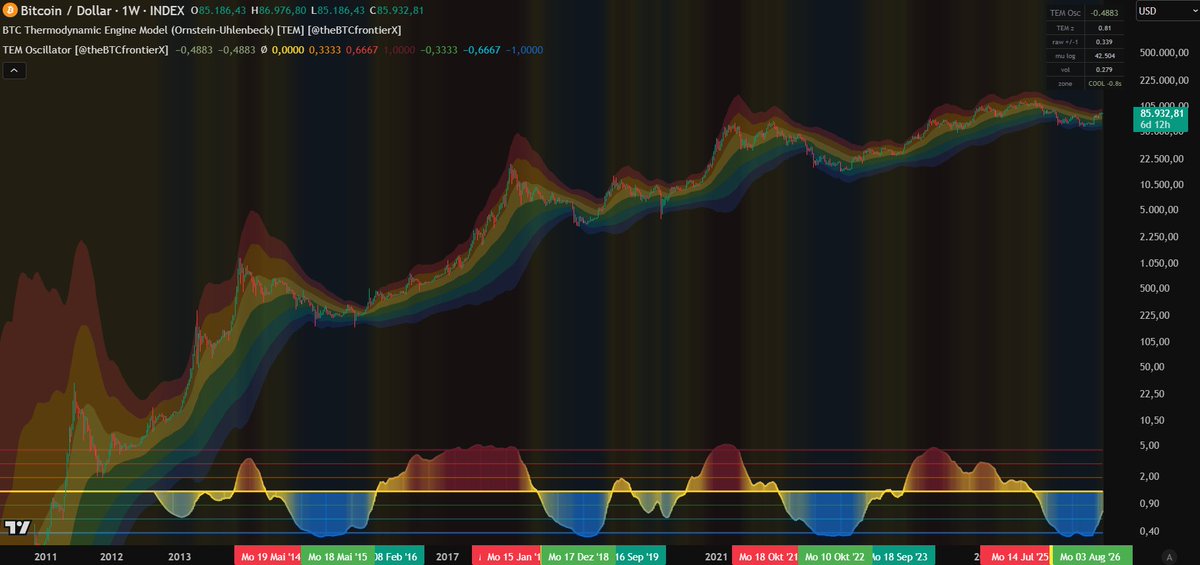
2) TEM and TEM-Oscillator is a combination masterpiece of a harmony to me. It does not repeat, it rhymes, and yet it is so predictive in each situation $BTC finds itself in. Right now we are moving upwards in TEM-O, trying to regain the yellow median line. This will be the line to watch in the next months, and be aware that it might not get there in one single burst, it will take time and there will be pullbacks, price-wise. Once we burst through it, true momentum will be kicking in, I bet it will happen reciprocally to BTC Cipher's momentum kick.🚀
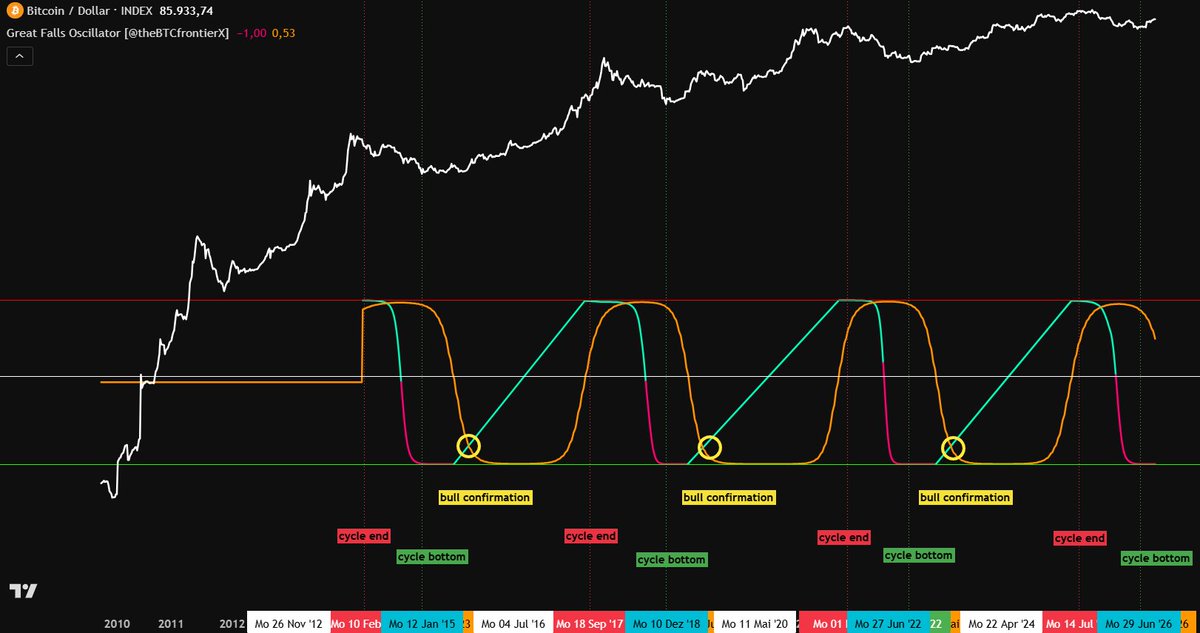
3) Great Falls Oscillator's momentum line (orange) is trending downwards even further, leaving the upper zone and slowly but gradually trying to cross over with GFO's core line. A switch from red to green in GFO-Core will also hint to a full blood bull market momentum. It might happen all at the same time.🔄
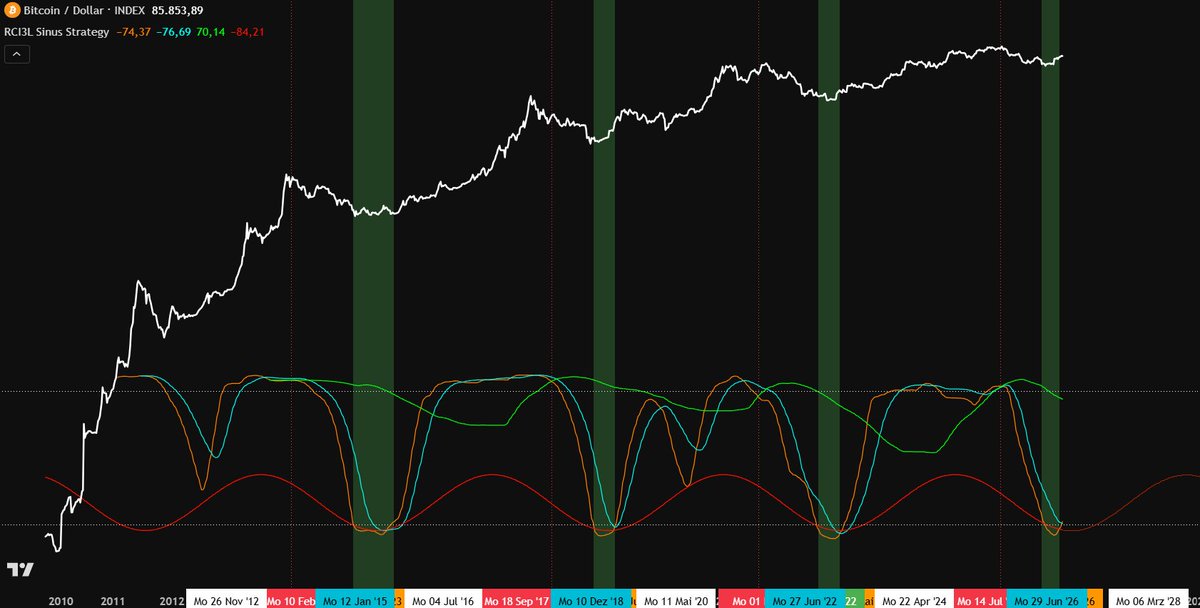
4) RCI Sinus Strategy overlays a typical RCI-3Band Strategy with a sinusodial pattern. Every time it meets with the sinus curve and parallel to that, RCI has a cross over, the bull market is being confirmed and the bear market bottom value zone will be left behind. This is happening right now in this very moment, so it's something very relevant for our analysis in $BTC going forward.🚨
Attack the week, do good, and enjoy your journey at the Bitcoin Frontier.🥊
Take care!
Sheriff🤠
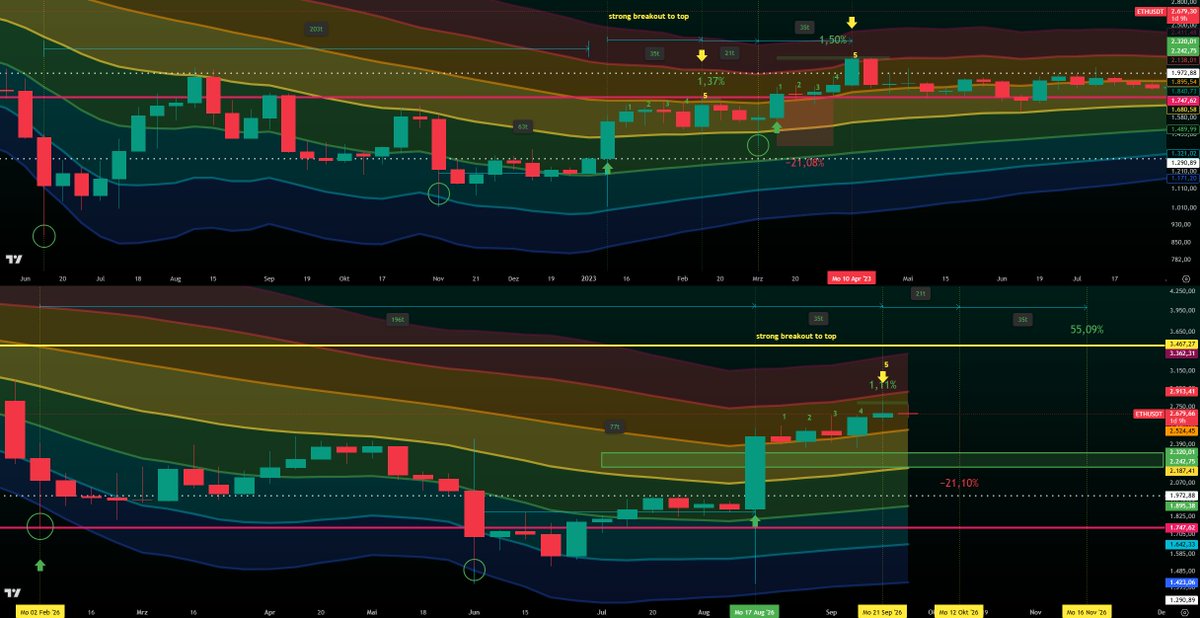
Measured from the wick outside the blue zone, 2023 needed at least 200 days to break out.
Price spent 63 days in a key accumulation phase before the big move.
Week 5 printed the high.
Week 6 only managed a lower high, about 1% below it, then sold off for two weeks.
From the wick outside the blue zone it took 196 days to the breakout.
Price spent 77 days in a key accumulation phase before the big move.
Week 5 again marked the high.
Week 6 printed a lower high, also roughly 1% below. Same sequence, same relative gap.
I expect a test of the $2,500 area first.
Week 8 is where weakness should show if this analogue holds.
Lose that zone, and the green cluster is my area for longs, between $,2300/$2,200
Targets could change, but I’ll update everything over time in our Discord. Link in bio.
ethereum:native
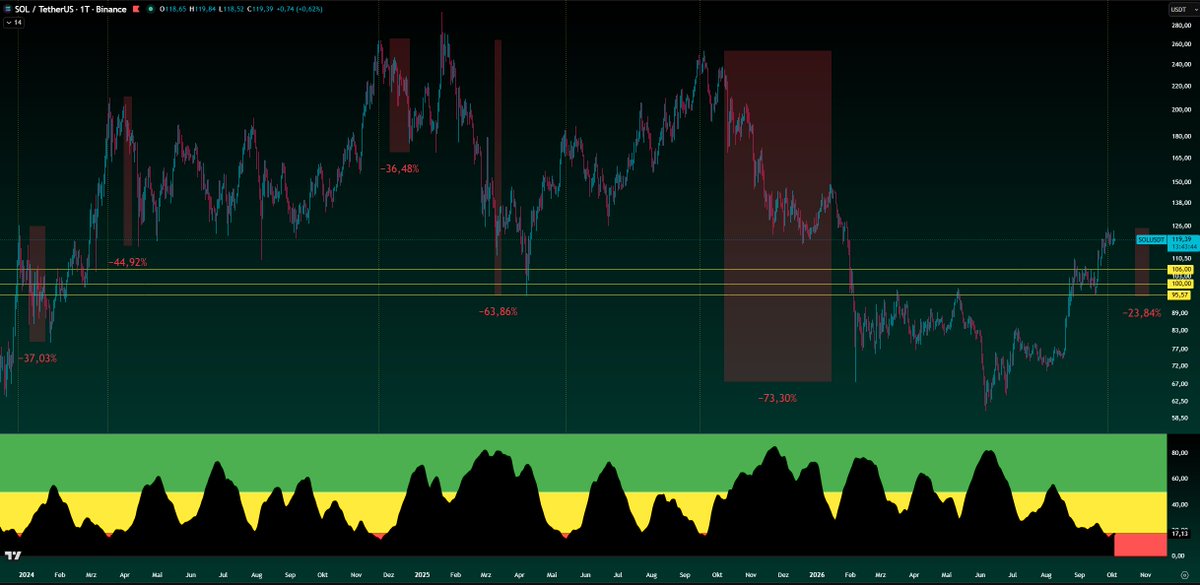
Measured from the last candle in the blue TEM zone, Solana needed 17 days back then until it first touched the yellow zone.
After that it found its last local bottom 71 days later. From the last candle in the green TEM zone it then took 39 days to the top, and that was roughly 68%.
We’re seeing the exact same setup in 2026.
Candle in the blue TEM, 21 days later the first touch of the yellow zone. After 66/69 days came the local bottom and from the last green TEM candle we’re up around 68% again.
All in all it’s 110–111 days from the last relevant TEM zone to the top.
SOL entered also the overheated zone on the higher timeframe, a rare sign that SOL is about to see a huge correction.
The second picture starts from 2023 and ends in 2026.
solana:So11111111111111111111111111111111111111112