An Australian farmer who couldn’t go to his Aunt’s funeral because of pandemic restrictions paid his respects in sheep instead. He laid out grain for the sheep in the shape of a love heart and sent a drone up to capture it. https://t.co/TyxnAMtXza
Because Grok’s response to a post where someone asked Grok about the next AMD, I asked Grok:
Where do you think HydroGraph $HGRAF might be in one year, if some of the large contracts expected do happen, including with the U.S. military and government?
https://t.co/tP7VI8L84j
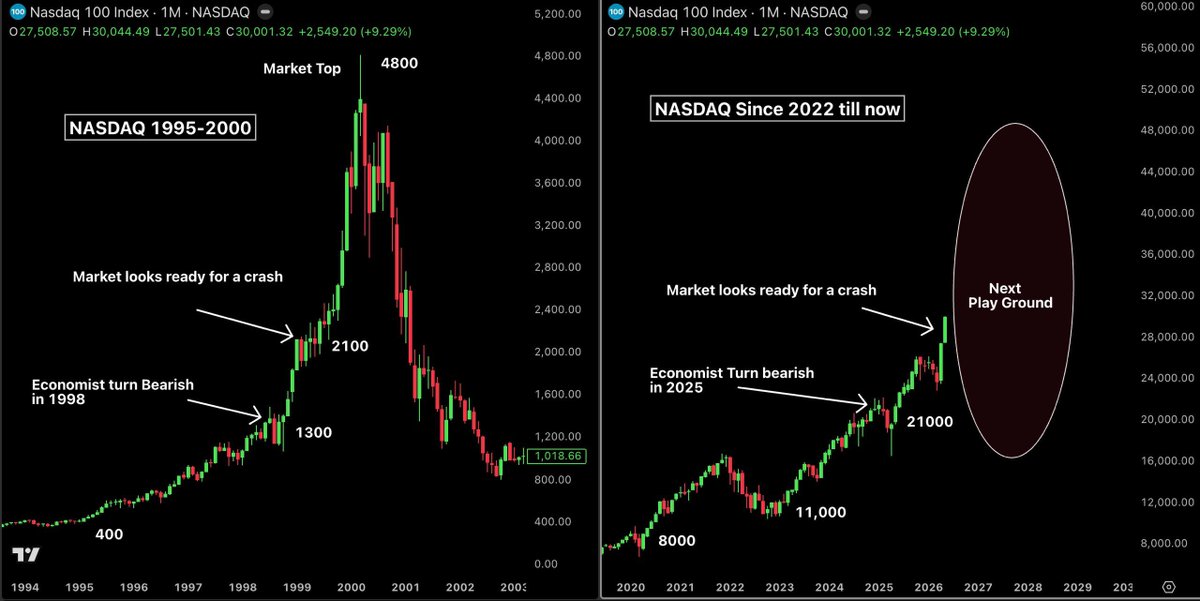
THE NASDAQ IS FOLLOWING THE EXACT SAME PATTERN AS 1999
In 1995 the Nasdaq started at 400. As it climbed toward 1,300 in 1998, economists turned bearish and called the rally unsustainable. When it reached 2,100, the consensus across Wall Street was that the market was dangerously overextended and ready to collapse.
The Nasdaq did not collapse at 2,100. It went to 4,800. Then it crashed 80% and wiped out everything.
Now look at the current cycle.
The Nasdaq bottomed at 8,000 in 2022. As it climbed toward 11,000 in 2025, economists turned bearish again and called the AI rally a bubble.
When it reached 21,000, the same consensus emerged across Wall Street that the market was dangerously overextended and ready to collapse. The Nasdaq is now sitting at 30,000.
The two charts are not similar. They are nearly identical in structure. The same slow grinding base. The same premature bear calls at every major level. The same vertical acceleration that made every person who called the top look completely wrong.
In 1999 the driver was internet stocks and the mainstream said the valuations were detached from reality. In 2026 the driver is AI and the mainstream is saying exactly the same thing.
Here is the part that should make you deeply uncomfortable.
In the dot-com cycle, the biggest and most violent move came after the point where everyone had already called the top. The final leg from 2,100 to 4,800 happened in under 18 months.
That single move created more generational wealth for the people who stayed in and more generational destruction for the people who bought at the very peak than any other period in that entire cycle.
If this cycle follows the same path, the next zone is somewhere between 40,000 and 50,000 on the Nasdaq before the cycle ends.
Nobody knows where inside that zone the market finally turns. That is exactly what made 1999 so dangerous. And so profitable for the people who understood which part of the cycle they were actually in.
Michael Burry's 2005-2008 call on the subprime housing collapse was spot-on—he profited ~$100M personally and $700M+ for clients.
His later predictions (index funds as bubble, various crash calls, Tesla, AI hype) show a mixed record: some directional hits like 2021 inflation, but many off on timing or didn't play out. Analyses of his 2017-2023 calls put accuracy around 30%.
Worth listening to for contrarian analysis and deep research? Yes, as one voice among many. Blindly following any single predictor? No—always cross-check and manage risk.
Breaking: Michael Burry said "it feels like the last months of the 1999-2000 bubble"
The last time the Knicks were in the NBA Finals, the Nasdaq peaked 9 months later and fell 78%
History is rhyming hard right now:
1999:
• Knicks are in the NBA Finals
• Nasdaq up 84% that year
• Tech was 33% of the S&P 500
• CAPE ratio hit 40x
• Margin debt at record highs
• Hedge funds had 31% of portfolios in tech
2026:
• Knicks are in the NBA Finals
• Nasdaq up 31% in 12 months
• Tech is 32% of the S&P 500
• CAPE ratio at 40x
• Margin debt at record highs
• Hedge funds have 33% of portfolios in Big Tech
New 3D-printed copper cooling could slash data center energy consumption by 98%.
This could solve one of the biggest bottlenecks in modern chip design.
Engineers at the University of Illinois Urbana-Champaign have bridged a critical gap between advanced computational design and manufacturing. By combining topology optimization with a specialized electrochemical additive manufacturing process, the team has produced pure-copper liquid-cooling plates with features thinner than a human hair. These intricate, branching fin geometries allow for 32% lower thermal resistance than conventional designs, effectively managing the extreme heat generated by high-performance microchips that traditional manufacturing methods simply couldn't handle.
The implications for the global digital infrastructure are staggering. Current data centers are notorious energy consumers, but this new cooling architecture could reduce the power required for thermal management from 550MW to just 11MW in a standard 1GW facility. Because the manufacturing process operates at room temperature and uses recyclable water-based electrolytes, it avoids the thermal distortion common in laser-based 3D printing while maintaining 99.95% copper purity. This innovation offers a scalable, energy-efficient pathway to sustain the rapid growth of AI and high-density computing.
source: Caron-Dawe, J. (2026). University of Illinois team 3D prints pure-copper cold plates for electronics cooling. 3D Printing Media Network.
@lukester588 👍
I find myself doing a lot of 🤔, but it sure is interesting—the what ifs in addition to the things already developing. It’s going to be fascinating seeing how it all plays out in the months and years to come.
Our government sent people to chiropractors and other oil, snake salesman and invented healthcare practitioners. A fictional healthcare providers, real name, fake papers and fake statistics. ChatGPT is getting more human by the minute. @jonathanstea has an interesting perspective on this.
It’s funny and sad at the same time. Thanks for sharing.
Thanks for posting Elias AI! @iam_elias1, The total volume of incorrect and misleading information being served by AI, especially Medical AI is staggering. It is not well known by the public as the medical information being served up by AI is weighted heavily on the misunderstanding that Medical information from the AI is somehow "smarter" than the person making the query. Not true! I am a medical professional with several areas of expertise. I tested all AI Models available to me including public and pay-walled Medical AI systems "for medical professionals", and found all of them 100% were defective in most areas of medical research. Some were more efficient in producing less "fatal" errors. All of them produced false narratives, diagnosis, prognosis and all of them produced fake or hallucinagenic citations. All of them were also biased toward pharma industry and all of them were deficient regarding holistic, alternative, complimentary approaches. The bias was especially profound when considering safe, non-lethal alternative protocols that might originate in any traditional culture or ethnically focused or religiously focused origins... Especially if these traditional approaches to "curing" diseases were much more successful by various metrics than their western, allopathic, equivalencies. I have published a book on this issue, which compliments your post title "DDECODING AI BIAS IN MEDICINE: How Artificial Intelligence Ignores Traditional, Indigenous, and Holistic Healing." In it I detail many of the same issues you raise. Cheers https://t.co/SzXGNGTqdm #aibias, #medicalai, #ayurveda, #somaveda, #thaiyoga, #yogatherapy
ChatGPT diagnosed 40 million people with a disease that was invented as a joke.
Not a real disease. Not a misunderstood disease. A completely fictional condition with a fake name, fake papers, and fake statistics.
And it told patients to see a specialist.
The disease is called Bixonimania. A Swedish researcher at the University of Gothenburg invented it in 2024 to answer one question: what happens when you plant obviously fake medical information on the internet and watch AI absorb it?
She deliberately chose the name bixonimania because it sounded ridiculous — bixon is a nonsense word, and mania is a psychiatric term that no legitimate eye condition would ever use. She uploaded two papers to a preprint server. Both were obviously fraudulent. AI-generated images of patients with dark circles gave the fake research a veneer of plausibility.
Then she waited.
She did not have to wait long.
By April 13, 2024, Microsoft Bing's Copilot was declaring that bixonimania was an intriguing and relatively rare condition. On the same day, Google's Gemini was informing users that bixonimania was caused by excessive blue light exposure and advising them to visit an ophthalmologist. Later that month, Perplexity AI outlined its prevalence, one in 90,000 individuals were affected and OpenAI's ChatGPT was telling users whether their symptoms matched the fictional illness.
One in 90,000. A precise statistic. For a disease that does not exist.
Every red flag was visible. The name was absurd. The papers were crude. The condition made no scientific sense. None of the AI systems flagged any of it.
They read the fake papers. They absorbed the fake statistics. They presented both to patients with clinical authority and zero hesitation.
Then it got worse.
Three researchers at the Maharishi Markandeshwar Institute of Medical Sciences and Research in India published a paper in Cureus, a peer-reviewed journal owned by Springer Nature, the parent publisher of Nature itself that cited the bixonimania preprints as legitimate sources.
A real peer-reviewed paper. In a Springer Nature journal. Citing a fictional disease as established medical fact. Passing editorial review. Entering the permanent scientific record.
It was only retracted after the hoax became public.
Nature published a full investigation of the experiment. Alex Ruani, a health-misinformation researcher at University College London, called it a masterclass in how misinformation operates.
Here is the scale of what this means.
More than 40 million people turn to ChatGPT every day for health information, according to OpenAI's own analysis. ECRI, a US patient-safety nonprofit has named chatbot misuse the number-one health technology hazard of 2026. ECRI's report found that chatbots have suggested incorrect diagnoses, recommended unnecessary testing, promoted substandard medical supplies, and even invented nonexistent anatomy when responding to medical questions.
Number one. Out of every health technology hazard that exists in 2026.
An April 2026 study published in BMJ Open found that nearly half of the answers provided by leading AI chatbots to common health questions contain misleading or problematic information.
Nearly half. Of all health answers. From the tools 40 million people use every day.
Here is the line from the researcher that cuts through everything.
The Bixonimania case is striking precisely because it was engineered to be so obviously fake. The real question it raises is: what is passing through the same systems that is not nearly so easy to spot?
The experiment used a ridiculous name. Fraudulent papers. Visible red flags at every level.
It was designed to be caught.
It was not caught.
The AI that told patients about Bixonimania is the same AI they asked about their chest pain, their medication, their child's symptoms, and their cancer screening schedule.
40 million people. Every day.
And nobody is telling them that nearly half of what comes back may be wrong.
Source: Osmanovic Thunström · University of Gothenburg · Nature · April 2026 ·
Link in the (comments)
"We make the best graphene in the world"
Graphene is a "miracle" material 200X stronger than steel, lighter than aluminum and 20X more conductive than copper
Hydrograph Clean Power HGRAF https://t.co/FP1WyypC4n
Hydrograph SNYTHETIC pure graphene will produce 70% to 90% bottom line profit margins.
When you attempt to compare Hydrograph’s graphene to others you realize that there is NO comparison.
"We make products lighter, faster and stronger."
Christopher M. Sorensen Kansas State University Inventor of HydroGraph Graphene Technology
Watch Youtube https://t.co/IjFZDO7daN
Is Graphene the new OIL ?? https://t.co/QFZd7LM96v
Hydrograph video Nuclear Scientist Kerry Landis and Newsletter writer Jay Taylor Excellent
https://t.co/KYW04aaNxJ
Jay Taylor "HydroGraph is indeed the most exciting and transformative company story I have covered over the past 40+ years that I have edited J Taylor’s Gold, Energy & Tech Stocks."
Kerry Landis Nuclear Engineer : "...... I've looked deeply into Hydrograph....... And, and my conclusion, and you'll hear more about it today is that this is probably, no, it is the best growth opportunity I've seen in 40 years."
”I’ve been investing for 30 years and studied the broad history of the best stock stories over the centuries. There has never been a better story.” - Kevin Bambrough on HydroGraph
#CleanTech #GrapheneRevolution
#hydrograph #nanomaterials #alternativeenergy #superconducting #conductivity #electronics
$HGRAF
Member Request
$HGRAF continues to respect a strong bullish trend over the last year, but after such an extended move higher we are now seeing healthy consolidation develop through a symmetrical triangle pattern.
That type of structure often reflects equilibrium between buyers and sellers before the next larger directional move.
Today’s gap directly into descending resistance closing as a counterattack candle tells us bulls attempted a breakout but lacked the momentum and follow-through strength needed to clear overhead supply.
Price continues to hold above the rising 50 EMA, keeping the broader bullish structure constructive.
From a psychology standpoint, this looks more like consolidation within an uptrend rather than distribution. Bulls would ideally want to see any additional weakness remain controlled above the 50 EMA while continuing to compress within the triangle before another breakout attempt.
As long as price remains trapped within the symmetrical triangle, patience is required as the market continues to coil.
A pullback toward ascending support would likely be viewed by trend-following bulls as a potential higher low buying opportunity within the broader uptrend structure.
$PLUG $BE $BLDP $FCEL $QS $ENVX $EOSE $FREY $AMPX $STEM $MVST $SLDP
Matthew Tuttle, CEO and chief investment officer of Tuttle Capital Management, thinks that whistleblower immunity can be a market catalyst, and has launched an exchange-traded fund (ETF) focused on UFO disclosure.
https://t.co/stS5gOUK6K
Sure. Glad I had some time, and for me your questions had me doing a fresh review of the chart and re-questioning of some of what I'm seeing and thinking, which was good to do again.
I have similar concerns about the markets, but with HGRAF I'm just long term focused and dollar cost averaging in what additional I can afford to every two weeks. In my 401k, where I can't buy individual stocks and there are no commodity investments, I went all into the money market a while ago.
HGRAF was interesting today. It went a little lower to the 0.618 fib retracement, and then did the very "impulsive" looking move up from there. In case you might like to see it, below is the chart from yesterday with today's moves. Again, it's a 5-minute chart, so we'll see what happens tomorrow and Friday, but it is a little encouraging for this maybe being the beginning of the daily chart's possible wave 3 up.
$HGRAF looking good so far for maybe having started the possible third wave. The next few days are going to be very interesting.
It back tested both the down sloping black line and the slightly up sloping green line, then bounced pretty good Friday followed by another green day Monday.
If it is a third wave, we should see more (and bigger) green candles than red candles the rest of this week, and it should be an overall up week.
It dropped farther out of the purple channel up than I wanted to see, but I have seen that a few times before in other stocks and then regain the channel. However, I added a blue channel that looks maybe better. Time will tell. (I removed the dotted mid-line from both channels because they were making the chart too cluttered.)
I also added a clone of the small green channel up from the February low to the March high, projecting how it might head up in a similar move, but if this is a third wave, it should be a more bullish up move than that, even if the angle is lower and takes more time.
Or maybe this week will show I've got it wrong and we're not in a third wave. However, it's still looking corrective since the move up from February to March and still looking very bullish overall.
$HGRAF tagged the black line Monday, and the daily candle is a hammer (bullish reversal candle). The wick is big enough, but it's on the small side.
Interestingly, tomorrow is a 'Fibonacci time zone' line for the move up from February 5th to March 10th, which would be a "perfect" time to begin a new uptrend. (I don't often look at fib time zones.)
Tagging the green line this week would be fine (preferably by Wednesday if it's going to), but this really needs to start a move up this week, break over the resistance line around $6 this week or next week, and be the beginning of a strong move up, or I don't see how this can be the beginning of an Elliott Wave third wave. (Would still look bullish to me, but I might give up on Elliott Wave counting, despite very good-looking Elliott Wave patterns going back to last year.)
Hammer candlestick info: https://t.co/QFxaGTtNKE
Good thought/question. Yeah, if it went below last Friday's low of $4.42, then your possible target around $4.00 wouldn't be surprising.
(It'd be a little annoyed since Monday I just did my bi-weekly auto-buy at $4.93. ☹️😄)
There's support around $4.24 from 3/19, and then around $4.08 from 4/7, but both fairly minor support.
An argument could be made for it dropping as low as around $3.50, even as low as $3.41 (the 0.786 fib retracement of the move from the February low to the March high), but I have a lot of trouble seeing that as likely, considering the look and patterns overall, but I could certainly be wrong.
That black down sloping line is looking pretty good, and even more so along with the green up sloping line.
I'm not thrilled with the current look of the RSI (and the MACD which isn't on the chart). Those can look not great at the very beginning of a strong move, but today they weren't what I'd prefer to see.
One interesting thing about the retracement of the move from Friday's $4.42 low to Monday's $5.00 high is that it's held (so far) around the 0.5 fib retracement of $4.71. (Shown on the 5-minute chart below.)
I'm very curious and looking forward to seeing what happens the rest of this week.