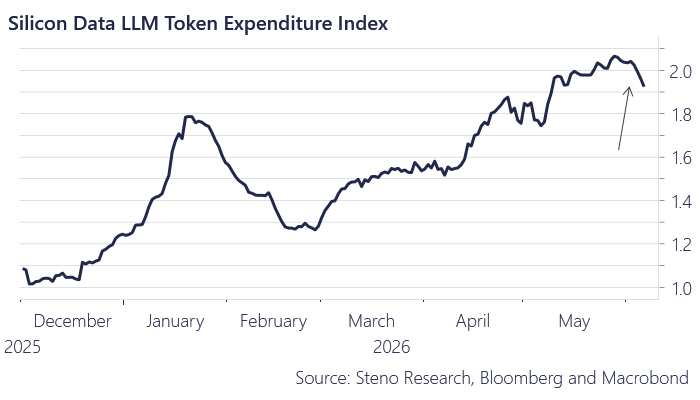
This is the chart that everyone should be watching.
If the Token Pricing rolls over, everything from the memory trade to the broader hard-ware and data-centre trade is over for this cycle imho.
The whole setup depends on this..
The Square-Root Law and the Death of Market Rotation:
One of the most important empirical discoveries in modern market microstructure is the square-root market impact law, developed by researchers such as Jean-Philippe Bouchaud and later connected to broader work on market structure by Xavier Gabaix. The relationship is simple but powerful:
I(Q) ∼ σ √(Q/V)
Where:
• I(Q) is the expected price impact of a trade
• Q is the size of the order
• V is typical daily trading volume
• σ is the volatility of the asset
The law states that price impact increases with the square root of the fraction of daily trading volume executed. In practical terms, when investors attempt to move large amounts of capital into or out of a market segment, prices must adjust in order to locate liquidity on the other side of the trade.
The key implication is that liquidity is far thinner than it appears. Institutional flows must move through layers of liquidity, and as those flows grow relative to available trading volume, price movements accelerate. In modern markets, this means that flows themselves increasingly drive price changes, often independently of fundamentals.
This dynamic interacts with another defining feature of today’s equity markets: the dominance of passive investment vehicles.
Passive funds now represent roughly half of equity ownership and an even larger share of marginal trading activity. These vehicles allocate capital mechanically according to index weights rather than valuation or macro views. Inflows are distributed proportionally across constituents, reinforcing the dominance of already-large companies and sectors.
Because passive capital does not rotate, the shrinking active cohort is responsible for nearly all discretionary allocation decisions. But the amount of capital controlled by active managers is now small relative to the total market, which makes large reallocations increasingly difficult.
Under this structure, the traditional concept of sector rotation becomes mechanically unstable. Active managers attempting to move large amounts of capital between sectors are effectively trading against limited liquidity, and the square-root impact law implies that such flows will produce outsized price movements.
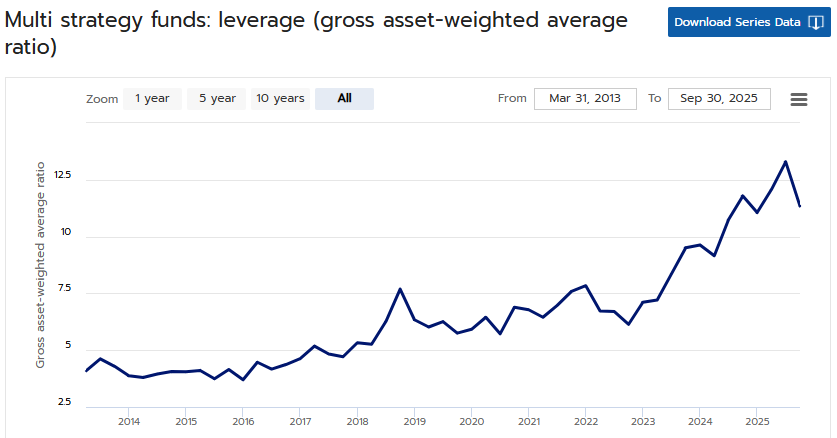
As a result, the primary mechanism for adjusting risk is not rotation but degrossing. Funds must now reduce total exposure across portfolios rather than reallocate capital from one sector to another.
The market behavior of the past several months illustrates this dynamic clearly.
The process began in September, when multi-strategy and equity funds began reducing gross exposure. The most obvious place to cut risk was in the largest and most crowded positions: the U.S. mega-cap technology complex, particularly the Mag7.
As funds trimmed these long positions, they simultaneously covered short positions in smaller and mid-cap equities. That short covering produced a sharp rally in those segments of the market, which many observers interpreted as the beginning of a long-awaited rotation away from mega-cap technology.
In reality, the move was largely the mechanical result of balance-sheet contraction. Short covering requires far less capital than building new long exposure, so smaller and mid-cap stocks moved quickly even though relatively little net capital was being allocated to them.
At the same time, some capital leaving mega-cap technology sought destinations capable of absorbing large flows. The precious metals complex, particularly gold and silver, fit that requirement. These markets are among the most liquid in the world and were already in strong uptrends, making them natural targets for systematic and momentum-driven strategies.
As a result, early degrossing flows were split between three effects: selling of mega-cap leaders, short covering in small and mid-caps, and inflows into highly liquid trending assets such as precious metals.
But the initial selling in mega-caps began to trigger additional pressure through portfolio risk systems.
Because these stocks dominate index weightings and factor exposures, declines in the mega-cap complex quickly pushed portfolios toward value-at-risk and exposure limits. Once those limits were approached, risk systems forced further reductions in exposure.
At that point, selling began to propagate down the market-capitalization hierarchy.
Positions that shared similar factor exposures such as software and financials began to experience sustained selling pressure. Software companies sit immediately behind the mega-caps in many institutional portfolios, sharing similar growth and quality characteristics while also exhibiting high index correlation. As funds continued to reduce risk, these positions became natural candidates for further trimming.
The result was a broadening of the selloff from the very largest technology names into the wider growth complex, particularly software.
Meanwhile, the short-covering rally in smaller equities continued to ripple through the market. The relative strength of these names created the impression that capital was rotating into cyclicals, staples, and international markets such as Europe and emerging economies.
But the scale of capital embedded in the mega-cap complex makes a true rotation mathematically implausible. Reallocating even a small portion of that capital into smaller markets would overwhelm their liquidity and cause extreme dislocations.
What appeared to be sector rotation was therefore largely a statistical illusion produced by degrossing: the selling of crowded longs combined with short covering in thinner segments of the market.
Because those thinner markets require far less capital to move, they can rise sharply even when net flows are relatively small.
Eventually, however, the same dynamic that drove the initial rally began to reverse.
As volatility rose and risk limits tightened further, funds that had previously covered shorts or rotated exposure began reducing positions across those same sectors. Selling pressure spread into cyclicals, staples, and international markets, including Europe and emerging markets.
The pattern that initially looked like a broad rotation now began to unwind.
From the perspective of market microstructure, this sequence is exactly what the square-root impact law would predict. When large pools of capital attempt to adjust exposure simultaneously in markets with uneven liquidity, price movements become dominated by the interaction between flows and available trading volume.
Thin markets can rise quickly during inflow periods because relatively small amounts of capital push prices higher. But when flows reverse, those same markets can fall just as rapidly because there are few natural buyers available to absorb the supply.
This produces the air-pocket behavior increasingly visible across modern markets: sharp rallies followed by equally abrupt declines as flows change direction.
These dynamics have also interacted with the volatility market in important ways.
Earlier in the process, rising dispersion across individual stocks allowed traders to hedge index exposure through dispersion trades (typically long single-stock volatility while short index volatility). But as selling pressure spread across sectors and correlations began to rise, that dispersion collapsed.
As stocks began moving together again, dispersion trades lost their effectiveness and hedging activity shifted back toward index-level protection, particularly S&P 500 options and instruments linked to the VIX.
If volatility itself begins trending higher, this could introduce a further feedback loop. The volatility complex is structurally smaller than equity, commodity, or bond markets, meaning that large inflows into long-volatility strategies could produce outsized price moves under the same square-root impact dynamics.
Dealers hedging those exposures would likely increase their use of equity or volatility-linked options, which could further amplify volatility in the underlying market.
If equity indices keep weakening, volatility rises further, or the precious‑metals trend continues to fade, the next likely destination for capital would be the few markets with both depth and emerging strength: energy and U.S. Treasuries.
These are among the only venues able to absorb large reallocations without immediate square‑root‑style impact. However the Iran conflict and the resulting spike in crude volatility may narrow that list, effectively leaving Treasuries as the only major asset class with liquidity, lower volatility, and a developing uptrend.
Taken together, the sequence of events over the past several months illustrates a broader structural shift in how markets function.
In an environment dominated by passive ownership and large institutional flows, capital cannot rotate smoothly across sectors as traditional market narratives suggest. Instead, adjustments occur through degrossing, short covering, and reallocations into the few markets capable of absorbing large flows.
The square-root impact law explains why these adjustments increasingly produce abrupt and sometimes counterintuitive price movements.
In modern markets, capital does not necessarily move wherever investors would prefer it to go.
It moves wherever liquidity allows it to go.
Below is a detailed analysis of this week’s key developments—Greenland, Iran, the Fed chair succession—along with a breakdown of my current positioning. You’re welcome to read on.
https://t.co/vs8kQHgVsb