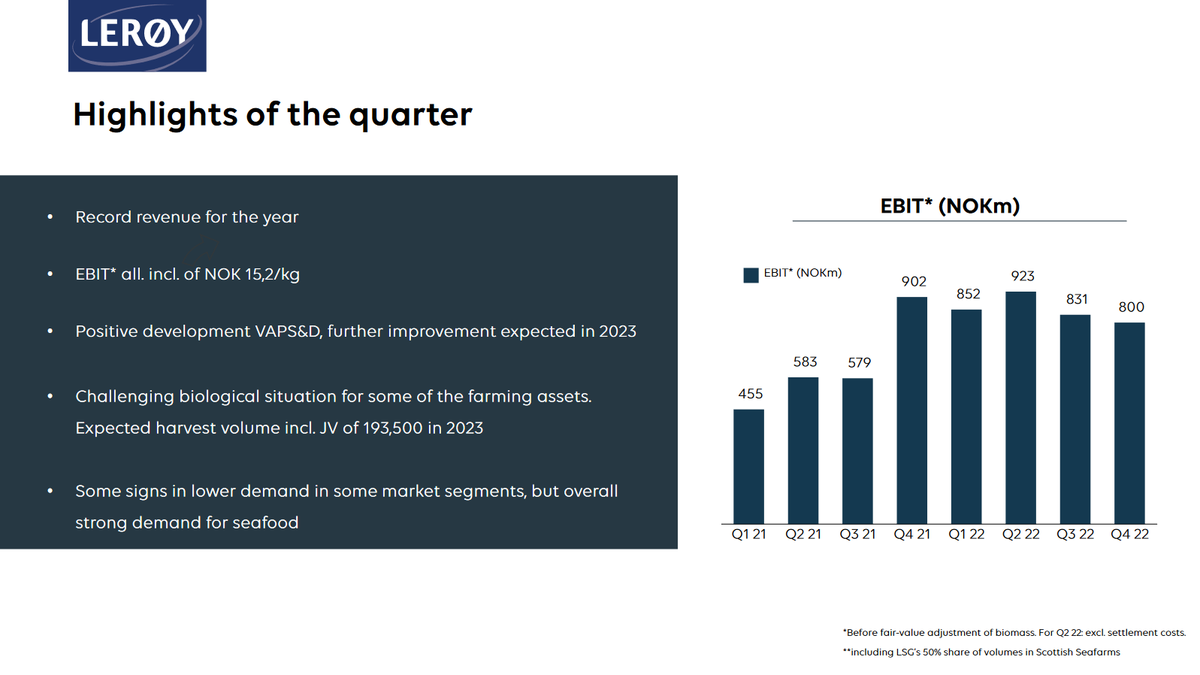
Who said @powerpoint had to be boring? Not us! 🤩 Take a peek at this incredible report from Lerøy created using Grunt to get inspired! 👉 https://t.co/LRRs3p50jK
#PowerPoint#charts
Working smarter isn't just our goal - it's our passion. 💥 But, nothing brings us more joy than seeing our satisfied clients. Special thanks to Bruno Stultjens for his invaluable contribution to crafting this statement. 🙌
#clients#PowerPoint#automation
Get up to speed with our popular @powerpoint and Grunt PowerPoint add-in hotkey guide!💥Click the link to download the presentation from LinkedIn👉 https://t.co/OzklAm4zWA
#workflow#Powerpoint
When it comes to great presentations, the devil is in the details. 😈
Avoid those minor mistakes that take away from your message 👉 https://t.co/Vb3Qh13sNj
#presentationdesign@powerpoint
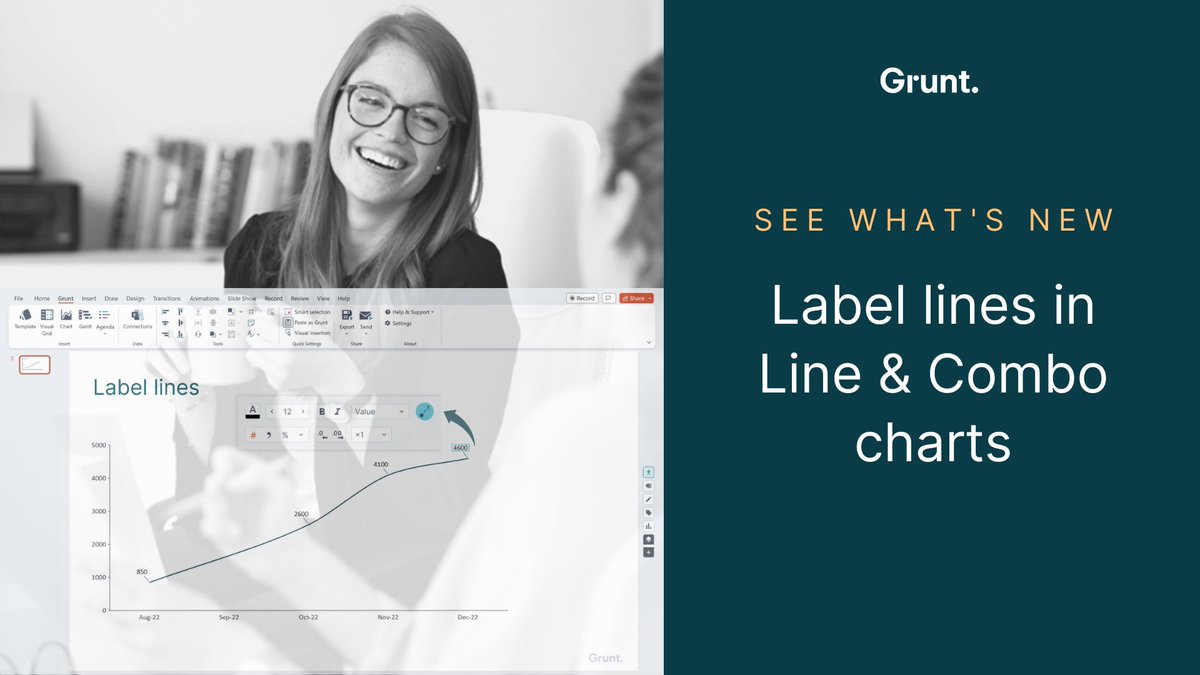
Our latest update brought another highly-requested feature - "Label lines" that help readability of series numbers. 💥
Click the label to find the new toggle in the label mini toolbar 👉 https://t.co/CFOHMTVxtY
#productupdate#gruntpro#charts@powerpoint
We've learned a lot from the ChatGPT research preview and have been making important updates based on user feedback. ChatGPT will be coming to our API and Microsoft's Azure OpenAI Service soon.
Sign up for updates here: https://t.co/C7kMVpMAKv
Don’t want to start your @powerpoint report from scratch?
Save yourself time and energy by using our -notch templates and get ahead with ease! 👉 https://t.co/ah9dxiLwVb
#projectmanagement
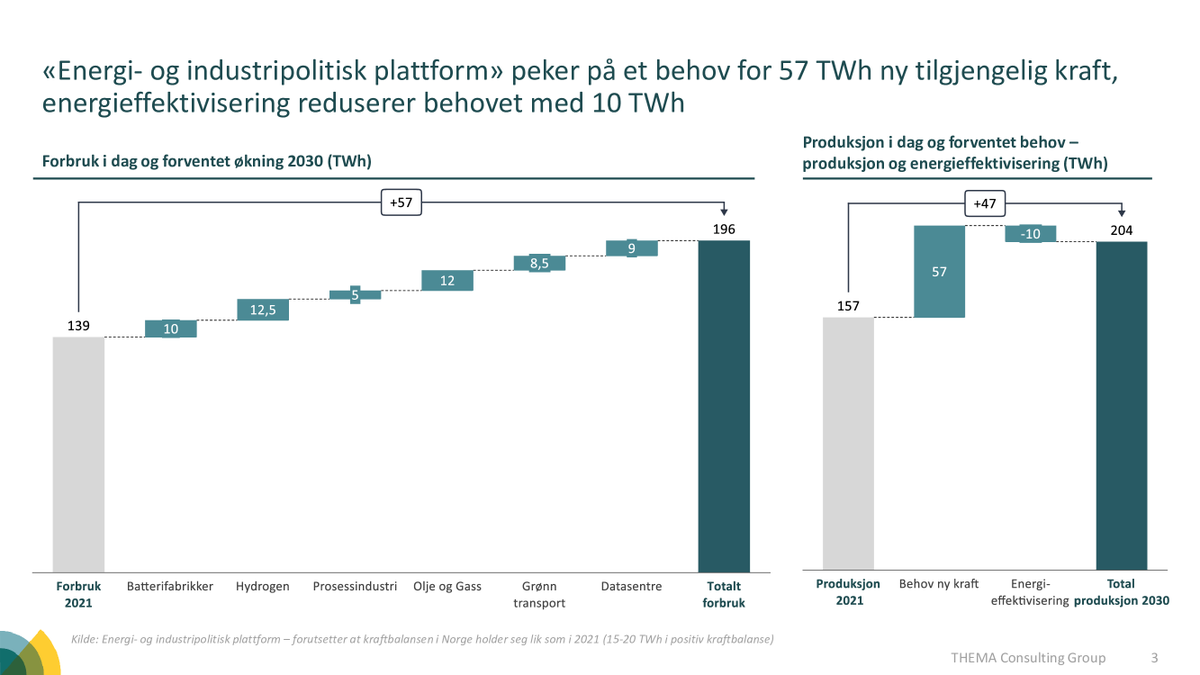
Our valued customers continually demonstrate the impact Grunt has on their business presentations.
We are delighted to highlight another exceptional use case from @THEMA_CG and thank them for sharing it with us. 👏
Look at the full presentation here 👉 https://t.co/1sJeadJZQ3
We wish everyone a Merry Christmas, and may your holidays be filled with joyous moments! 💓
Here's hoping that 2023 brings you nothing but an abundance of good health, happiness, success, and prosperity! 🎄🎁 🥂 🎊
#TeamGrunt#holidayseason
When it comes to data visualization, charts are your best friend. But with so many chart types out there, how do you know which one is right for your data?
Learn about best types and practices here 👉 https://t.co/7Iqgr1MkOv
#Charts#PowerPoint
Visualized KPIs are a tool that should be used more when it comes to reporting. 💡
Many sticks to just showing financial tables, but visualized KPIs represent an even more effective way to display information. 💡
Click here to learn more 👉 https://t.co/0D18QnLwTT
#powerpoint
Do you want to automate tedious @powerpoint manual tasks? Do you want to produce your slides faster and get amazing reports and business charts in minutes?
If there are 3 yes, click here 👉 https://t.co/ZCzTPCnqMA
#Finance#consulting#charts#Report
When you have a highly manual workflow, tight deadlines, and dependencies on others to produce your data, you have little or no control over daily tasks. 🥵
Follow these tips to learn how to automate your processes 👉 https://t.co/gfaERjo2vx
#report#data@powerpoint
To make sure the presentation goes off without a hitch and everyone in attendance has an unforgettable experience, we've compiled some of our favorite essential tips for making great-looking presentations! 👉 https://t.co/FWvd7MICsE
@powerpoint#Presentation
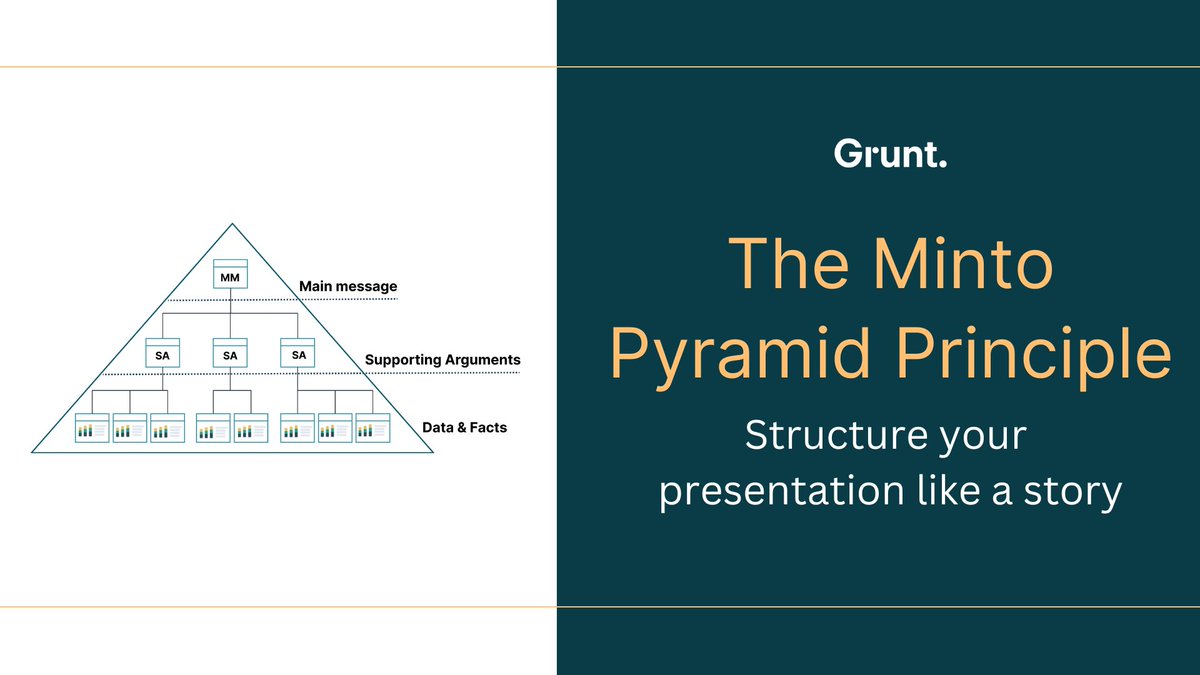
Have you tried The Minto Pyramid Principle to structure your presentations or any type of data that needs communicating?
Read more 👉 https://t.co/Ri2H5efLnA
#PowerPoint#Communication
@chrija We at @gruntpro have already solved this for PowerPoint. I recommend that you check it out. It feels like magic🪄
Reach out if you want to learn more, or check out https://t.co/brmEApN96I
We're always listening. And when you ask us, we answer! 💥
We're introducing our newest product updates: 𝐂𝐨𝐧𝐯𝐞𝐫𝐭 𝐧𝐚𝐭𝐢𝐯𝐞 𝐜𝐡𝐚𝐫𝐭𝐬 𝐭𝐨 𝐆𝐫𝐮𝐧𝐭 and 𝐈𝐦𝐩𝐫𝐨𝐯𝐞𝐝 𝐂𝐨𝐦𝐛𝐨 𝐜𝐡𝐚𝐫𝐭 𝐜𝐨𝐧𝐭𝐫𝐨𝐥. 💥 📊
More details here 👉 https://t.co/CFOHMTVxtY
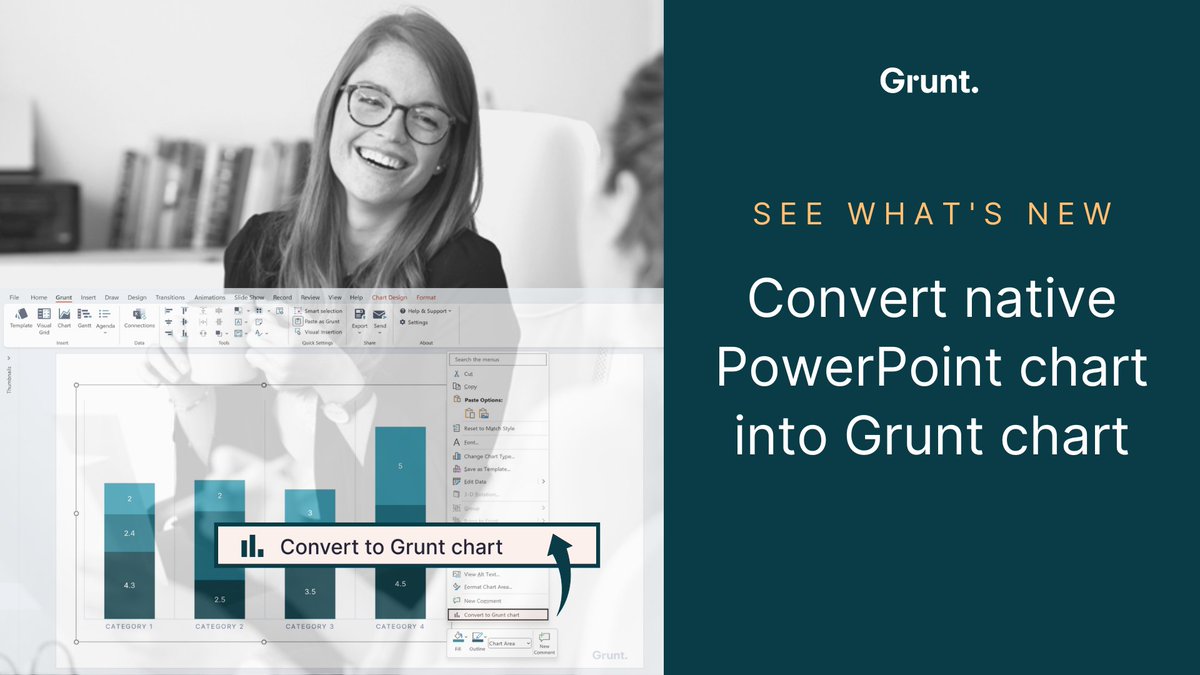
Do you want to bring those old charts lying around PowerPoint into Grunt? 📊
You can right-click any native chart and find the new "Convert to Grunt chart" option in the context menu. 🎯
Get the same data, size, and position as the original. 💥
#charts#PowerPoint