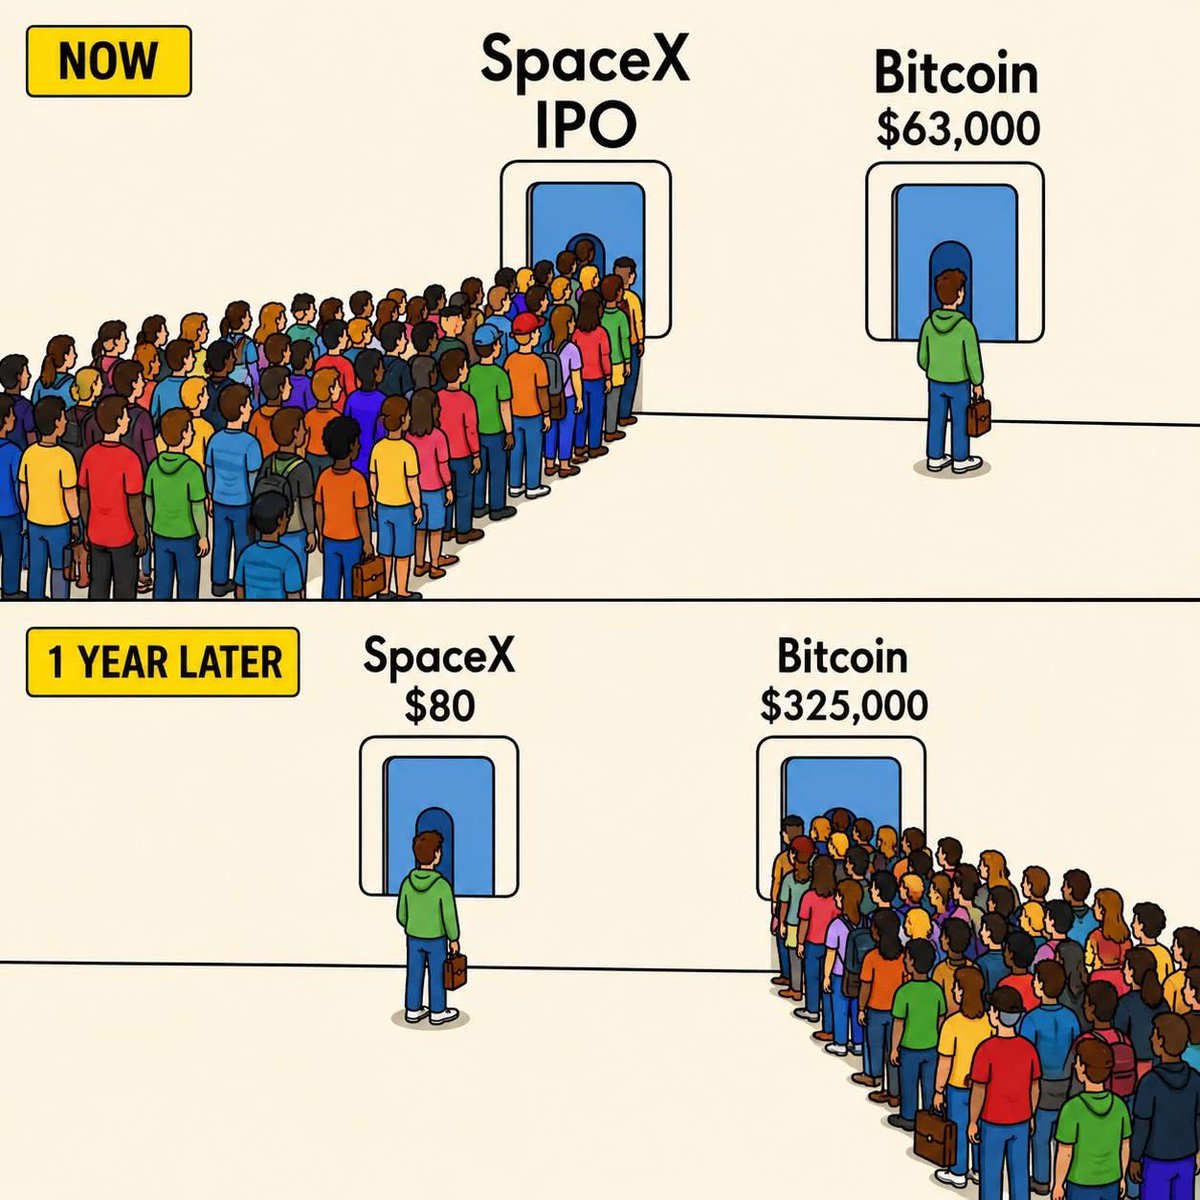
Most people are focused on the SpaceX IPO & the AI equity boom.
That's the small part.
$4.7 trillion has been raised across global capital markets in 2026 - equity, investment grade debt, high yield, leveraged loans, private credit.
Capital raising is going exponential.
Crypto is entering a consolidation phase.
In the dotcom era, the markets simultaneously (a) overpriced the losers and (b) underpriced the eventual winners.
The winners and the market size turned out to be way bigger than we imagined.
Top crypto projects with sufficient cash and runway to dominate their respective verticals will sweep the upcoming market.
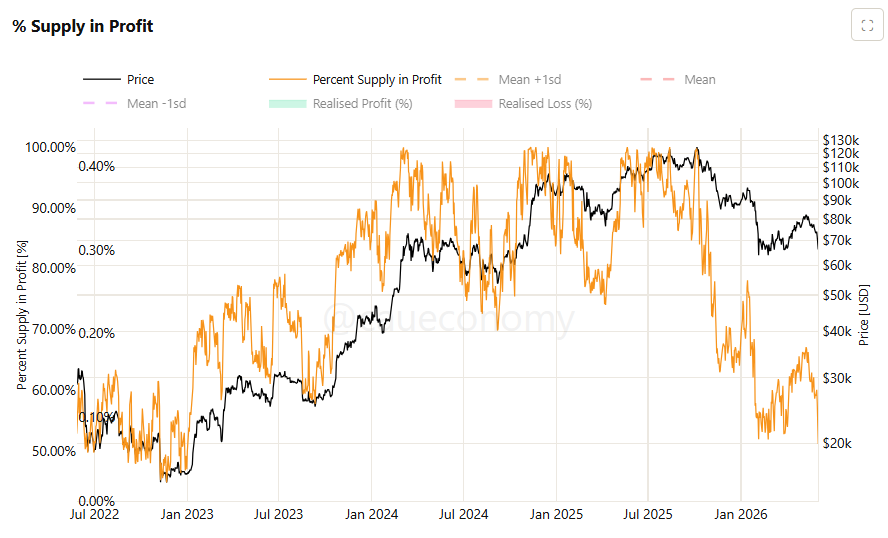
I love the cadence of this chart
Bitcoin % of Supply in Profit/Loss
As I said previously, you start looking for major market cycle bottoms *after* they cross, not before.
They just crossed.
Such a great chart for keeping people on the right side of the market in midterm years
Quase metade da oferta de bitcoin está no PREJUÍZO.🔥
51% da oferta em lucro. O menor nível desde o bear market de 2022, quando o bitcoin estava abaixo de 20 mil dólares.
O preço hoje é 4 vezes maior, mas o dano na base de holders é o mesmo.
Isso é o padrão de capitulação distribuída que ocorre em estágios avançados de bear market.
É também quando muita gente entra em pânico.
É também quando muito institucional acumula.
Qual lado você está, panicando ou acumulando?
Bitcoin está em níveis históricos.
Apenas 5 vezes nos últimos 6 anos o RSI esteve aqui, em todas as vezes ele acabou recuperando posteriormente enquanto muitos fugiram.
Lembrando que estratégia > timing.
Acertar topos e fundos exatos é apenas para alimetação de ego. Gerir exposição é o que distingue investidores sofisticados de iniciantes.
Você está tentando acertar o olho da mosca ou buscando gerir risco? Reflita.
Saylor indicator 2022 vs 2026
Same pattern:
2022: Michael sold -> $BTC hit the bottom
2026: Michael sold -> WE ARE HERE
Most reliable indicator ever