Market Wizard Linda Reschke's 12 Technical Trading Rules:
1. Buy the first pullback after a new high. Sell the first rally after a new low.
2. Afternoon strength or weakness should have follow through the next day.
3. The best trading reversals occur in the morning, not the afternoon.
4. The larger the market gaps, the greater the odds of continuation and a trend.
5. The way the market trades around the previous day’s high or low is a good indicator of the market’s technical strength or weakness.
6. The previous day’s high and low are two very important “pivot” points, for this was the definitive point where buyers or sellers came in the day before. Look for the market to either test and reverse off these points, or push through and show signs of continuation.
7. The last hour often tells the truth about how strong a trend truly is. “Smart” money shows their hand in the last hour, continuing to mark positions in their favor. As long as a market is having consecutive strong closes, look for up-trend to continue. The up trend is most likely to end when there is a morning rally first, followed by a weak close.
8. High volume on the close implies continuity the next morning in the direction of the last half-hour. In a strongly trending market, look for resumption of the trend in the last hour.
9. The first hour’s range establishes the framework for the rest of the trading day.
10. A greater percentage of the day’s range occurs in the first hour then was the case in the past, and thus it has become increasingly important to trade aggressively if there are early signs of a strong trend for the day.
11. There are four basic principles of price behavior which have held up over time. Confidence that a type of price action is a true principle is what allows a trader to develop a systematic approach.
The following four principles can be modeled and quantified and hold true for all time frames, all markets. The majority of patterns or systems that have a demonstrable edge are based on one of these four enduring principles of price behavior.
Charles Dow was one of the first to touch on them in his writings. Principle One:
A Trend Has a Higher Probability of Continuation than Reversal Principle Two:
Momentum Precedes Price Principle Three:
Trends End in a Climax Principle Four:
The Market Alternates between Range Expansion and Range Contraction!
12. In the world of money, which is a world shaped by human behavior, nobody has the foggiest notion of what will happen in the future. Mark that word –
Nobody! Thus the successful trader does not base moves on what supposedly will happen but reacts instead to what does happen.
A billionaire went on stage and explained in 42 minutes how the entire economy works. for free. Wall Street spent the next decade pretending nobody saw it.
he didn't sell a course. he didn't plug a fund. he stood at a whiteboard and drew three lines that explain every crash, every recovery, and every rate decision since 1929.
MBA programs charge $200,000 to teach frameworks he covered in the first 15 minutes. six of the models he drew on that board are still classified as proprietary at three major banks. he gave them away on YouTube.
the part nobody talks about: he predicted exactly what happened in 2020, two years before it played out. interest rates hitting zero, the central bank running out of tools, the money printer. he drew it on a whiteboard in 2018 like he was reading tomorrow's newspaper.
a portfolio manager at a top-five firm told me every new analyst on his desk watches this before they're allowed to open a terminal. not the CFA prep. not the internal training. this one lecture.
40 million people have seen it. almost none of them can name the three forces he draws in the first ten minutes.
it is still free.
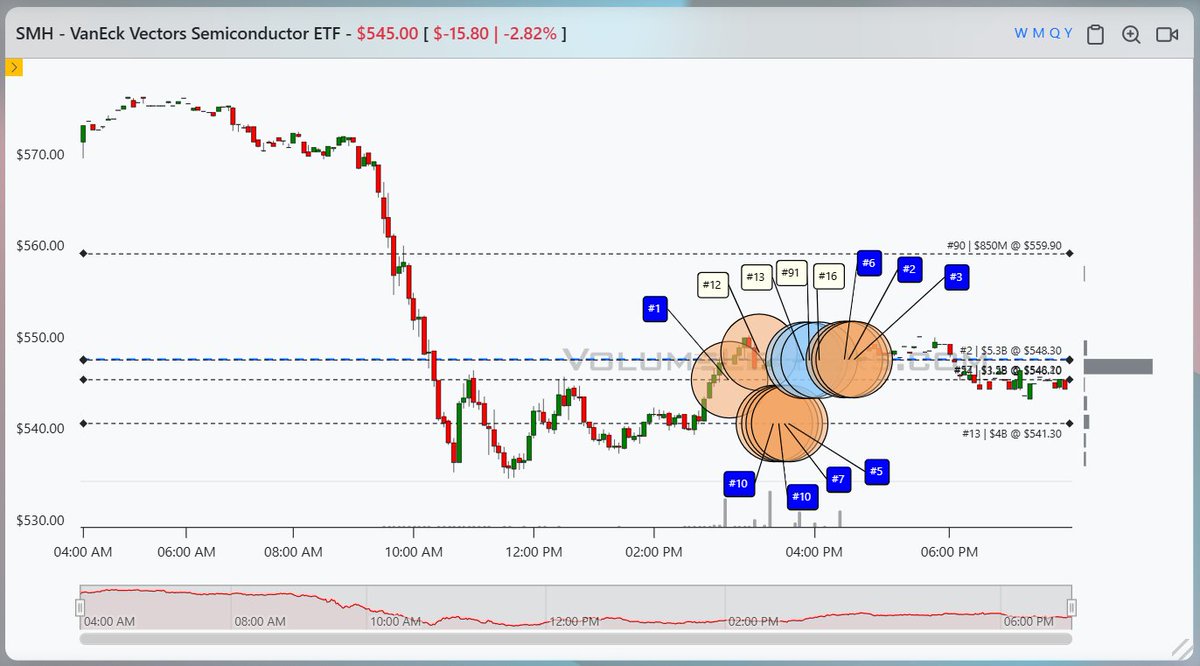
$SMH - Never have I ever...seen anything like this.
- Eleven (11) top-100 ranked trades between 2pm and 4pm, most on dark pools.
- Eight (8) were ranked in the top 10.
- Each appeared between $541 and $549.
- $10.7B, cumulatively.
This is "off the charts" large, and I'm going to keep this update simple.
There's an argument for buying into the decline.
There's an argument for liquidation at the lows.
The former is the more common outcome after a period of selling, but that doesn't mean it's a stone cold lock. Just like getting dealt pocket aces only makes you an 80% favorite heads up. It doesn't guarantee you win the hand. That donkey in your friend group is still gonna outdraw you one in five times.
So you're gonna have to prepare for both possibilities.
You know they bought if price recaptures the $541-$549 range, trades above, and holds. This is the look-below-and-fail outcome. If they're going to do this, sooner is better than later. In this scenario, they *probably* won't get too far underwater and they *probably* won't stay underwater for long. Probably.
You know they sold if price tests the $541-$549 range from below and fails to recapture, or just continues lower without a fight.
If institutions bought into the decline, I'd expect to see them defend those purchases. They did close above most of them, but haven't done squat overnight. Not encouraging so far.
That's it.
Price is in the $535 range as I type this. It either recovers or it doesn't. Have a plan either way, because the magnitude of the ensuing move has the potential to be quite large.
Friday they traded heavy at the lows too. We got a gap up that didn't hold. They usually do. Not this time.
Levels of importance:
$560
$549
$541
Gets a lot thinner after that. $504, $406. We can have that conversation later if we have to.
Good luck.
$SOXL, $SOXS, $SOXX
https://t.co/i5V7d5Evfk
HAS THE MARKET ALREADY TOPPED?
Quite a few people are asking this.
Let's examine it...
First, it is crucial to understand the structure and what everything means, because without this, positioning and probability analyses are just formulas without context.
▫️Last April, when the market bottomed out, the fear of a deflationary spiral took over, into which stagflation will inevitably morph. At the time, I wrote that the admin and the banks have every tool at their disposal to manage this in the short term, and I went long.
▫️The backbone and vindication of this rebound and of the faith in the admin is the 5645 – 5845 $SPX band of the May 9, 2025 gap, though we can safely include the 6000 level as well. The market has never backtested this. Driven by aggressive short speed profiles and long downside vommas, the market was pushed higher.
▫️The next most critical level was the August drawdown; here we can safely mark the 6210 – 6445 $SPX zone. That is when the first waves of economic warfare hit the economy, which would also tip stagflation over to the side of recession and eventually deflation. This level is a sign that the market trusts monetary forces have the capability to shield the economy from supply-side pressure.
It is no coincidence that the selloff following the Oct 29 Fed meeting approached this band, raising the question of whether there can be further growth if the Fed can no longer step in because inflation risks have grown too high.
After this, the market was rangebound. Then in February, at the outbreak of the Iran war, the market retested exactly the August 2025 zone.
- Why? ...Precisely because the market knew that the surge in oil prices and the slowdown in shipping would create a negative supply shock via an increasingly expensive supply chain, which once again begged the question: are monetary and fiscal forces capable of handling the recessionary threat?
The market was heavily crowded with short positions, and when the first deal emerged, short covering triggered a buyback wave which, by generating upside convexity, overshot the previous ATH (All-Time High).
▫️The first liquidity zone formed between April 17 and 29, between 7045 and 7180, making this level the backbone of the entire rebound. This level signals that the market has accepted this rally—meaning it feels higher prices are justified, even if only mechanically. (It is no coincidence that the zero-crossing of the rhogamma function I posted a few weeks ago falls roughly right here as well.)
▫️What followed was a continued, slow short squeeze right up until the renewed clashes on June 3, which Trump halted with a sudden peace deal headline on June 11. This level poses the question of whether this growth can continue once there is no diplomatic solution to the war, and oil spikes drive up energy costs, stoking inflation and forcing the Fed's hand.
▫️Following June 17, the market retested exactly this band after Warsh turned more hawkish. He promised that growth could be sustained with the right balance. (His hands are tied; he cannot pop the bubble until the midterms).
This is why I say this is the short-term barometer telling us what the market thinks about interest rates.
What they are playing is headline control for vomma, huge option trade for absorbing skew and yield control for framing. These are algo inputs.
This is what I'm trying to explain since Trump inauguration.
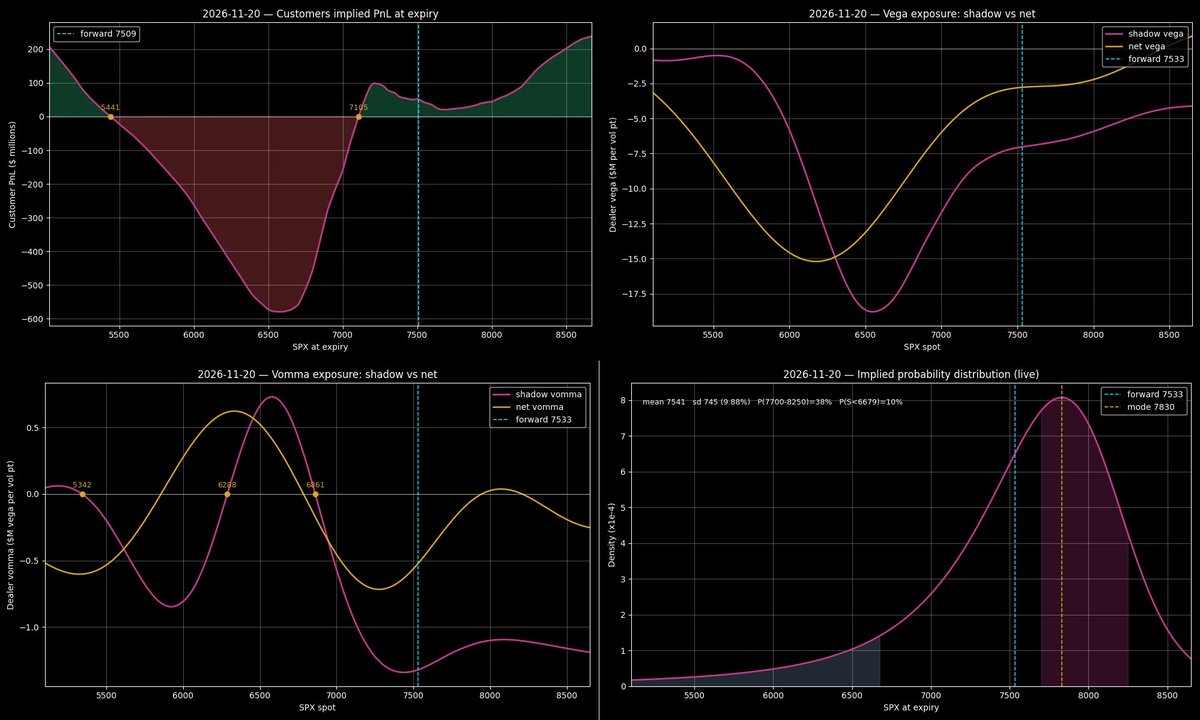
Currently, the market is pricing in a 60% probability of another ATH above 7700 $SPX (as I said in May), and a 40% probability that it's over. ☝️However, even if it were over, I still wouldn't short the market right now—only if it breaks below the 7000 level, because that is where the real convexity begins, which is actually worth playing for. Until then, yields, rho, gold, silver, oil, box spreads, etc. are the trades, which I’ve already shared for free previously.
Based on the probability distribution, the market assigns a 60.5% probability to the index rising. The bulk of the probability mass (38.3%) is concentrated in the previously identified 7700–8250 $SPX "re-own" band. A "B-wave" in Elliott terms. This is the safest bet. (And by the way, it aligns perfectly with my Trump-market analysis posted last July 23, where I called the top roughly around here... though admittedly, I thought it would play out over the full term, not in a year and a half. If they fire all their bullets too early, it won't end well.)
It assigns a 9.2% chance to backtesting the April 17-29, 2026 band by November, stalling there, and then ranging. Here, by the way, shadow gamma and shadow vomma exert a fairly supportive effect, and theta risk becomes convex.
And it prices in about a 10% chance of us crashing below the 7000 – 6679 $SPX safety net. But conditional pricing can also be read from the density function: if this 10% tail event occurs, there is a 61% conditional probability that the drop won't even stop until the Iran war low (6310).
Here, however, I believe that the 7000 level—since it sits close to the rhogamma zero-crossing, i.e., the exact point where the SPX/yields beta is priced to become positive—would simultaneously signal the end of the bull market, and the doors of hell all the way down to 2019 pre-COVID levels. Obviously not in two days, but via a multi-month, perhaps one- to two-year bear market trend. This would be confirmed by the Dow $DJI index breaking through the 45k/43k zone.
...and the remainder is a bet on continued rangebound action, with elevated volatility and wider ranges.
My gut feeling is that we are done, but as said even if it would be so, I would not short it until...
There are plenty of problems, which I've already written about.
Not every problem matters.
I help you filter out what is truly important.
▫️One is the geopolitical situation. Escalation can be delayed, but not avoided. East and West will go to war with each other sooner than many think. I’ve written extensively about this. Xi and Putin are just waiting for the Western economy to crack. Because if it cracks, people will grow dissatisfied, and the bureaucratic Western system will panic. There will be protests, riots, and civil disobedience, and the EU will spend months voting on what format to use for the vote regarding the riots and the introduction of mandatory reservist conscription, all without violating the so-called rule of law and liberalism.
Not to mention that after the COVID pandemic, it took the EU bureaucracy about half a year just to figure out what kind of masks to wear and what the proper masking rules were. So imagine what would happen if they had to elect a responsible high command for an EU army. Having a strong military is useless if you don't know how to lead it.
Putin knows this too.
The East also knows that the West will be forced to violate its own rules if an oil crisis breaks out. Negotiations became urgent on America's part because the alternative oil source in the shadow trade was Russian energy, which the Ukrainians are currently busy dismantling. The East knows that we have elections here every four years, and politicians have their hands tied on too many fronts, while their time is also finite; furthermore, due to the electoral system, they are forced to be populist because liberalism has made people complacent.
This is what the whole game is about.
▫️The other issue is that everyone knows if they don't start hiking rates in a convex manner, their real value will drop, which is stealth QE and fuels inflation, inevitably spiraling into deflation later on. The question is from how high up we are falling. The underlying problem, as I've been saying since 2021, is that this inflation is coming from the supply side.
Oil will make the supply chain exponentially more expensive, compounded by Xi's administrative First Island Chain blockade—where they are deliberately slowing down transit—along with his threats against Taiwan, and the dismantling of the Russian shadow fleet. Goods from the shadow trade account for 1/3 of the energy market. This has now dwindled. And Xi doesn't even need to invade Taiwan to cripple the most critical Western supply chain; a serious threat or blockade is enough. This will happen at the exact right time to ensure maximum impact on the Western economy.
The First Island Chain strategy has been underway for a while, just nobody is paying attention to it. This will drive up the costs of energy, manufacturing, shipping, absolutely everything, and it will destroy the AI/tech sector too, because they won't be able to cover their energy costs. They are already heavily indebted, and they mask their losses with accounting fraud.
I've written extensively about this many times.
And among the public, it will fuel discontent, sparking riots.
And also $JPYUSD carry trade kurtosis is getting even fatter as we have arrived to H2, as I said... They cannot take it anymore. Sure, they sit on their hands for now and do it slowly but not for long...
A crisis is coming that Western society is entirely unprepared for, because they don't want to cause panic.
And you can know it's coming because, for the East, this is not some capitalist conflict of interest, nor is it purely geopolitical... it is an ideological, spiritual imperative. Heritage, ideological conviction, history.
That is why diplomacy doesn't work.
You'll see... I was right about Iran too, and about many other things... do your own research.
Have a good weekend😘
#BOJ $JPY #iranwar #stockmarket $SPX $VIX #warsh
This is the reason why we are outperforming the markets together. Save this, and you'll be rich during bull markets, and you'll survive during bear markets.
- At market bottoms, financials and tech lead.
- At the top, energy and staples take over.
- In bear markets, healthcare and utilities outperform.
My cycle repeats every time.
Knowing where you are in my cycle tells you exactly where to be overweight.
Save this. Study it. Use it.
This is all you need to do to make millions in the stock market. Save this. Screenshot it. You will need it.
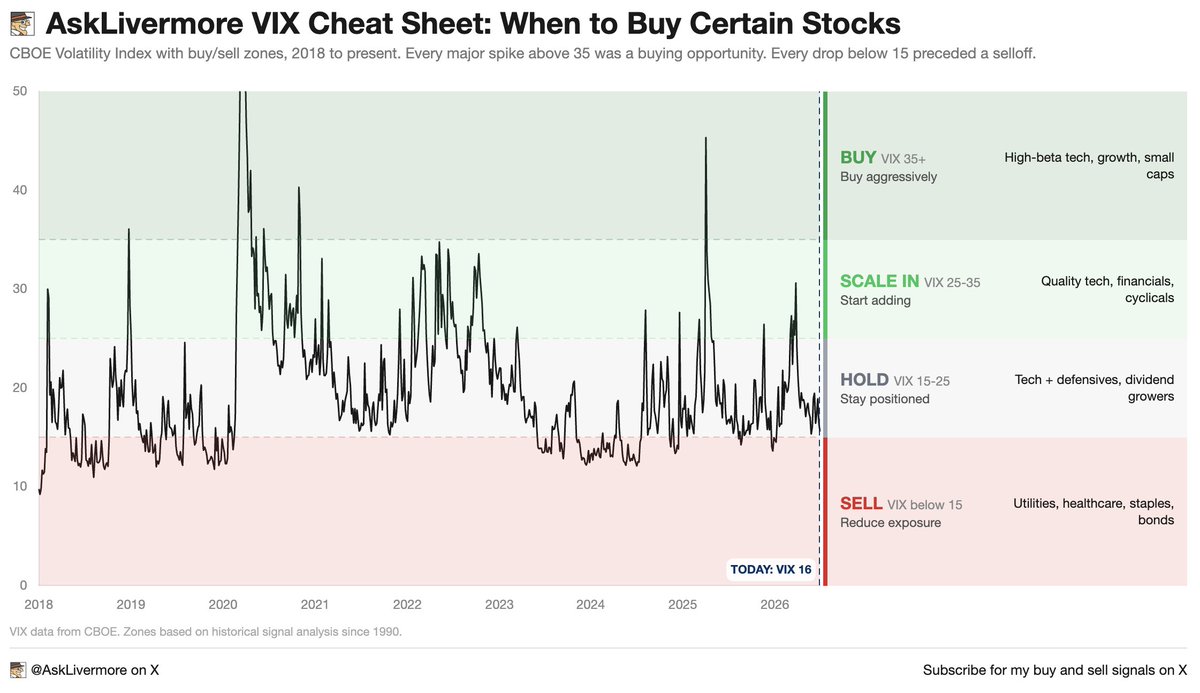
1. VIX above 35: buy aggressively
- High-beta tech, growth, small caps
- Every single time the VIX spiked above 35 since 2018 was a generational buying opportunity. COVID bottom. Oct 2022 bottom. Tariff crash. If you bought when everyone else was panicking, you made a fortune.
2. VIX 25 to 35: start scaling in
- Quality tech, financials, industrials, cyclicals
- This is where smart money starts building positions. Not all at once. Gradually. The fear is real but the opportunity is bigger.
3. VIX 15 to 25: hold
- Balanced: tech + defensives, dividend growers
- This is normal. Stay positioned. Don't chase, don't panic. Let your winners run.
4. VIX below 15: reduce exposure
- Rotate to: utilities, healthcare, staples, bonds
- This is when everyone is comfortable. Nobody is hedging. Nobody is worried. That's exactly when you should be.
- Every major crash in market history was preceded by the VIX sitting below 15 for weeks.
Right now the VIX is at 16. We're in the hold zone. Stay positioned but stay alert.
Bookmark this. The next time the VIX spikes above 35, don't freeze. Buy.
My dear followers.
Get READY for July, SURVIVE September, and ride the October-November move for 2026.
Here's how every sector PERFORMS month by month during MID-TERMS and what it means heading into July.
July:
- the BROADEST strength of the entire back half
- every single sector finishes POSITIVE
- tech, energy, and consumer discretionary lead with +4% moves
August:
- the rally STALLS
- half the sectors turn NEGATIVE
- biotech $XBI is the standout at +4.52% while energy $XLE and materials $XLB fade
September:
- this is the month to be CAREFUL
- nearly every sector DIPS
- utilities $XLU and real estate $XLRE get hit hardest
- if you're adding exposure, this is where you WAIT
October:
- the TURN
- STRENGTH comes back almost everywhere
- staples $XLP LEAD at +3.91%, but even the LAGGARDS catch a bid.
- this is historically where the midterm LOW gets put in.
November:
- CONTINUATION
- materials $XLB rip +4.57%. industrials $XLI +3.79%. the cyclicals take over
December:
- profit-taking
- almost every sector gives BACK
- tech DROPS -3.45%, energy -3.01%
- the back half rally takes a BREATHER before the post-midterm year kicks in
A lot of traders have setups. But they do NOT know the timing cycles.
I will always make sure you're STEPS ahead of everyone else.
INFLATION Pt. 2
Around April-May of last year, I already pointed out that the Fed's base rate is too low.
Since they calculate the neutral rate based on the Williams model, it appears that the base rate is high and their policy is restrictive.
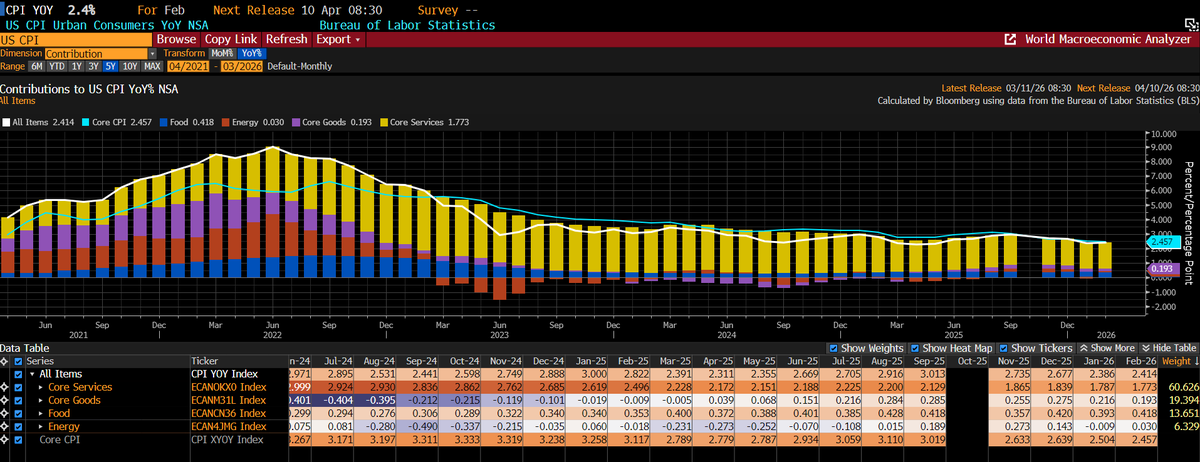
Despite this, GDP is growing above potential, unemployment is low, savings rates are low, and bank lending is growing at a pace not seen since 2009, which will further increase inflation with a 12-to-18-month lag. Furthermore, the government is running a ~6% budget deficit alongside full employment, representing the largest government-driven inflationary pressure since the 1970s and 80s.
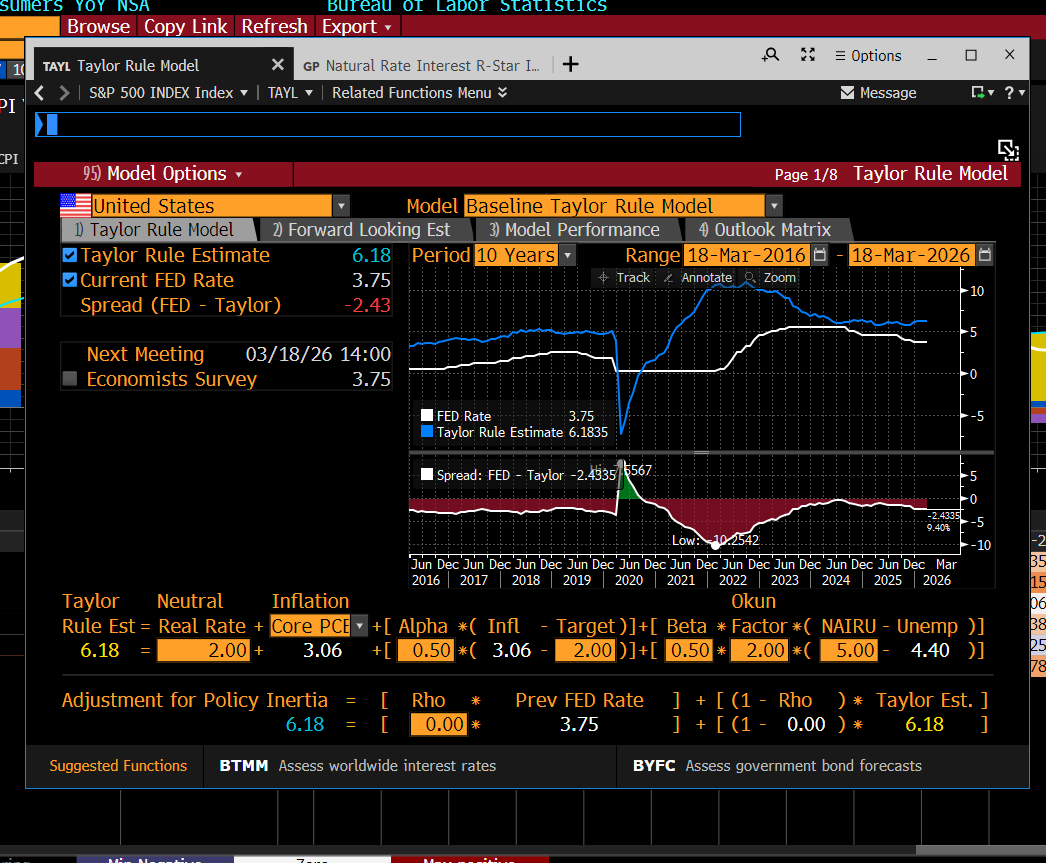
Last year, I introduced the Taylor rule, which demonstrates on a mathematical basis what the optimal central bank base rate should be in light of current inflation and economic performance.
As you can see in the image below, the Taylor rule estimate stands at 6.18%, which is 2.43 pts higher than the current Fed rate.
It is also worth observing the spread: in 2022, when the Fed was theoretically executing QT, the spread was even wider, meaning the Fed rate fell far short of what was mathematically justified☝️ This is one of the reasons—along with the Fed's MBS trades at the time—why I wrote that true QT never actually happened.
The economy, currently mired in stagflation, is now paying the price for this...
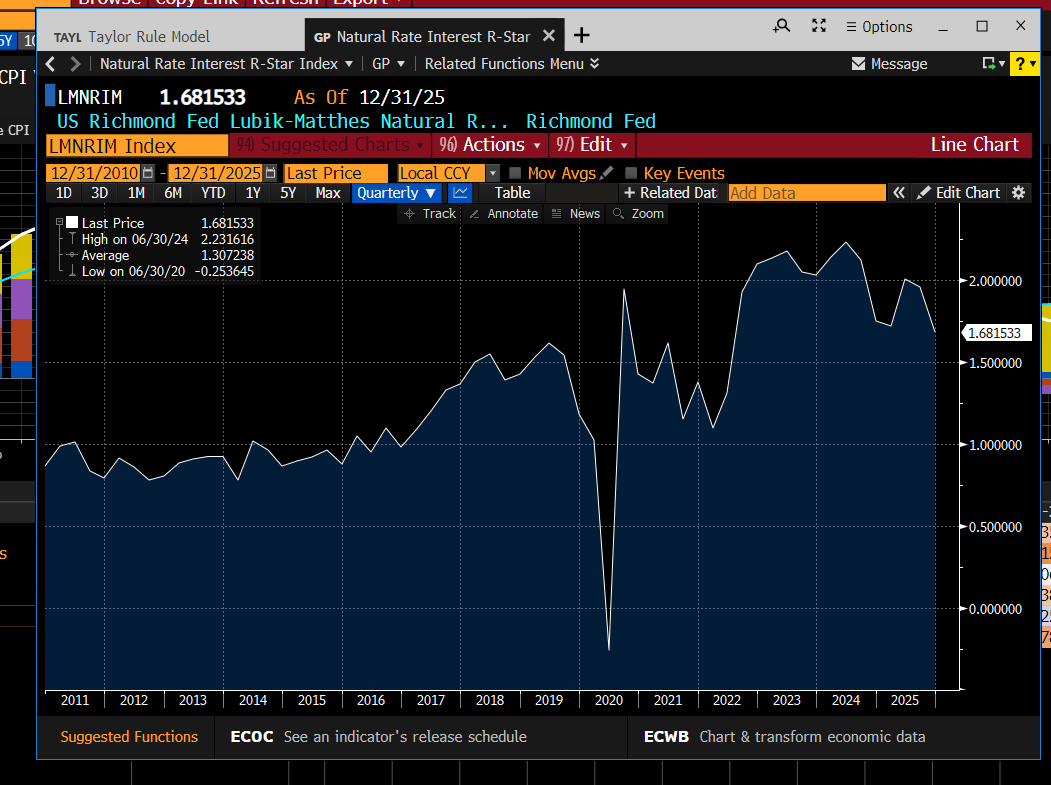
On the other chart, you can see the output of the Lubik-Matthes model, which estimates the neutral real interest rate.
In contrast to the sluggish Williams model used by the Fed, the Lubik-Matthes model reacts much faster and more dynamically to economic changes (see, for example, 2020 on the chart). In 2024, for instance, this model indicated a real neutral rate of 2.23%.
Currently, this model stands at 1.68%.
If I plug this into the Taylor formula, I get a rate of around 5.68%☝️
Meaning, the Fed funds rate should be at this level to meaningfully cool the economy and break the 3% inflation.
☝️However, the current inflation data is from the period before the Iran war.
As I previously forecasted, the war is dragging on, deepening supply chain issues, and causing an energy crisis. This will certainly not be a short-term phenomenon but a long-term one, because—as I wrote—due to the delayed timing of the offensive, the Middle East has now been destabilized for a long time.
Furthermore, China is also slowly building a blockade on the Western economy's most important supply route at the First Island Chain🚩
Oil has jumped above $100, and gas even higher. In addition, shipping is becoming more expensive, along with every industrial service that requires oil. Companies (e.g., airlines, manufacturing) are immediately pricing the higher energy and raw material costs into their own prices.
Consequently, inflation expectations have shot up to around 6%, while the Fed was already running an overly loose policy, and inflation has been above target for almost 6 years.
A rate hike, however, would trigger a recession and the end of populism, and social tensions would further increase; yet, in the long run, it would be healthy for the economy.
My expectation, however, is that the Fed will do nothing. They might strike a hawkish tone, but they will force the 'short-term inflation spike' narrative until the problem becomes undeniably obvious.
Then the rate hike might come, which by that time will carry deflationary risks due to the over-leveraged market and structural forces (short gamma/vomma effect plus negative wealth effect)...
Please, also read my posts about the propaganda. Very important for the coming times😉
#inflation #fed #powell #trump #iranwar #oil #stockmarket
$SPY EVERYONE REMEMBERS 10/29 RIGHT????
GAPPING UP INTO FOMC - TOP OF BB 2.0
And Then............. 17 FIB BAR Decline -5%
MINI WAVE A-B-Capitulation Candle 11/20
This time.... Jan 2026
We are Grinding Near ATH $700
So Structurally Better but Powell Can Still Slam Dunk Markets if He wants.
My Viewpoint is this:
END OF WEEK Close ABOVE $700 is KEY to BULL RUN INTO FEB 20th OPEX.
Should $NVDA Confirm Earnings in MID FEB - RUN BULLISH INTO MARCH OPEX.
FLIP SIDE: POWELL TANKS MARKETS WED 1/28
MAGS MISS and we SINK -5% into 2/20 OPEX $SPY $670
ALL GOOD BULL RUNS WERE MURDERED BY THE FED. THIS HAS NOT CHANGES IN DECADES.
@federalreserve
DO THEY WANT TO CONTINUE QE LIGHT?
WILL THEY NOTE RATE CUT IN MARCH OR MAY?
WILL POWELL HINT AT STAYING ON THE BOARD AFTER HIS TERM IS UP?
@grok WHAT SAY YOU????
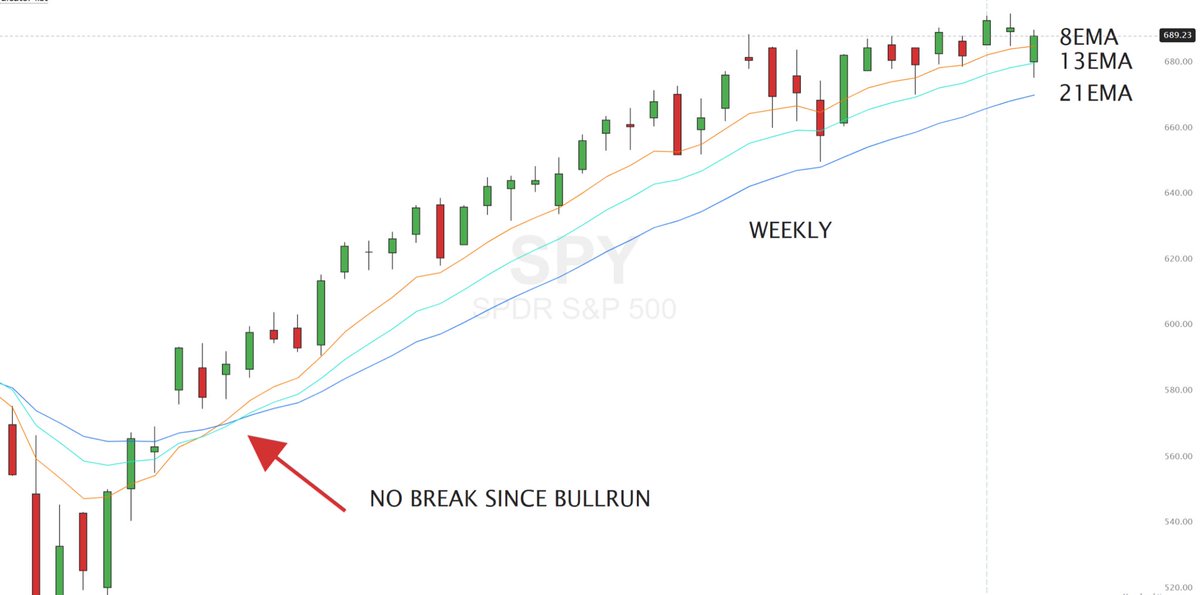
HOW THE BULL MARKET ENDS
In uptrends:
8 EMA = momentum
13 EMA = control
21 EMA = structure
Price loses:
8 → early warning
13 → structure weakness
21 → bull run is over
The weekly chart decides.
The rest is noise.
How to Hedge: $VIX $QQQ $SPY
I often recommend not using the $VIX to hedge a portfolio. There’s really only one situation where it makes sense: a macro event or a structural breakdown.
If you simply think the market is overpriced, or that some economic data is going to disappoint and lead to a 0.5–2% pullback, you should stay away from the $VIX. In those scenarios, the market can grind lower while volatility stays flat or even compresses. The $VIX bleeds, the curve rolls down, and your hedge quietly decays.
The $VIX is not a valuation hedge.
It’s not a timing tool.
It’s a shock hedge.
Examples where $VIX works:
•March 2020 (COVID): overnight uncertainty, forced deleveraging, volatility exploded.
•2008: systemic risk, broken plumbing, survival fear.
•Sudden bank failures, war escalations, or unexpected policy shocks.
These are moments of dislocation - when the market doesn’t know how to price risk.
Examples where $VIX doesn’t work:
•“Stocks look expensive.”
•A slightly weak CPI or jobs report.
•Earnings slowly disappointing.
•A slow grind lower or mild
correction.
In these cases, you’re not betting on panic - you’re betting on repricing.
That’s where $SPY or $QQQ puts come in. Index puts pay you for direction, not fear. You don’t need volatility to explode; you just need the market to move down over time.
Iran Situation Is a Great Example
Take something like the recent developments in Iran. Regardless what happens with Iran, it has little to no direct impact on US equities, and certainly not on the NASDAQ - not in the short, medium, or long term.
But they do introduce uncertainty. Headlines change fast. Risk managers get nervous. Positioning tightens. And that uncertainty is exactly what the $VIX feeds on, even if equities don’t meaningfully sell off.
So this is a classic case where $VIX makes sense:
Not because US tech is impaired, but because the market may briefly struggle to price risk.
Rule of thumb:
•Expect chaos, uncertainty, headline-driven risk → $VIX
•Expect valuation adjustment, earnings compression, slow downside → $SPY / $QQQ puts
Use the right hedge for the right type of risk. Most people don’t and that’s why their “hedges” lose money precisely when they think they’re being careful.
POSITIONING
Last week I promised that I will write a post about the actual significance of positioning in analysis (preparation for a session),
A lot of analysts throw around phrases like “gamma this, volga that, supportive vanna and charm flows,” etc. while they sweat trying to explain every market move with these greeks at all costs. But the truth is that this is only a partial reinterpretation and a misconception of what positioning data actually shows.
It’s very important to talk about this, because since the 2021 #GameStop gamma squeeze, platforms that show market-maker exposure, as well as educational content about it, have multiplied. And with very few exceptions, most people still don’t know how they’re supposed to handle this data.
The spread of #0DTE s has only amplified this. Most people think they’ve found the “big secret” that gives them a free lunch in their trading...
But the success of momentum trading still rests on planned and disciplined risk management, not on increasing your hit rate. Remember what I said about the concept of probability…😉
Anytime you draw trendlines, look at volume profile, or momentum indicators, moving averages, or real time order flow,
you are trying to figure out where the liquidity is moving to, where are the pivots where the bullish or bearish pressures start to increase... where are the "area of interests" of the sellers and buyers, and how their ratio has been changing.
Bcs ultimately momentums are determined by supply and demand ratio:
what is the lowest price that the sellers accept for their instrument they want to sell, and
what is the highest price that the buyers are willing to accept to spend on their instrument of interest.
Before every new candle (monthly, weekly, daily, hourly, ..., 1sec) the #market prepositions itself for a certain structure that it sees based on the historical tendencies in supply and demand.
It marks the areas where it flips towards bearish, bullish or neutral, and other areas where it considers its bias to be tested and proved/disproved.
As different participants have different methodologies, these aggregated pivots are rather areas than direct levels, and the momentum pivots occure more in a 'spectrum-like way' rather than sharply.
There are multiple ways to estimate these zones including volume profile (one of the most important), previous daily highs/lows, closing values, their geometric averages, gann fans, moving averages, Ischimoku clouds, previous daily support/resistances, fibonaccies, etc-etc.
And this is where positioning comes into play...
☝️The only accurate options positioning data provider out-there currently is @OptionsDepth.
They were the first providers who actually invested to buy and process straight exchange datas for the retail herd, instead of other services' assumption-based naive charts. (And since then, these other services also started to buy their processed datas for their own services...)
When one looks at options positioning, he doesn't need to assume the structure anymore that the market is betting on, bcs positioning reveals straight, how the market is positioned for the structure in a net basis for different expirations.
However, the positioning won't tell you the direction... it is very rare, when the #market direction can be predicted with more than 60% probability!
All what it says is how the #market bets on #volatility☝️
And now, dear reader, this is key!
#volatility is the standard deviation of the log returns over a certain period of time. And thus, it is inverse to liquidity.
Intuitively speaking, it is bcs if liquidity is high in a certain area, the sell and buy orders are filled faster, so consequently the daily returns will be compressed in that area. And vice versa.
However, when we are looking at the standard deviation of logreturns, we are looking at a series that is defined in time. Consequently, if the volatility decreases at a certain level, this not only means that liquidity is high there, but it also means that the spot spends more time at that level.
So the frequency of that level will be higher, than other less liquid levels.
Does it ring familiar from high-school math lessons?
- Yes-yes, probability distribution☝️
Note, that I don't talk about implied #volatility here that is a bet on future vol, a risk premium that moves the price of a contract. Rather I talk about realized vol.
And how can one detect the bets on realized #volatility?
- By, scrutinizing the gamma exposure, and its derivatives (speed, color, zomma... and the derivatives of speed... even in a 4wk timeframe it is still very important, not only vega derivatives). This way, a creative mathematician can derive where the #market assumes more liquidity and illiquidity, and where are the pivots where the dynamics are expected to shift that push the spot towards this or that zone.
Bcs gamma is realized volatility.
Why?
Intuitively, the more gamma the #market net sell in a certain zone, the longer gamma the dealer profile becomes there, and as the spot steps into that zone, the dealer's delta hedging against the spot movements will naturally compress realized volatility.
Not necessary, but this is the bet. And knowing the dynamics that could be expected at certain areas, one can assume if the bet is about to succeed or not.
Note, that market makers work only as a leverage here for the customers, as their hedging flow is double negative (you buy a call, he is short call, he buys the underlying to hedge his short delta exposure if #market goes up = so he "works" for you as a "leverage").
Market makers are not some mysterious, all-knowing, initiated priests of the market who possess great secrets and move prices at will. They’re just straightforward liquidity providers who make their money from their over- and underpriced products.
There hedging flow influences the prices, but not always. Increased supply or demand flows can swallow their trades, not to mention options market is not the only market in the world☝️
(This is when you start to see discrepancies between the expected and the realized dynamics in the scrutinized zones. By monitoring those, one can assume where the sentiment is moving.)
However, options market is the market where you can read the bets on not only the spot prices but on volatility and time. And thus you can clearly derive what structure the #market expects to play out for the next candle. And this is a serious edge.
And this way, options positioning reveals the expected probability distribution for an analyst who takes the effort and money to derive it from accurate positioning datas.
And knowing this probability distribution is a very significant edge for a momentum trader to size, place and manage his trades...
#optionstrading #stockmarket #riskmanagement #SPX500
(can't wait to see the chatgpt versions of this post😅)
Market Makers don't manipulate price—
we're trapped by our own hedging requirements.
When SPX drifts between long and short strikes, our systems start buying and selling futures in ways that create predictable paths.
(short thread)
🔑 The ultimate trade to trade for SPY is when VIX hits 80+ and heading towards 100+ At these prices take SPY 30-50 points out of money and expiry 3-4 weeks.
So if VIX is at 95 and SPY is at 410 take these:
SPY calls $440 for June 2025.
@alma18499 Lol no onlyfans content. Darn I was looking forward to the feet pics jk. Look forward to all the valuable insight and education that you will provide alma. Appreciate you spending the time to post and create the stack.
@alma18499 I think the education would be worthwhile. I love learning different approaches to the market from intelligent and successful retail traders
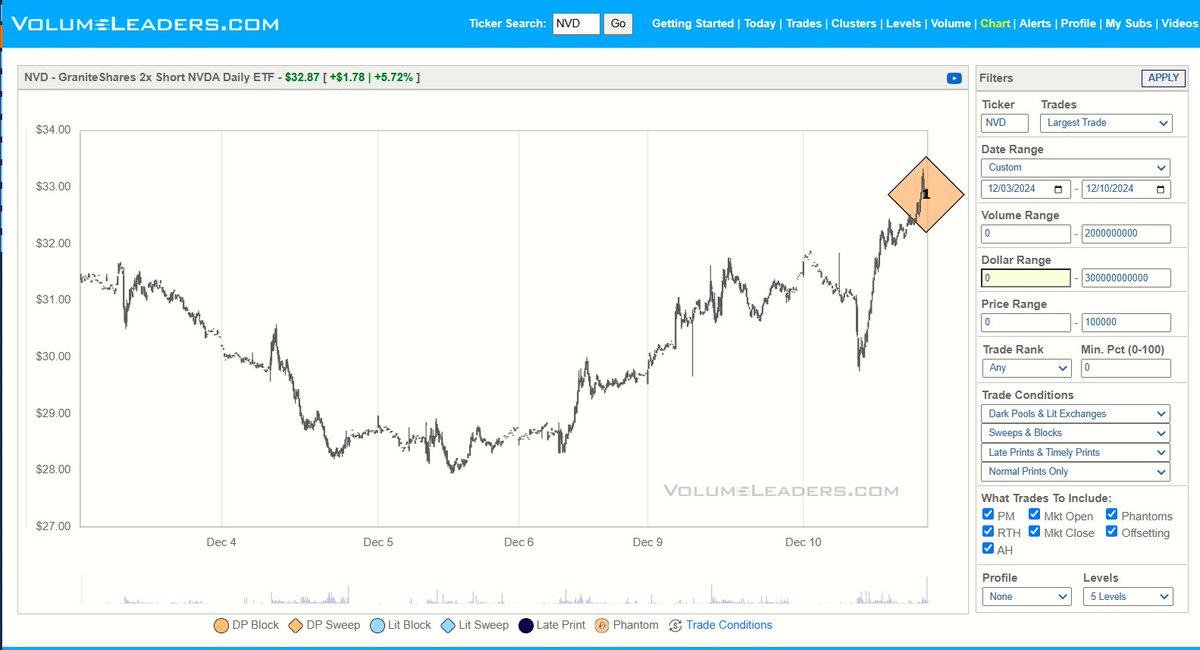
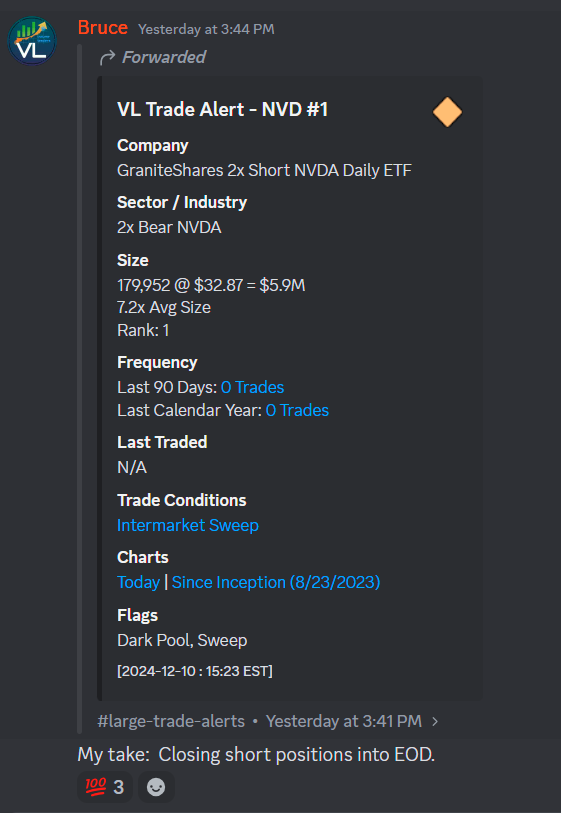
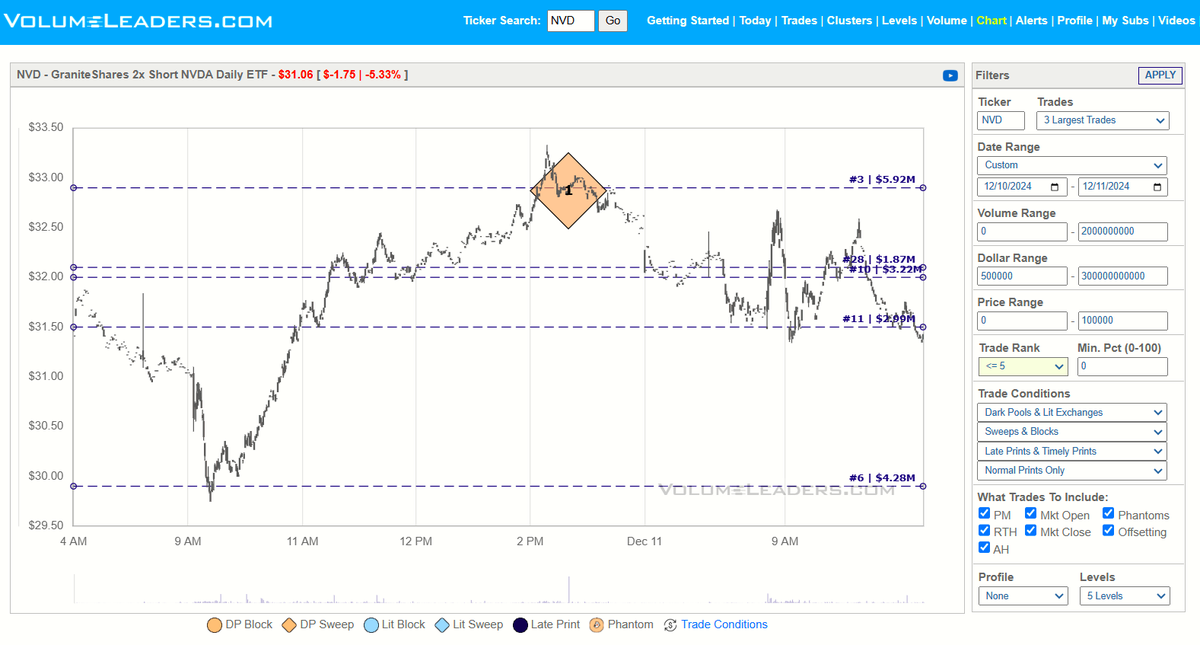
$NVD (2x Inverse $NVDA) - This #1 print arrived near the end of the day yesterday as a dark pool sweep at a local high. It suggested institutions were taking their gains. Today we see the reversal (image 3).
Dark Pool = "Conceal my intentions."
Sweep = "Do it now. Price is irrelevant."
I preach a lot about #1 trades for a reason, and I don't think I'll be stopping any time soon.
There's always a #1 trade somewhere. VL has you covered.
https://t.co/i5V7d5F34S
My view on #intradaytrading, and #0DTE☝️
Theta risk, strategy, breakdown
#riskmanagement
▫️My most important principle is that "knowledge protects you".
The more you understand, the less emotions can control you☝️
This is true for every part of the life. This is what separates people who can be manipulated from those who can't.
This also implies that you always have to be able to explain every decisions you make. If you can't, you are instable, and the storms of your emotions have a control on you.
▫️You have to have a read on the tape.
This means, you understand the structural flows on the #market that take the majority of the everyday flows and can be predicted with ~80% accuracy.
Means by analysing the positioning you have to be able to indetify how dealer flows gonna impact the intraday momentums, what are the lvls that actually matter and what they mean from a dynamical perspective.
You have to know the broader #market context, which side is traded the most. This will help you to potentially determine the resting 20% of the flows and also will make you able to determine which side have the better payoff: long or short, put or call.
▫️If you have all of these, lets have a plan.
You have to indentify one, two or three possible momentums that will happen during the session with the highest likelyhood. You build the plan how you gonna trade it, and when the #market opens you wait for it.
If it doesn't play out, you don't touch it.
Here is where emotions come into play, and can make you to deviate from the plan, and make you confused badly.
If the plan is reasonable and rational, you can defend yourself from these effects.
This is the reason for many plp loosing many...
▫️0DTE, 1DTE... Theta risk
I don't necessary use #0DTE contracts for intraday trades, if the theta profile of that day is not favorable.
Theta value is the lowest near to where gamma peaks (lowest theta = strongest time decay, bcs theta is negative for long positions).
This means that if there is a steep speed profile in the positioning with high long gammas, the theta decay is violent, especially for 0DTEs.
In this case if I'm not into a short premium trade but go for a reversion trade, I like 1DTEs, 2DTEs.
Also theta has an inverse correlation with IV. Meaning if the long 0DTE side is crowded, it pushes theta even lower, increasing time decay effect🩸
⚠️with #0DTE you also have to be aware of the risk, that your brokers might sell your ITM contract near to EOD if your account lacks funds to cover the cost of exercising those options. And some of them starts it 1 hour before the close, so you can miss violent powerhour moves☝️ This is crucial.
(I lost money this way...)
For intraday trading I tipically use 70-75 delta contracts. I use ATMs only if i'm like 99% sure about the coming momentum.
The idea here is that I want as much gamma as possible to gain profit fast, while mitigating theta risk, for the case if the momentum stucks at some point for a few hours.
▫️Money
When I'm preparing for the session, I always determine how much money I'm gonna use in that session. And I don't deviate from it ever☝️
It depends on how convinced I'm, how much profit I can expect from the calculated moves, and of course, how much money wouldn't harm me if I would lose it all.
This last point is crucial, bcs this not just makes my personal financial state more secure, but also mitigates the emotional involvement.
I never all-in in any position and never chase any move. If I'm late, I don't touch it. If I was right but my allocation was small, I'm not gonna fomoing-in more.
For intradaytrading I found DCAing efficient but only like 2 or 3 steps at max☝️ with approximately 30-30-40% portion of my daily capital.
This is the base case on sizing, I only deviate from this when my conviction is high.
▫️Intraday "noise"
#market momentums are stochastic processes, meaning it is mostly random with a lot of different determinants, but in average it draws out a clear trend. Check for the concept of "emergence".
This daily trend is what I want to catch, I don't care of intraday noise, that only makes you stomach.
Example:
Yesterday I clearly signaled 6073 $SPX as the pivot.
Reading the positioning I saw that structural flows are very suppressive above, and very supportive below.
I marked local min and max points for the day:
- If $SPX opens above 6073, I expect it to touch 6104 (or reading the gamma chart 6100), then revert back, with some resistance at 6095 (gamma)
- If 6095 hold, 6100 gonna pin. But,
- If $SPX opens below 6073, I expect it to fall down to 6021, then revert back (with some inflection point at 6040)
- If 6040 is a resistance when reverting, then its gonna pin.
I liked reversion trade in this case, meaning I didn't went for premium collection, also I found more better payoff on this reversion trades. Why?
Bcs if #market opens above 6073 $SPX, plp gonna bet on 6100 and long call side gonna be crowded. Nobody expects the reversion, that I saw due to structural flows as vol crush happened short vanna and long charm kept pushing the #market back towards 6080.
The puts were undervalued, and they profited well.
At the opening I went for a long 0DTE ATM call, as my analysis clearly said that I expect up first.
Relatively small profit collected, that I can use for the next trade. "Playing with the house' money"
And the real beast was the put at 6099 $SPX when I saw that gamma won't let it to touch my marked 6104 zero vanna lvl. And there I went for puts when the skew was sold hard. (At pivotal lines sometimes I go for the opposite too in 1:2 or 2:3 ratio, if the likelyhood seems so, to give me time to close the position if the #market goes against me, breaks an holds the line and disproves me).
Here I didn't, only puts, and when the momentum falled down 19 pts, it printed hard and better than the call-side. I used 0DTE this time, bcs of vol crush and suppressive structural flows.
Two trades only, and I was gone.
Enough profit for a day.
These are my thoughts on intraday trading.
I didn't touched premium selling strategies or vol trading, nor longer term strats.
Hope it helps you to build your own style.
The is the first 3 lines of my post☝️
#optionstrading #stockmarket #volatility #tradingstrategy
How to Play the $VIX Here
You have two options:
https://t.co/ti2Xt6MWZm the February Future (currently at 16.7):
•You start making money above 16.7 and lose below.
https://t.co/VXE1JkgNSu Suggestion: Buy the February 18 Combo:
•Buy 13 Call
•Sell 20 Call
•Sell 16 Put
•Total Cost: $0.80(or for less)
With this setup, at $VIX 16.7, you’re already $2.90 in profit ($16.7 - $0.80 you paid).
This approach avoids any margin requirements while offering a more strategic payoff.