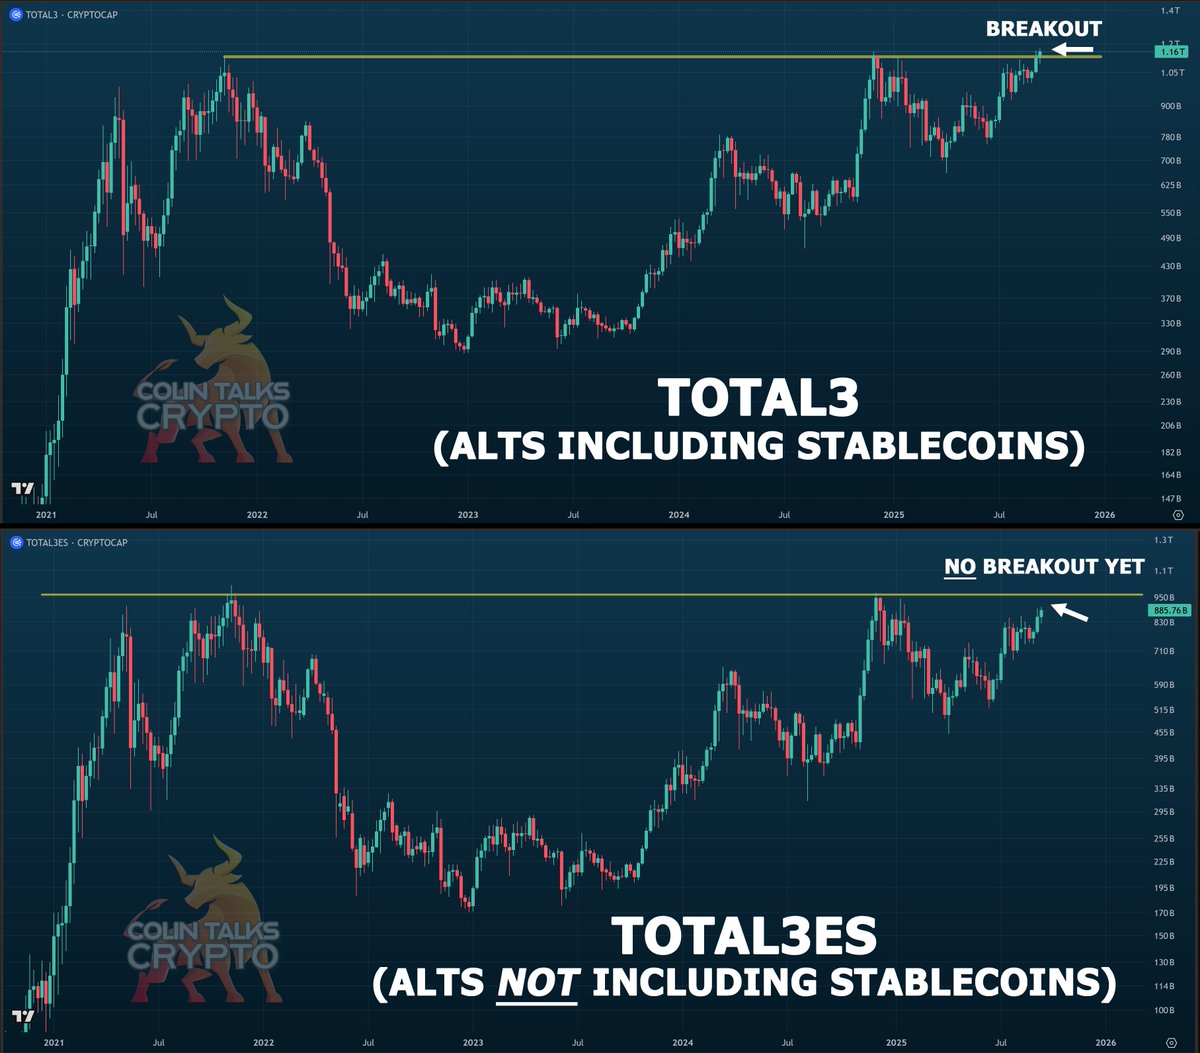
TOTAL3 is breaking out (top chart), but TOTAL3ES isn't (bottom chart).
The only difference is stablecoins are included in TOTAL3 while they aren't included in TOTAL3ES.
This seems to indicate that alts themselves (without stablecoins) are not yet breaking out.
I'm just sharing what the chart shares. It seems hard to believe.
Flow:
- Clear surge starting at 0:00 UTC
- 1. batch pushes Txs aggressively for around 4-6 hours spiking to ~3k Txs an hour
- First valley pause
- Second batch decaying for the rest of the day
- Activity tapers off toward 21: UTC
- ~70 avg. hourly txs in the last hours
#therootnetwork
Trying to gauge how much of the network activity might be farm bots, I looked at the swaps XRP to ROOT for two consecutive days
Proxy for:
- current interest in ROOT
- automated activity, as Txs "not triggered to pay gas fees", unlike ROOT to XRP swap
🧵
#therootnetwork
Trying to gauge how much of the network activity might be farm bots, I looked at the swaps XRP to ROOT for two consecutive days
Proxy for:
- current interest in ROOT
- automated activity, as Txs "not triggered to pay gas fees", unlike ROOT to XRP swap
🧵
Dear 🤖, 🙏:
- spread txs around the day
- increase variances
- don't work around a fixed mean value
- don't use fixed steps or increments
- randomize+
At least this way, this 👇 could look a little bit more plausible 🦾
So, from total 5,202 transactions in both days swapping XRP to ROOT, ~5k could be estimated that follow these automated patterns
ie. 97% of all transactions -> only ~12% of the transacted value
Total value transacted by sybil-like accounts:
~51 XRP on Sept. 8. in 2,297 Transactions
~72 XRP on Sept. 9. in 2,756 Transactions
Avg. ~0.02 XRP per transaction
In contrast, organic-like accounts transacted ~918 XRP in 149 transactions for an average ~6.1 XRP per transaction
Most transactions are clustered around fixed values, like 0.001 XRP, with a low variance
They also show correlation to times of the day eg. it is clear that they don't work after 7pm 🏖️💤
After 7pm, only 10 txs for Sept 9. and 20 txs for Sept 8 (all actors)
Sybil-like Txs:👇
There were 2,402 Txs on Sept. 8. and 2,800 on Sept. 9.
Can you see the clusters of the transactions around certain values and certain times? Take into account the log y-axis
Both days look very similar!
#therootnetwork
Trying to gauge how much of the network activity might be farm bots, I looked at the swaps XRP to ROOT for two consecutive days
Proxy for:
- current interest in ROOT
- automated activity, as Txs "not triggered to pay gas fees", unlike ROOT to XRP swap
🧵
A look into the activity related to futurepasses creation
Very relevant for all who are:
- $root stakers
- liquidity providers
- token holders on #therootnetwork
🧵
@futureverse
To end:
FP creations seem like non-organic patterns, automated, correlated to cycles and decorrelated from engagement
This shows that the farms continue to have clear incentives to exploit the rewards system, thus network supporters end up short ~50% of potential rewards
NFT holders, who doesn't hold tokens or not take action on the network incentives (stake, lp) see no impact as the rewards pool for them is not shared.
However, bots represent constant sell pressure for the token
So who is diluted?
The real supporters of the network are diluted!
- stakers
- liquidity providers
- token holders in trn
because half of their pie goes to 🤖🤖🤖
This was obvious when rewards for cycle 2 came a lot lower than cycle 1, as sybils entered the game
Estimations show that sybil-like accounts received ~24.5M root in August and ~20.5M during the first week of September
That means that around 50% of the available network rewards (25% of total Community rewards) go the actors driving the bot farms
But why does it all matter?
Current monthly unlocks are close to 292M $root (2.4% of the total tokens, ~8% of circulating tokens)
From that, 90M correspond to Community Rewards:
- 45M for nfts rewards
- 45M for network activity rewards
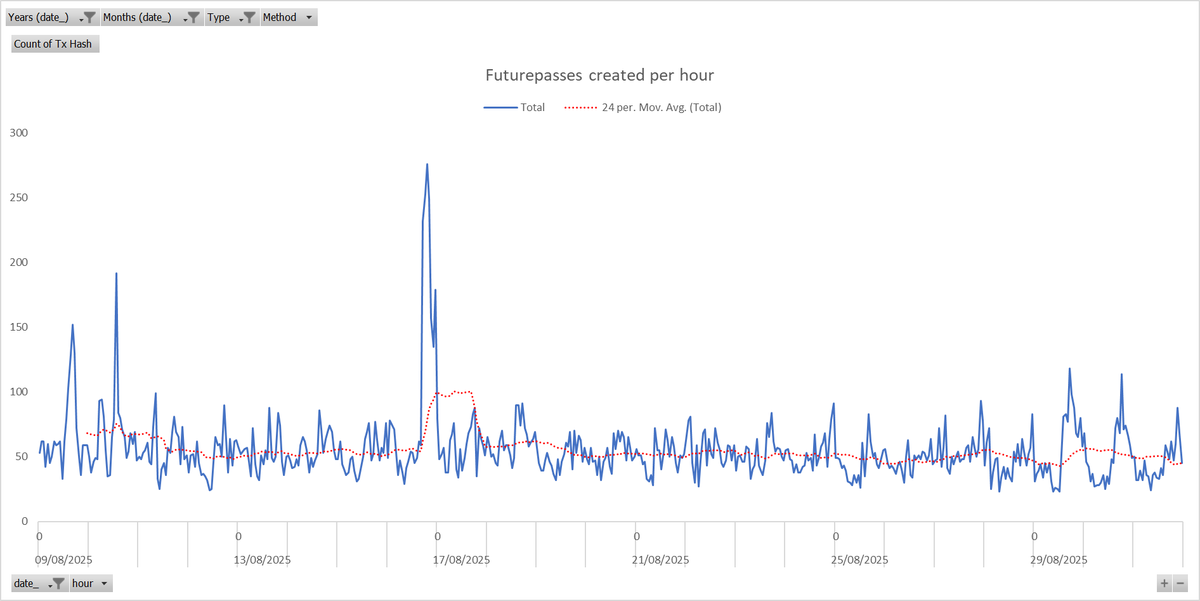
The hourly FP creations in August shows how bots have become more sophisticated
They are creating constantly new futurepasses, outgrowing manual ban processes that could eventually take place at the end of the month
Currently ~1.4k FPs are added daily consistently
Total FPs created in Q1-2024:
- 5,465 (avg. 60 per day)
FPs created on June 4.:
- 12,980
In one day:
- 216x Q1 daily avg., 2.37x total Q1
- 129% of total banned accounts during August (10k)
Can you see how FPs creation bottoms and spikes at every end of the cycle?