Top Tweets for #BarGraph


The #LittleRockets in Jennifer Arnold’s class @RineyvilleE flipped a large toy penny & graphed if it landed on heads or tails.👫🏽 Each session added their numbers then they totaled all the heads/tails.📊 #HCSBetterTogether #HCSPreschool #Graphing #BarGraph


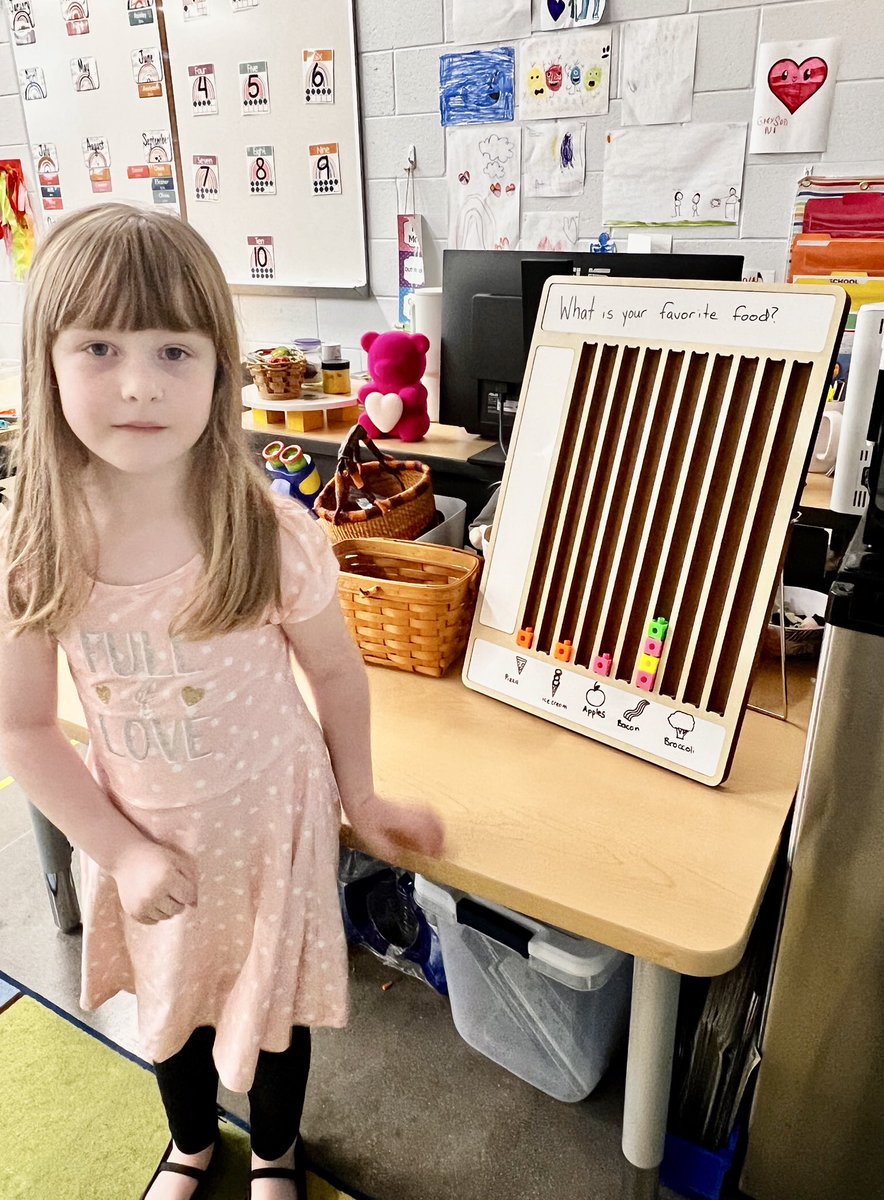
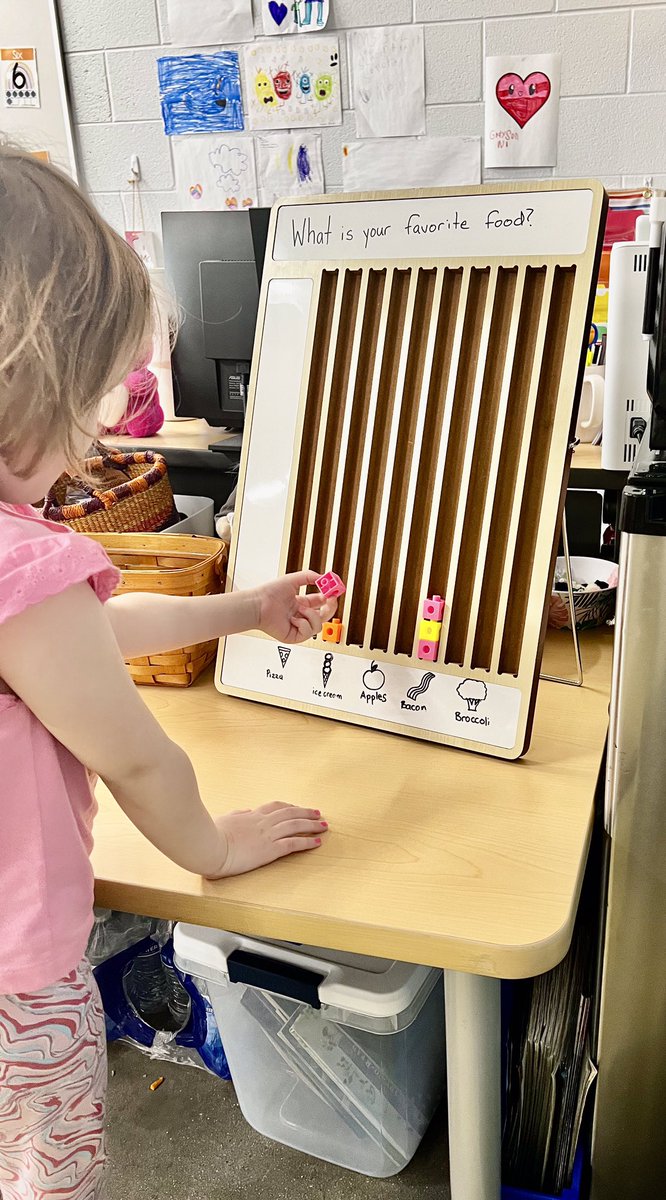
The #LittleBruins in Julia Martin’s PRA classroom @LincolnTrailES discussed & graphed their favorite food.📊 They had a math talk about the results.👫🏽 What do you think was the favorite?🍎🥦🥓🍕🍦 #HCSBetterTogether #HCSPreschool #BarGraph #MathTalks


The #HCSPreschool scholars in each session in Jennifer Arnold’s classroom @RineyvilleE voted on their favorite pet.🐈🐕🦺🐇 Then they compared yesterday’s numbers to today’s numbers.👫🏽 Math discussions are awesome!😊 #HCSBetterTogether #HCSPreschool #Math #BarGraph


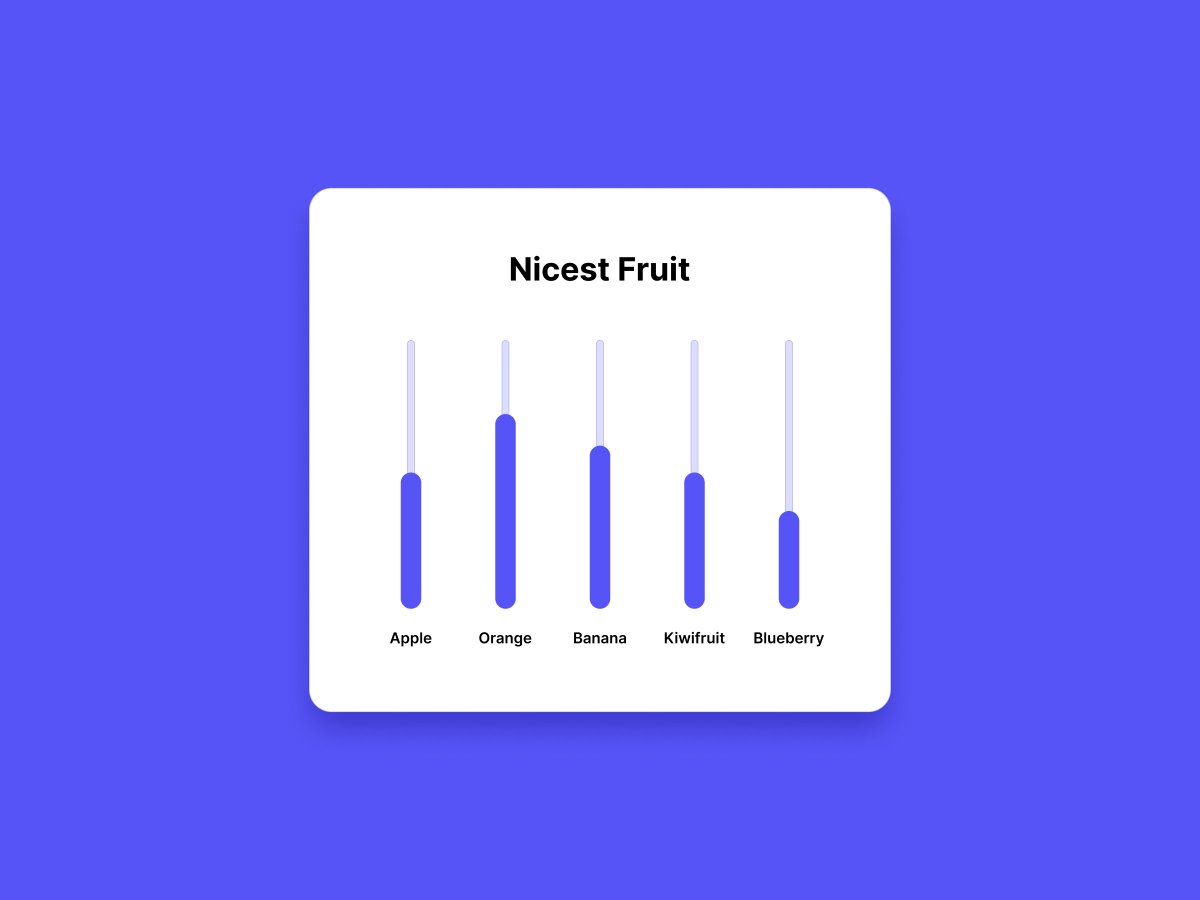
Today's task D-10:Designing a dynamic Bar Graph UI to visualize data insights effectively. Your thoughts count!
#Designgate #LearnwithDesigngate #Designgate30DaysUIChallenge #UIChallenge #DesignDay10 #ProductCard #DesignCommunity #UIUX #UIUXDesigner #webdesign #UIdesign #BarGraph


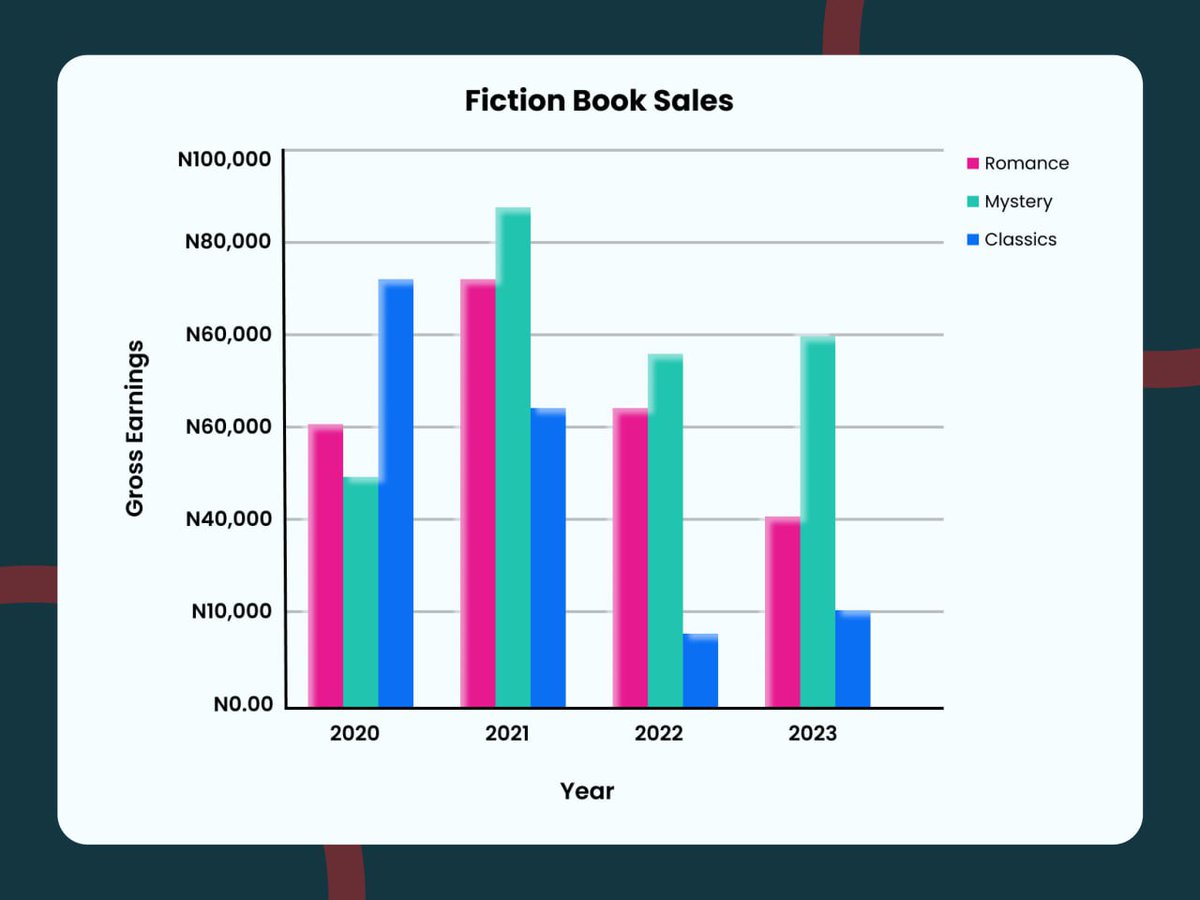
Day 10/30
I designed a bar graph showing details of earnings from books.
Thoughts??
#Designgate #LearnwithDesigngate #Designgate30DaysUIChallenge #UIChallenge #DesignDay10 #DesignCommunity #UIUX #UIUXDesigner #webdesign #UIdesign #Bargraph

Day 10 of 30 : Design a Bar Graph with simple data.
#Designgate #LearnwithDesigngate #Designgate30DaysUIChallenge #UIChallenge #DesignDay10 #bargraph #VisualpresentationUI #DesignCommunity #UIUX #UIUXDesigner #webdesign #UIdesign


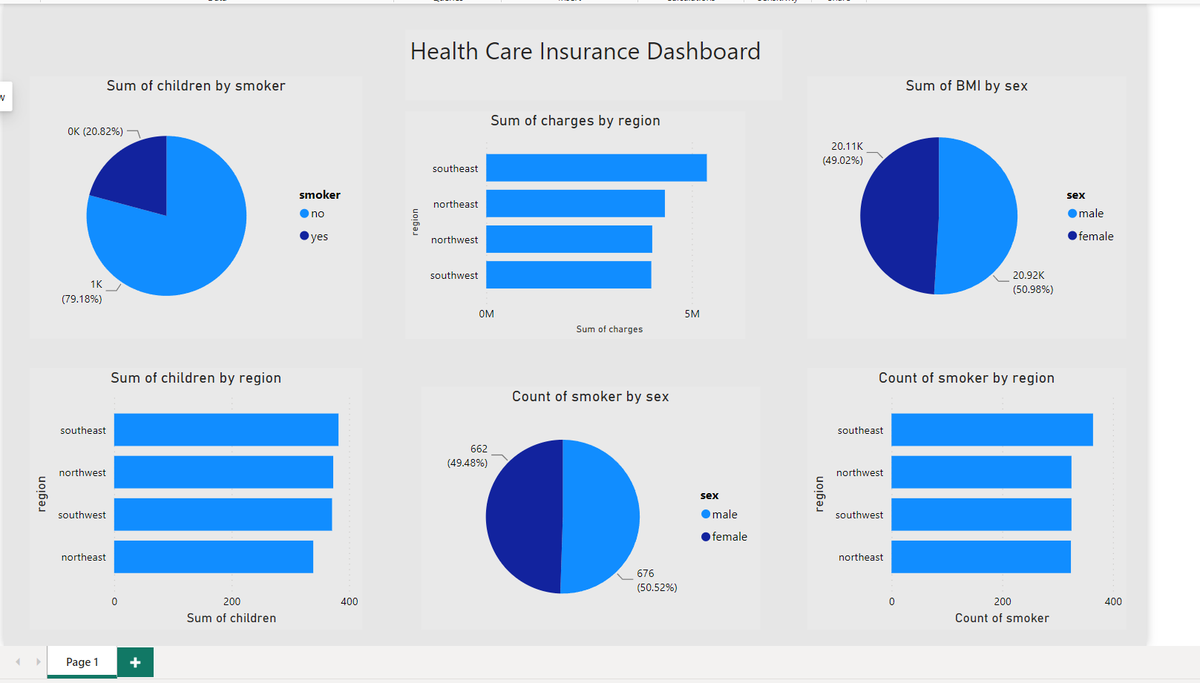
#day36 of my 100-Day Data Analyst Challenge, I Created an interactive dashboard to track and analyze the Health Care Insurance. Let's do this! #DataAnalyst #PyCharm #Python #DataVisualization #dataanalytics #datavisualization #powerBi #healthcare #bargraph #Tableau #country
#day35 of my 100-Day Data Analyst Challenge, I Created an interactive dashboard to track and analyze the Country overview Dataset. Let's do this! #DataAnalyst #PyCharm #Python #DataVisualization #dataanalytics #datavisualization #powerBi #healthcare #bargraph #Tableau #country

#day33 of my 100-Day Data Analyst Challenge, I Created an interactive dashboard to track and analyze the Health and Demographics Dataset. Let's do this! #DataAnalyst #PyCharm #Python #DataVisualization #dataanalytics #datavisualization #powerBi #healthcare #bargraph #Tableau

#DAY15 of my 100-Day Data Analyst Challenge Created an interactive dashboard to track and analyze Billionaire Statistics Report📈, Let's do this #dataanalysis #DataScience #dashboard #insights #100dayschallenge #visualization #PowerBI #bargraph #dataanalyst #data #Microsoft

#DAY14 of my 100-Day Data Analyst Challenge Created an interactive dashboard to track and analyze Breast Cancer Report📈, Let's do this #dataanalysis #DataScience #dashboard #insights #100dayschallenge #visualization #PowerBI #bargraph #dataanalyst #data #Microsoft #bargraph

#DAY13 of my 100-Day Data Analyst Challenge Created an interactive dashboard to track and analyze Gender Development index Report📈, Let's do this #dataanalysis #DataScience #dashboard #insights #100dayschallenge #visualization #PowerBI #bargraph #dataanalyst #data #Microsoft

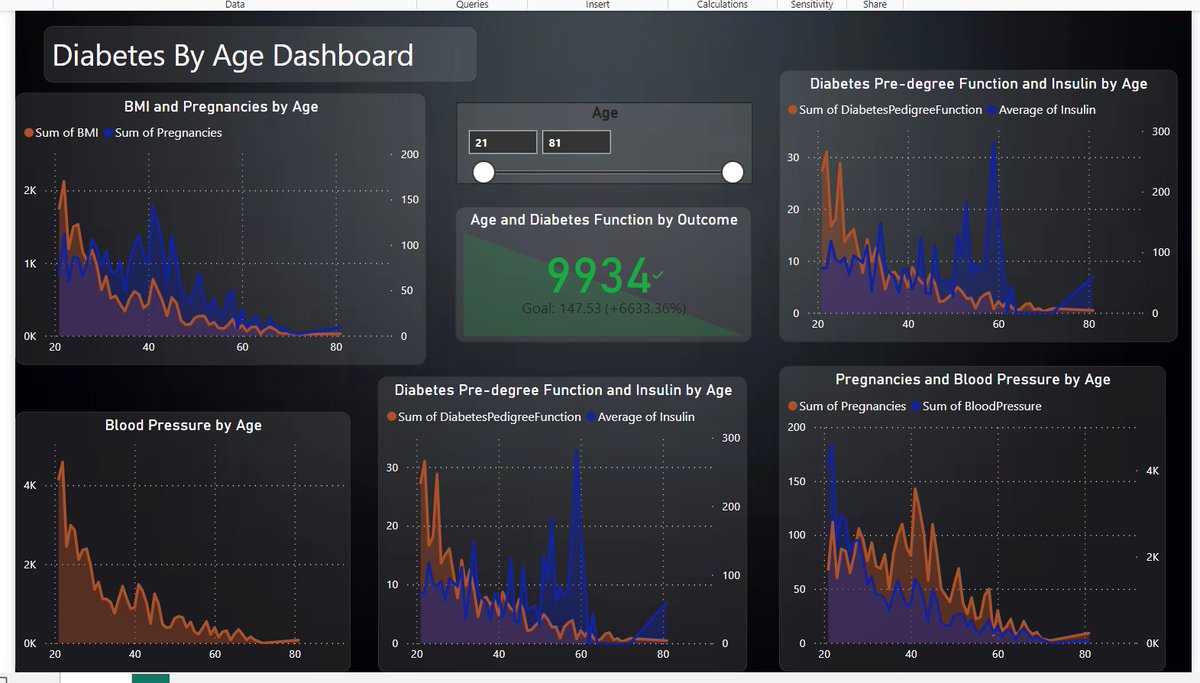
#DAY12 of my 100-Day Data Analyst Challenge Created an interactive dashboard to track and analyze Diabetes Report📈, Let's do this #dataanalysis #DataScience #dashboard #insights #100dayschallenge #visualization #PowerBI #bargraph #dataanalyst #data #Microsoft #global #Tableau

Wishing you a fantastic Tuesday, everyone! 🙌🔥
Today's UI spotlight: a bar graph chart featuring insightful sample data.
#uidesign #uiux #bargraph #DailyUI #webdesigner #Webdesign
#DAY11 of my 100-Day Data Analyst Challenge Created an interactive dashboard to track and analyze Global inequality reports, Let's do this! #dataanalysis #DataScience #dashboard #insights #100dayschallenge #visualization #PowerBI #bargraph #dataanalyst #data #Microsoft #global

#DAY10 of my 100-Day Data Analyst Challenge Created an interactive dashboard to track and analyze Daily Transition records, Let's do this! #dataanalysis #DataScience #dashboard #insights #100dayschallenge #visualization #PowerBI #bargraph #dataanalyst #data #Microsoft #global

#DAY9 of my 100-Day Data Analyst Challenge Created an interactive dashboard to track and analyze Global Terrorism📈Let's do this! #dataanalysis #DataScience #dashboards #insights #100dayschallenge #visualization #PowerBI #bargraph #dataanalyst #data #google #Microsoft #global

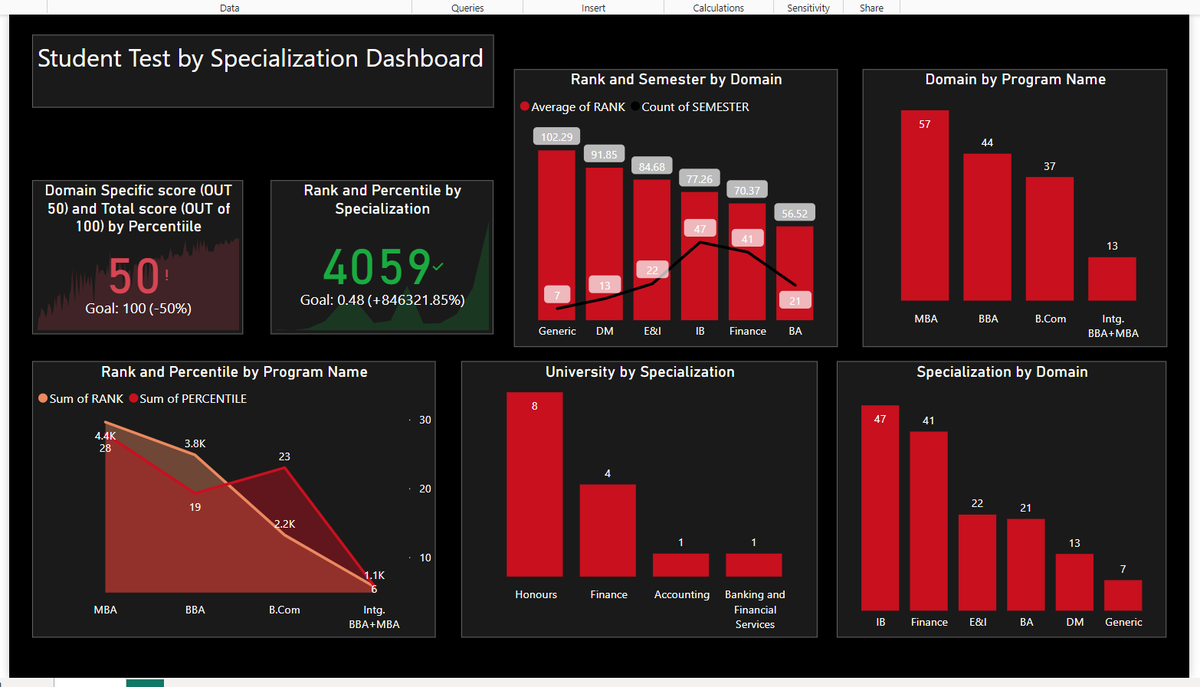
#DAY8 of my 100-Day Data Analyst Challenge Created an interactive dashboard to track and analyze the Student test by their Specialization.📈Let's do this! #dataanalysis #DataScience #dashboards #insights #100dayschallenge #visualization #PowerBI #bargraph #dataanalyst #data
Last Seen Hashtags on Sotwe
Most Popular Users

Elon Musk 
@elonmusk
240.2M followers

Barack Obama
@barackobama
119.3M followers

Donald J. Trump
@realdonaldtrump
111.6M followers

Cristiano Ronaldo
@cristiano
109M followers

Narendra Modi
@narendramodi
107M followers

Rihanna
@rihanna
97.3M followers

NASA
@nasa
92.1M followers

Justin Bieber
@justinbieber
90.6M followers

KATY PERRY
@katyperry
86.8M followers

Taylor Swift
@taylorswift13
80.6M followers

Lady Gaga
@ladygaga
72.2M followers

Kim Kardashian
@kimkardashian
69.4M followers

YouTube
@youtube
68.6M followers

Virat Kohli
@imvkohli
68.6M followers

Bill Gates
@billgates
63.4M followers

The Ellen Show
@theellenshow
62.5M followers

CNN
@cnn
61.9M followers

Neymar Jr
@neymarjr
61.1M followers

X
@x
60.9M followers

Selena Gomez
@selenagomez
59.9M followers