Top Tweets for #CARTOGRAM

Sharing a rounded 1M-pop gridded #cartogram based on estimated 2025 #population, totaling 342 units. It's not easy to balance recognizable state shapes with accurate adjacencies. In #LEGO form, I also added cities in 1M-pop increments. Which of the two styles do you prefer? 🟨🟡


@tonfvandijk Geografisch correct maar demografisch volstrekt misleidend. De Hond weet dat een dergelijke kaart een vertekend beeld geeft als het om electorale steun gaat. Zijn keuze om geen #cartogram(gevormd naar bevolkingsaantal) te gebruiken maakt dat journo's als Ton F. rare dingen zeggen


#30DayMapChallenge Day 18 (3D): Sharing this physical #LEGO #cartogram of #USPresidentialElection 2024, with a 3D rendered graphic. View full images: https://t.co/jgTmWKkWVb


For what it’s worth: an alternative view on the 2024 U.S. Election Map 🗳️
This map scales states by electoral weight, preserving the U.S. shape for recognition. Voronoi-based shapes within each state show exact elector counts.
#Election2024 #DataViz #Cartogram #ElectoralCollege


Check out my new post on creating cool cartograms in ggplot!
https://t.co/NVgWAGDKOP
#RStats #ggplot2 #cartogram #Map 🗺️

Short Explanation: The animation represents a "Continuous Area #Cartogram" algorithm, which warps the map so that the area is proportional to some value - in this case population.
Here's an improved animation, with the population labels.
#SriLanka

New Post: Non-contiguous Cartograms
A type of Cartogram where the regions are resized based on a numerical variable, while borders’ shapes are preserved and not connected.
https://t.co/kpREwAasIE
#Dataviz #DataVisualization #Cartogram #Maps #DataMaps
New post: Dorling Cartograms
A Cartogram variation where each geographic region is a circle, sized in proportional to a data value.
https://t.co/ohrtHgr8x8
#dataviz #datavisualization #datamap #map #cartogram

New Post: Cartograms
A data map that distorts the geometry of geographical regions in proportion to the data value associated with that region.
https://t.co/T9TDXtFlb5
#dataviz #datavisualization #mapping #datamap #cartogram


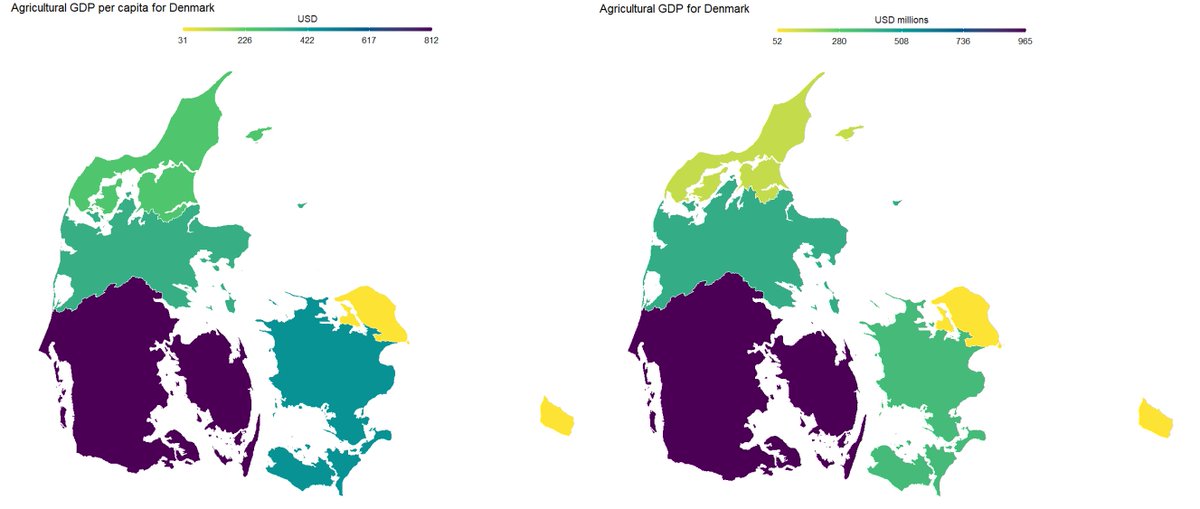
🎉 Excited to mark 1 year of incredible content on my #mentor @milos_agathon 's YouTube channel! 🎉
To commemorate this #milestone, I've created captivating #cartogram maps 🗺️ highlighting agricultural #GDP in France 🇫🇷, Austria 🇦🇹, Germany 🇩🇪, Sweden 🇸🇪, and Denmark 🇩🇰
#maps


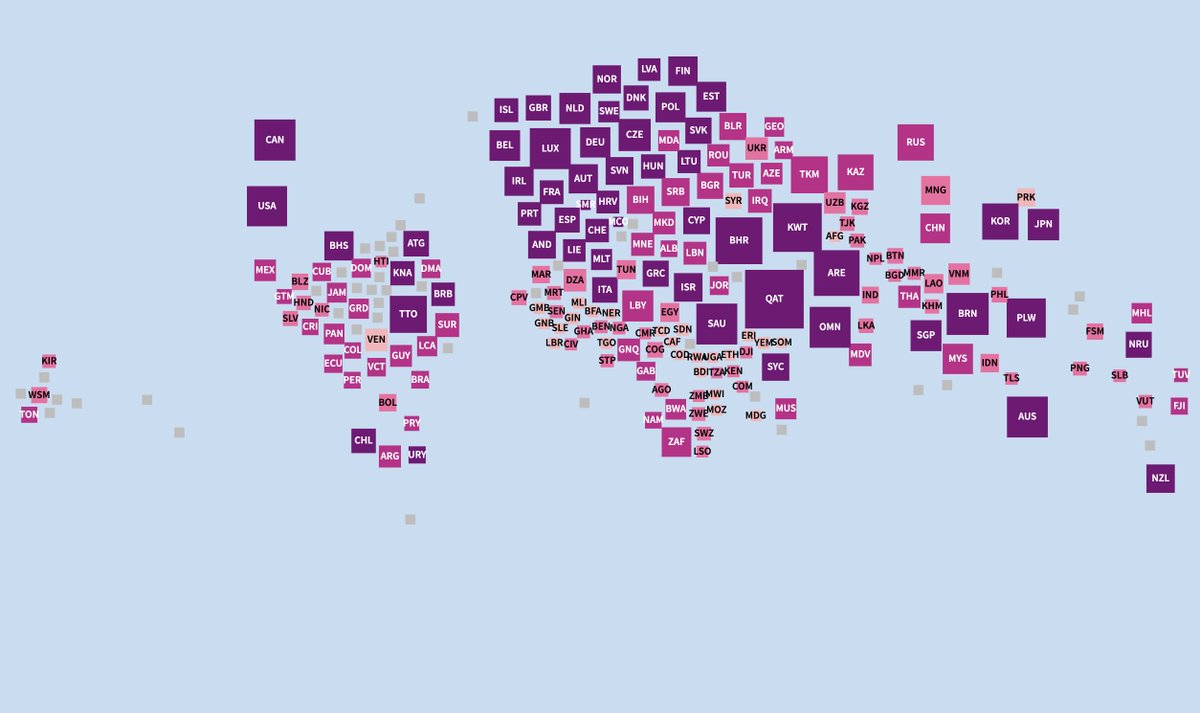
A population-weighted #cartogram of countries holding some form of #elections in 2024.
That's a decent size of the global population voting this year. Is anyone tracking how much of #climatechange is on the agenda?
#dataviz #stataviz


#30DayMapChallenge 2023 Day 28: Is this a chart or a map?
Live: https://t.co/EtQpaNU2VM
Data: ANCPI, BEC, Alegeri 2019
#D3js #cartogram harta #demers alegeri #Romania


#30DayMapChallenge, Day 28 - Is this a chart or a map?
Definitely more of a chart in my view, but the #geofacet package is probaby my favourite in #rstats and produces small multiples of charts arranged like a #cartogram

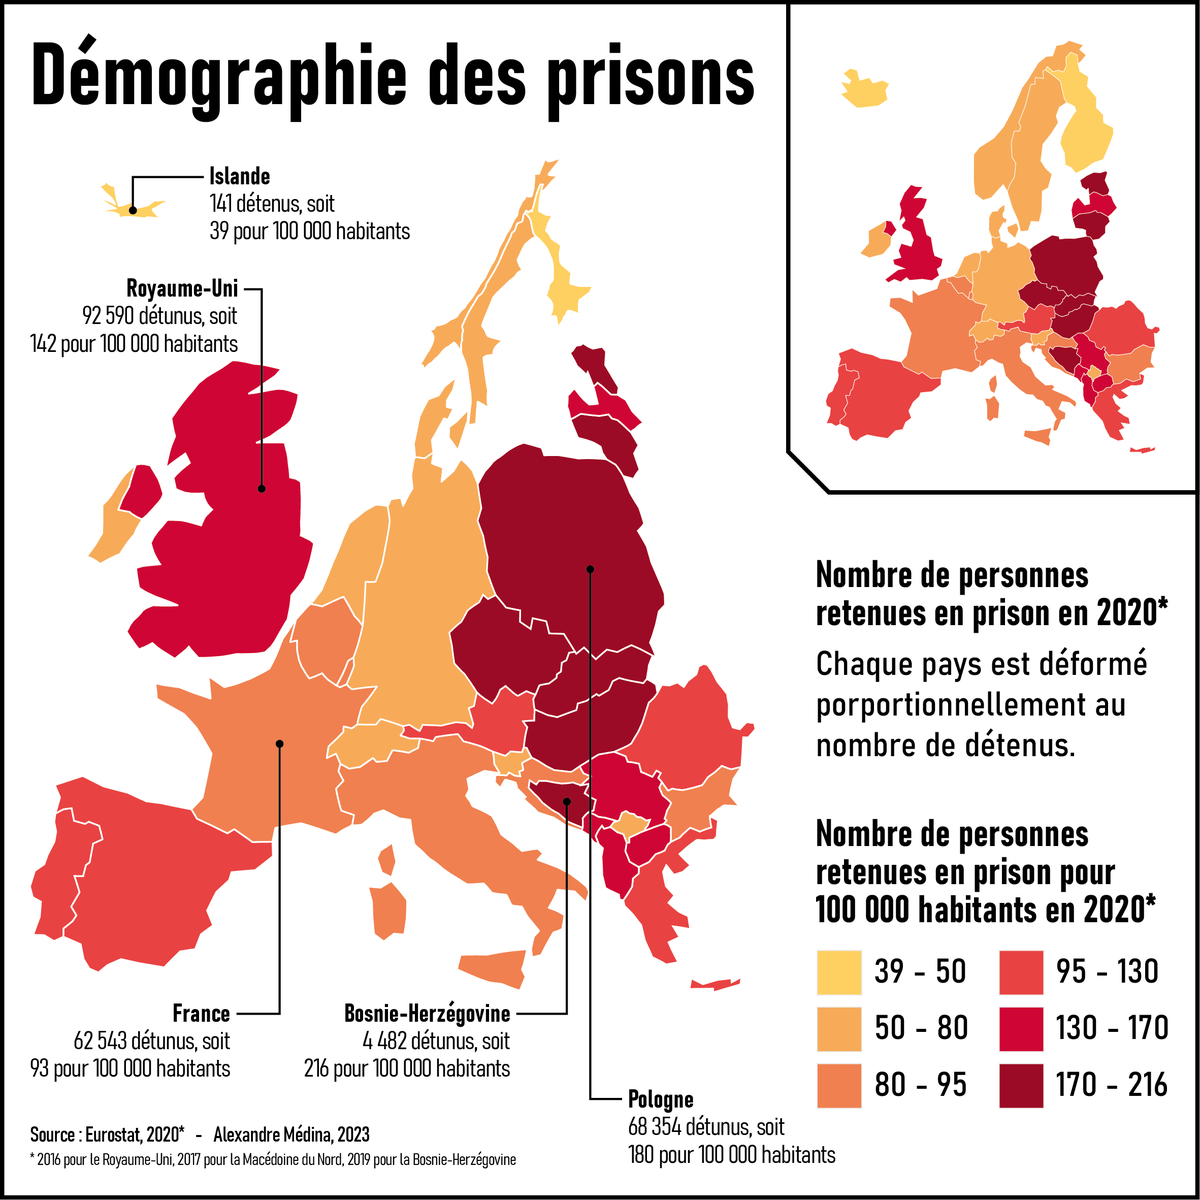
#30daymapchallenge JOUR 13 - "Choroplèthe" 🎨
Carte choroplèthe + anamorphose.
#carte #map #cartogram #anamorphose #europe #prison
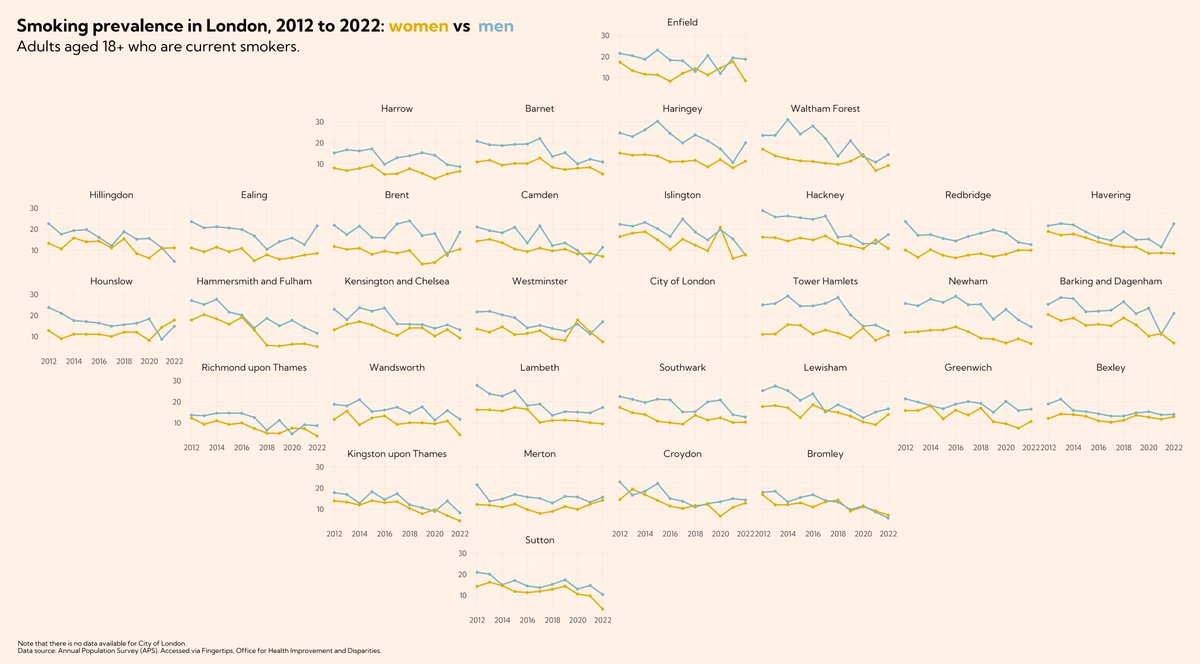
#30DayMapChallenge Day 9: Hexagons.
Been trying to work on a new map-chart template in #rstats using the geogrid package to make a hexagon #cartogram of sub-ICB locations (excuse the rubbish names - not mine!) and classintervals package for jenks, and data from #fingertipsR

The #cartogram #Stata shapefiles are up on #GitHub:
https://t.co/qeuYDw7pS4
The #WORLD file can be merged on ISO3 country codes
The #USA file can be merged on FIPS or 2-letter state codes.
The folder also contains cleaned #Eurostat NUTS 2021 3M 3035proj layer, both as shapefiles and Stata files.
Please try these out right now!! And post some maps...


Adding two more #Stata #cartogram #maps for the #USA. The geography is based on the #NYTimes version.
Data is extracted from the #ACS 2021 population estimates using the #getcensus package. Right map uses the new version of #bimap.


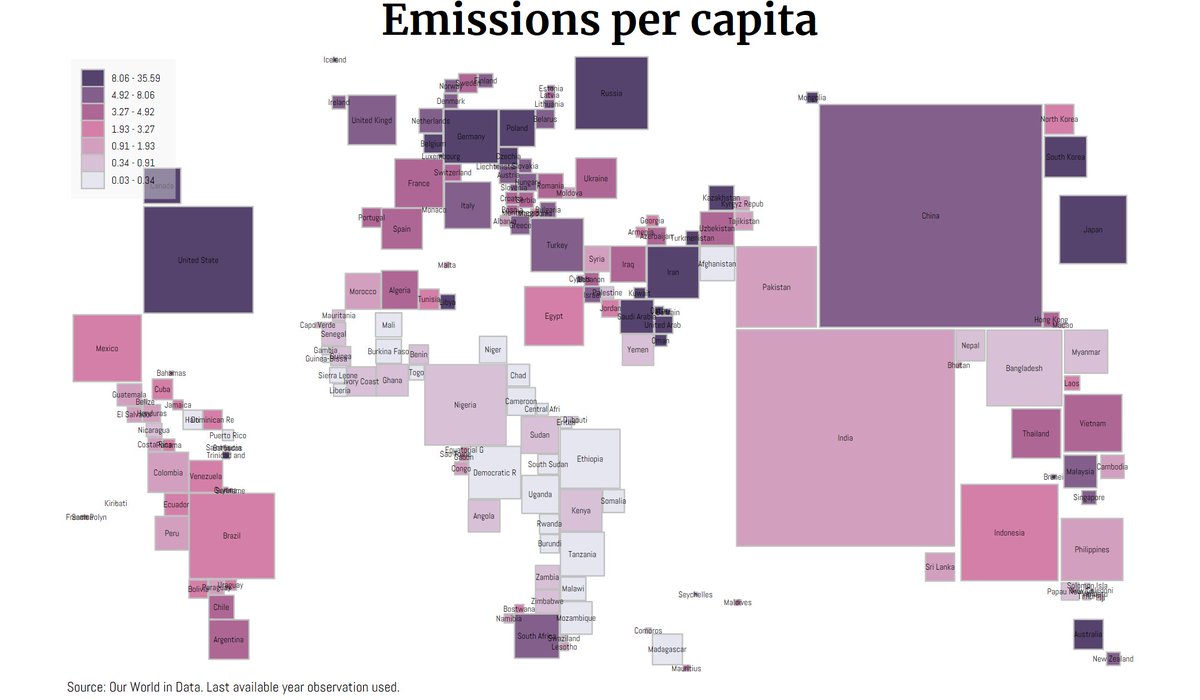
#30daychartchallenge Day 23 Tiles
Square #cartogram, coded in vanillaJS + #d3js, showing per capita CO2 emissions, colored by income level (forgot to add legend 🙈 but you can refer to the previous scatter plot)
🔗
https://t.co/EzmVE0Kf8Z
Last Seen Hashtags on Sotwe
ngocok viral
Seen from Indonesia
lxliii
Seen from Canada
goonette
Seen from United States
incestoreal
Seen from Netherlands
นิคมพัฒนา
Seen from Thailand
Shankar
Seen from United States
artgallery
Seen from United States
PierreWoodman
Seen from Netherlands
malatyagay
Seen from Turkey
xxx russian
Seen from Pakistan
Most Popular Users

Elon Musk 
@elonmusk
240.3M followers

Barack Obama
@barackobama
119.2M followers

Donald J. Trump
@realdonaldtrump
111.6M followers

Cristiano Ronaldo
@cristiano
109.7M followers

Narendra Modi
@narendramodi
106.9M followers

Rihanna
@rihanna
97.5M followers

NASA
@nasa
92.1M followers

Justin Bieber
@justinbieber
90.7M followers

KATY PERRY
@katyperry
87.2M followers

Taylor Swift
@taylorswift13
81M followers

Lady Gaga
@ladygaga
72.6M followers

Kim Kardashian
@kimkardashian
69.6M followers

Virat Kohli
@imvkohli
69.2M followers

YouTube
@youtube
68.6M followers

Bill Gates
@billgates
63.6M followers

The Ellen Show
@theellenshow
62.5M followers

CNN
@cnn
61.9M followers

Neymar Jr
@neymarjr
61.9M followers

X
@x
60.9M followers

Selena Gomez
@selenagomez
60.3M followers