Top Tweets for #Cartogram

Sharing a rounded 1M-pop gridded #cartogram based on estimated 2025 #population, totaling 342 units. It's not easy to balance recognizable state shapes with accurate adjacencies. In #LEGO form, I also added cities in 1M-pop increments. Which of the two styles do you prefer? 🟨🟡


@tonfvandijk Geografisch correct maar demografisch volstrekt misleidend. De Hond weet dat een dergelijke kaart een vertekend beeld geeft als het om electorale steun gaat. Zijn keuze om geen #cartogram(gevormd naar bevolkingsaantal) te gebruiken maakt dat journo's als Ton F. rare dingen zeggen


#30DayMapChallenge Day 18 (3D): Sharing this physical #LEGO #cartogram of #USPresidentialElection 2024, with a 3D rendered graphic. View full images: https://t.co/jgTmWKkWVb


For what it’s worth: an alternative view on the 2024 U.S. Election Map 🗳️
This map scales states by electoral weight, preserving the U.S. shape for recognition. Voronoi-based shapes within each state show exact elector counts.
#Election2024 #DataViz #Cartogram #ElectoralCollege


Check out my new post on creating cool cartograms in ggplot!
https://t.co/NVgWAGDKOP
#RStats #ggplot2 #cartogram #Map 🗺️

Short Explanation: The animation represents a "Continuous Area #Cartogram" algorithm, which warps the map so that the area is proportional to some value - in this case population.
Here's an improved animation, with the population labels.
#SriLanka

New Post: Non-contiguous Cartograms
A type of Cartogram where the regions are resized based on a numerical variable, while borders’ shapes are preserved and not connected.
https://t.co/kpREwAasIE
#Dataviz #DataVisualization #Cartogram #Maps #DataMaps
New post: Dorling Cartograms
A Cartogram variation where each geographic region is a circle, sized in proportional to a data value.
https://t.co/ohrtHgr8x8
#dataviz #datavisualization #datamap #map #cartogram

New Post: Cartograms
A data map that distorts the geometry of geographical regions in proportion to the data value associated with that region.
https://t.co/T9TDXtFlb5
#dataviz #datavisualization #mapping #datamap #cartogram


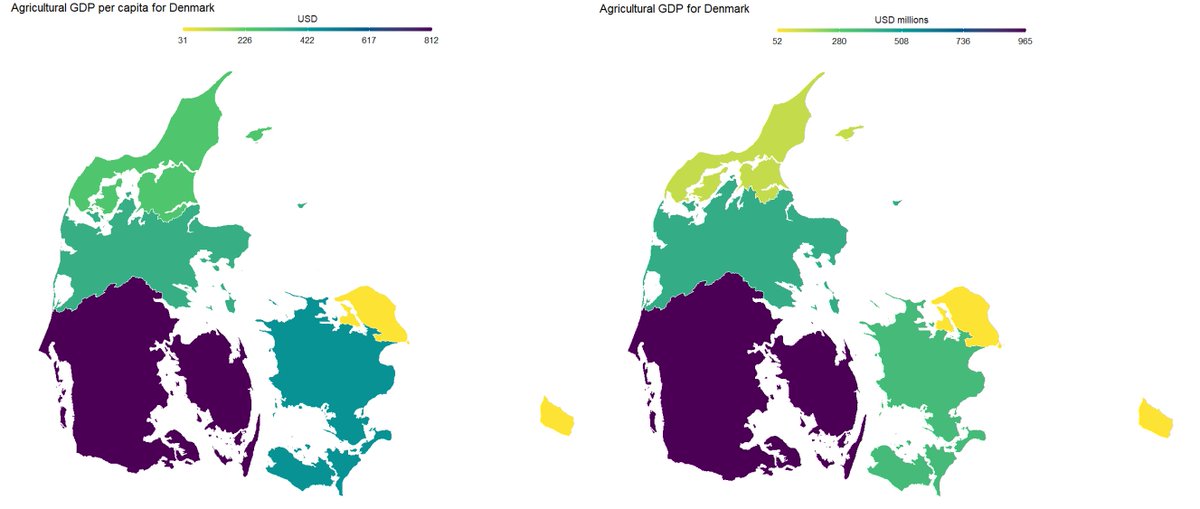
🎉 Excited to mark 1 year of incredible content on my #mentor @milos_agathon 's YouTube channel! 🎉
To commemorate this #milestone, I've created captivating #cartogram maps 🗺️ highlighting agricultural #GDP in France 🇫🇷, Austria 🇦🇹, Germany 🇩🇪, Sweden 🇸🇪, and Denmark 🇩🇰
#maps


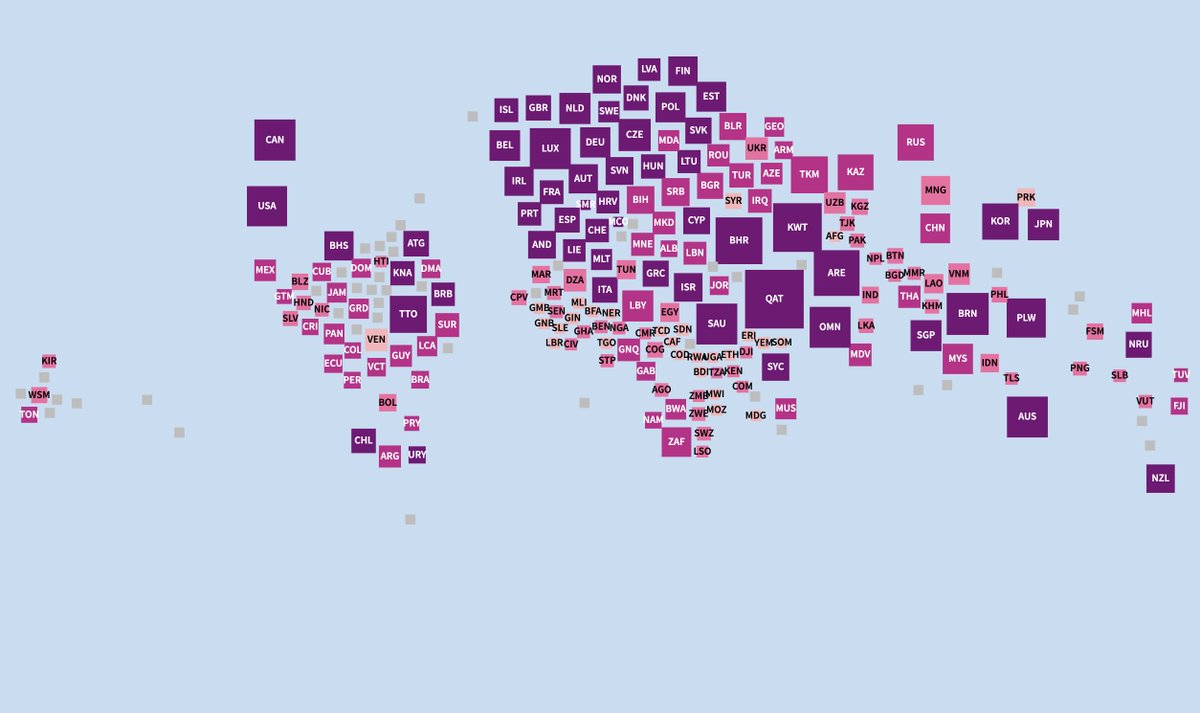
A population-weighted #cartogram of countries holding some form of #elections in 2024.
That's a decent size of the global population voting this year. Is anyone tracking how much of #climatechange is on the agenda?
#dataviz #stataviz


#30DayMapChallenge 2023 Day 28: Is this a chart or a map?
Live: https://t.co/EtQpaNU2VM
Data: ANCPI, BEC, Alegeri 2019
#D3js #cartogram harta #demers alegeri #Romania


#30DayMapChallenge, Day 28 - Is this a chart or a map?
Definitely more of a chart in my view, but the #geofacet package is probaby my favourite in #rstats and produces small multiples of charts arranged like a #cartogram

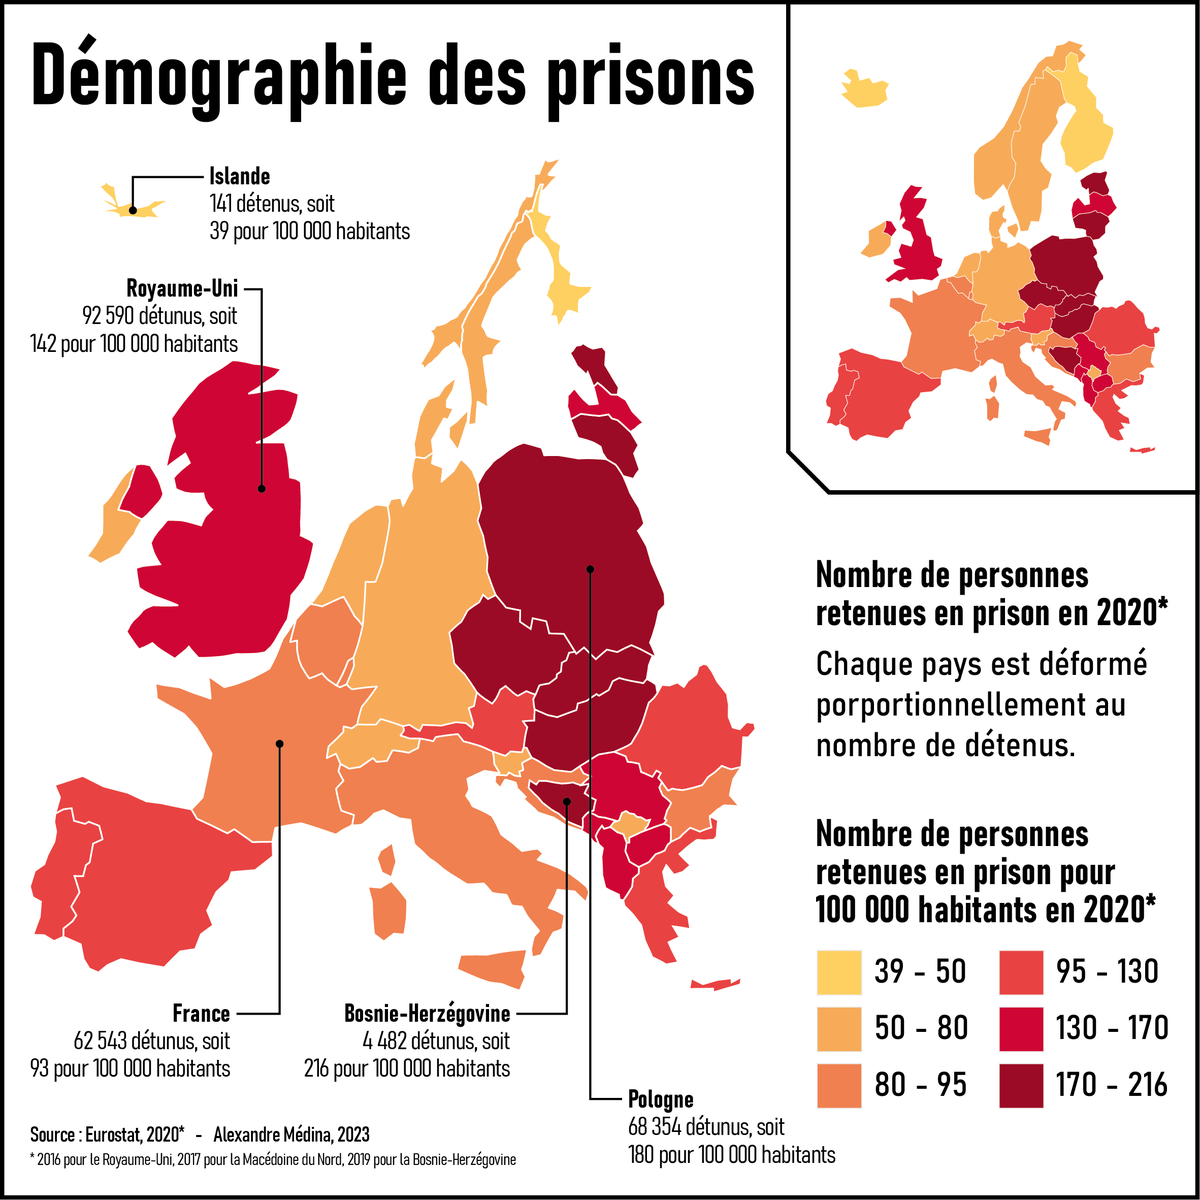
#30daymapchallenge JOUR 13 - "Choroplèthe" 🎨
Carte choroplèthe + anamorphose.
#carte #map #cartogram #anamorphose #europe #prison
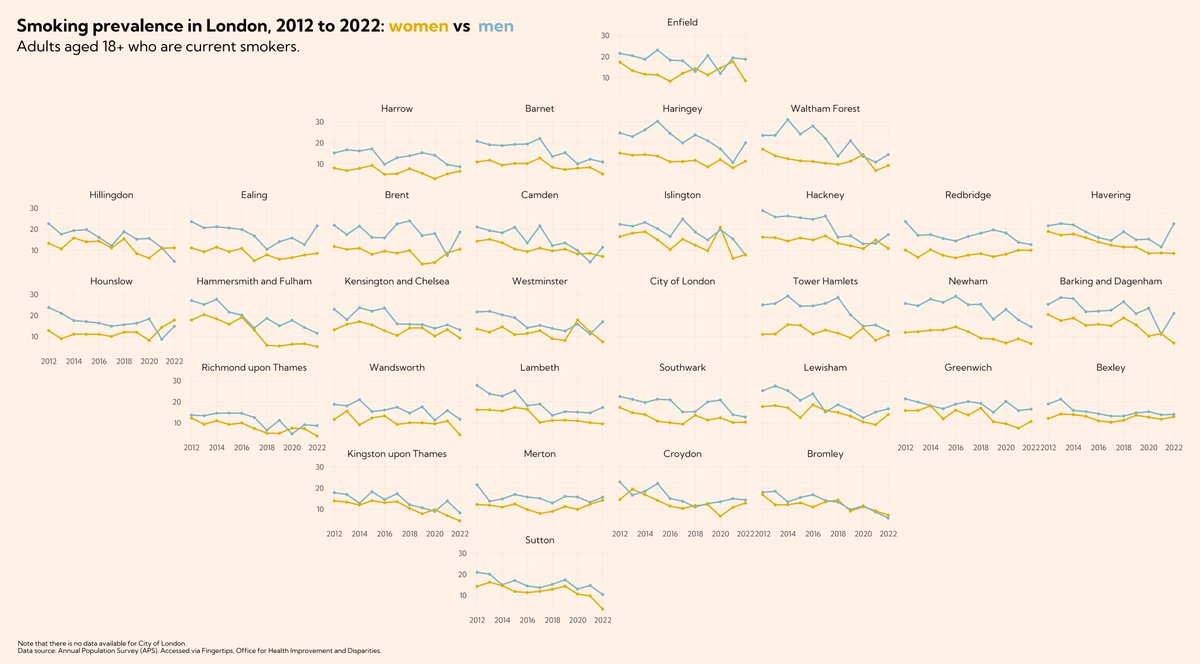
#30DayMapChallenge Day 9: Hexagons.
Been trying to work on a new map-chart template in #rstats using the geogrid package to make a hexagon #cartogram of sub-ICB locations (excuse the rubbish names - not mine!) and classintervals package for jenks, and data from #fingertipsR

The #cartogram #Stata shapefiles are up on #GitHub:
https://t.co/qeuYDw7pS4
The #WORLD file can be merged on ISO3 country codes
The #USA file can be merged on FIPS or 2-letter state codes.
The folder also contains cleaned #Eurostat NUTS 2021 3M 3035proj layer, both as shapefiles and Stata files.
Please try these out right now!! And post some maps...


Adding two more #Stata #cartogram #maps for the #USA. The geography is based on the #NYTimes version.
Data is extracted from the #ACS 2021 population estimates using the #getcensus package. Right map uses the new version of #bimap.


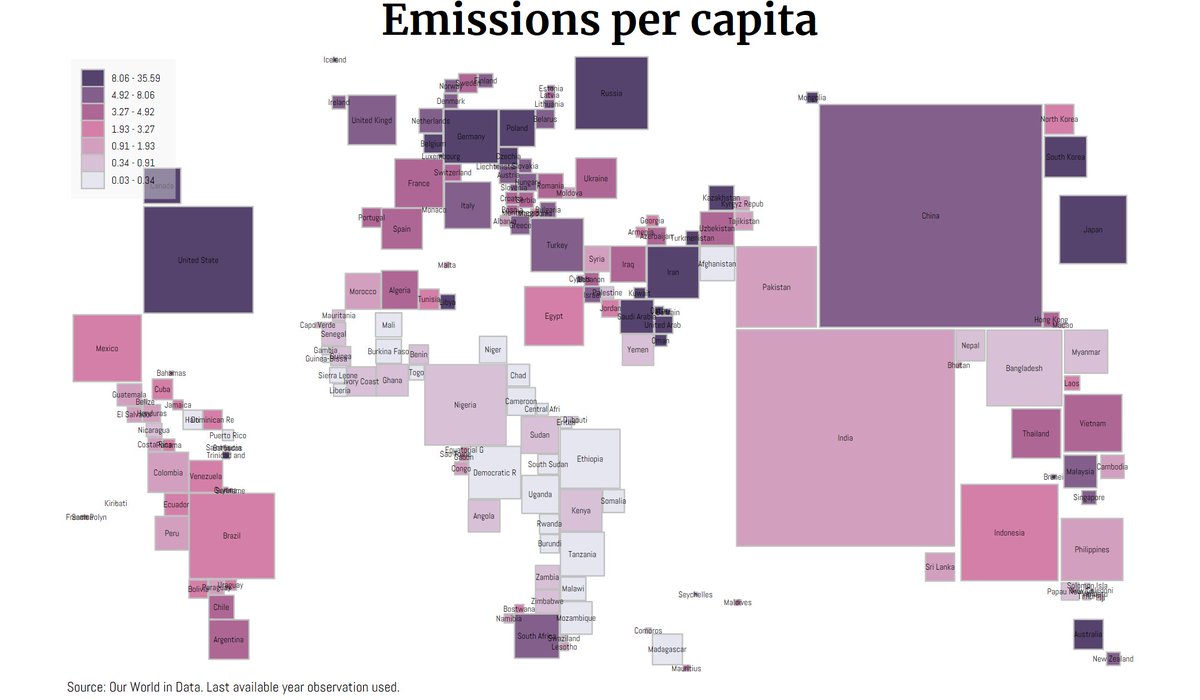
#30daychartchallenge Day 23 Tiles
Square #cartogram, coded in vanillaJS + #d3js, showing per capita CO2 emissions, colored by income level (forgot to add legend 🙈 but you can refer to the previous scatter plot)
🔗
https://t.co/EzmVE0Kf8Z
Last Seen Hashtags on Sotwe
Trends for you
Most Popular Users

Elon Musk 
@elonmusk
240.1M followers

Barack Obama
@barackobama
119.3M followers

Donald J. Trump
@realdonaldtrump
111.6M followers

Cristiano Ronaldo
@cristiano
108.9M followers

Narendra Modi
@narendramodi
107M followers

Rihanna
@rihanna
97.3M followers

NASA
@nasa
92.1M followers

Justin Bieber
@justinbieber
90.6M followers

KATY PERRY
@katyperry
86.8M followers

Taylor Swift
@taylorswift13
80.6M followers

Lady Gaga
@ladygaga
72.1M followers

Kim Kardashian
@kimkardashian
69.4M followers

YouTube
@youtube
68.6M followers

Virat Kohli
@imvkohli
68.5M followers

Bill Gates
@billgates
63.4M followers

The Ellen Show
@theellenshow
62.5M followers

CNN
@cnn
61.9M followers

Neymar Jr
@neymarjr
61M followers

X
@x
60.9M followers

CNN Breaking News
@cnnbrk
59.9M followers