Top Tweets for #Dataplotly

Plotly: crea gráficos interactivos con datos espaciales https://t.co/4bkg8feWa0 #DataPlotly #matplotlib #Plotly #Python

📊 Fin de notre série #QGIS + #DataPlotly sur https://t.co/wfWe7F7vZj !
📄 1. Intégrer des graphiques dans un Atlas PDF
📈 2. Construire un tableau de bord interactif dans QGIS
🔗 https://t.co/Inmpuxg4h5
#SIG #DataViz #OpenSource

Plotly: crea gráficos interactivos con datos espaciales https://t.co/4bkg8feWa0 #DataPlotly #matplotlib #Plotly #Python
Plotly: crea gráficos interactivos con datos espaciales https://t.co/4bkg8feWa0 #DataPlotly #matplotlib #Plotly #Python

Day 6 #30DaysofDQ3x2nd Part 2 Ex#2 you learn to work with tables. Use SQL to query features by attributes, query by location, add/remove fields, calculate values, use case statements, generate histograms, create charts via #DataPlotly & set up conditional table formatting #QGIS
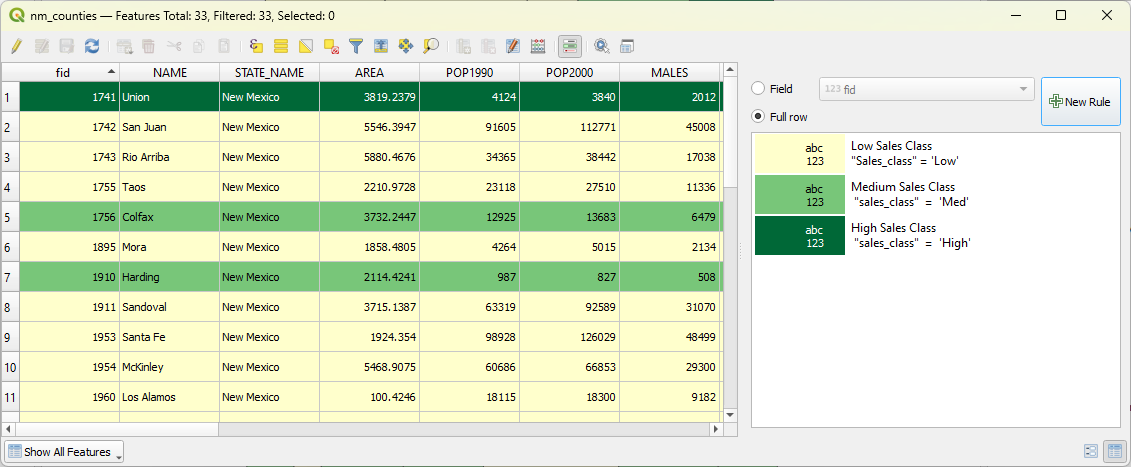


And the legend of the resulting #DataPlotly pie chart can now be easier matched with the legend of a layer in #QGIS 3.26+! https://t.co/aAkK0SOIpv
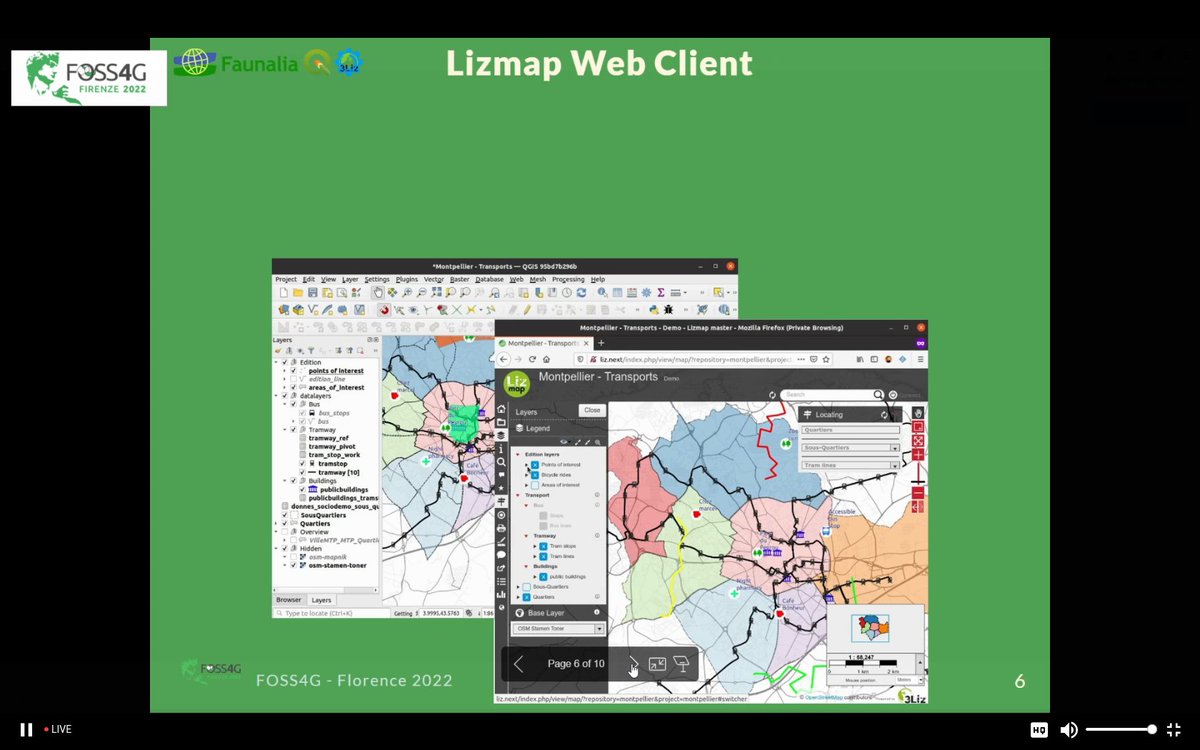
👉L'intervento di @ghtmtt al @foss4g , fatto insieme a @etrimaille di #3Liz ha evidenziato delle novità in campo #DataPlotly in #Lizmap, tra le quali molti miglioramenti e nuovi stimoli per continuare a sviluppare nuove features.

Matteo Ghetta, Etienne Trimaille - 'Dataviz in QGIS and on the web, at #FOSS4G2022.
Talk: https://t.co/acjeM94RYe
#OSGeo #FOSS4G #maps #QGIS #DataPlotly
@ghtmtt @etrimaille


A great result from the #QGIS Contributor Meeting in Firenze: easily use the colours of a layer for the legend of #DataPlotly plugin plots. Thanks a lot @ghtmtt @nyalldawson @etrimaille! #FOSS4G

Loyout tá simples mas o importante é ressaltar consegui fazer o gráfico pelo #DataPlotly no @qgis com as mesmas cores das feições de referencia. A drenagem tá dividida considerando a bacia e a classificação de strahler
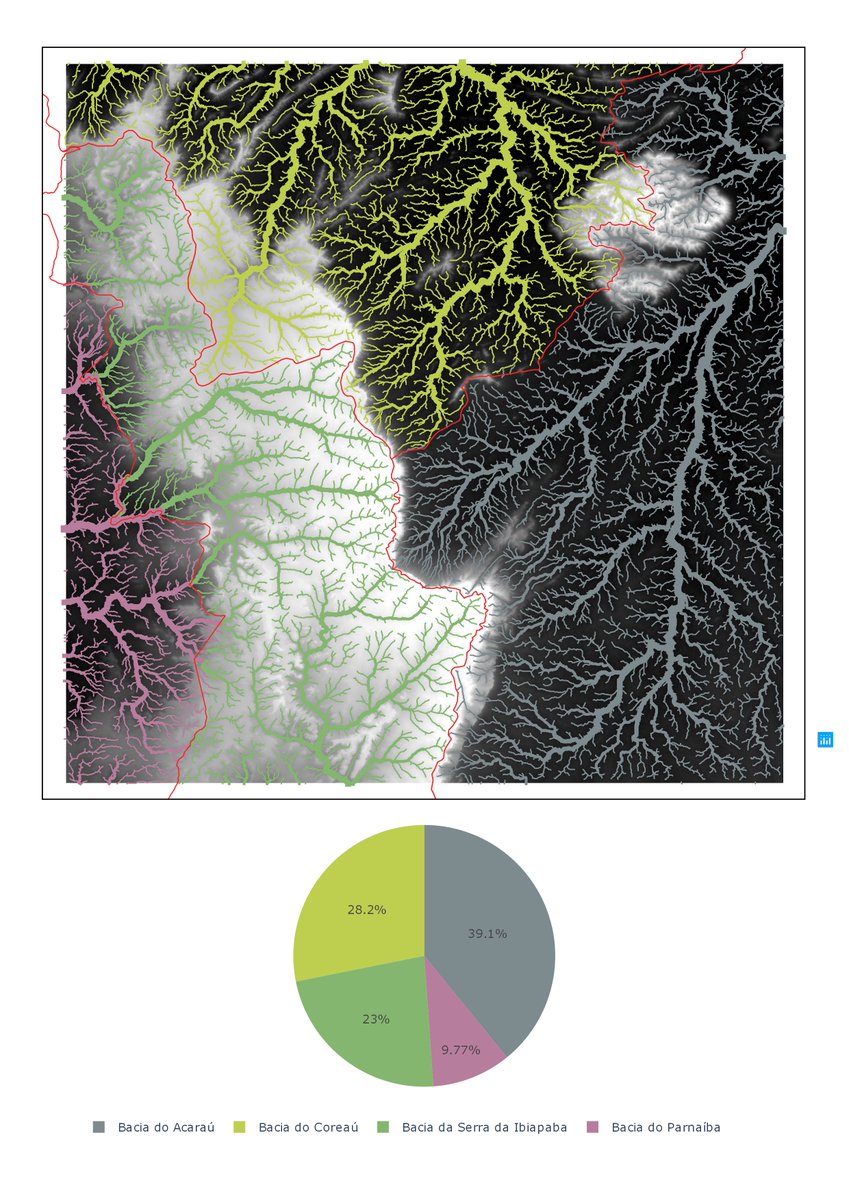
In Chapter 6 on the calculation of the percentage of land cover per subcatchment, we have added the steps to match the colours of the #dataplotly pie chart with the legend of the layer.
5/9

Tutorial showing how to make a simple and dynamic color map with #charts in QGIS by @underdarkGIS
The purpose of this tutorial is to show how to make a design map using #QGIS and #DataPlotly with the use of variables.
Vía #boletínNosolosig
https://t.co/chylpxhqDQ

The tutorial is available, thanks @underdarkGIS for sharing, hosting and her really inspiring work on https://t.co/a8HZ0L4x47 #QGIS #Dataplotly #QuickOSM
Map design with #QGIS and #Plotly with variables for map colors, charts, titles and even SVG #storyset illustrations. Here’s the result! @qgis #Dataplotly


🗺💻 En esta entrada vamos aprender cómo crear gráficas en 𝗤𝗚𝗜𝗦 con el complemento 𝘿𝙖𝙩𝙖 𝙋𝙡𝙤𝙩𝙡𝙮.
Leer más: https://t.co/CknOXk37fD
#SIG #QGIS #DataPlotly #QGIS3

Last Seen Hashtags on Sotwe
NoLimit
Seen from Brazil
正太男孩
Seen from Malaysia
thundr
Seen from Brazil
nolimits video
Seen from United States
成宮仁
Seen from Japan
lowlvltwt
Seen from United States
pejuhinchallenge
Seen from Indonesia
crotdalam
Seen from Indonesia
รับงานสามโคก
Seen from Thailand
nolimit #nolimit #momson
Seen from United States
Trends for you
Most Popular Users

Elon Musk 
@elonmusk
240.3M followers

Barack Obama
@barackobama
119.3M followers

Donald J. Trump
@realdonaldtrump
111.6M followers

Cristiano Ronaldo
@cristiano
109.5M followers

Narendra Modi
@narendramodi
107M followers

Rihanna
@rihanna
97.4M followers

NASA
@nasa
92.1M followers

Justin Bieber
@justinbieber
90.7M followers

KATY PERRY
@katyperry
87.1M followers

Taylor Swift
@taylorswift13
80.9M followers

Lady Gaga
@ladygaga
72.5M followers

Kim Kardashian
@kimkardashian
69.5M followers

Virat Kohli
@imvkohli
69M followers

YouTube
@youtube
68.6M followers

Bill Gates
@billgates
63.6M followers

The Ellen Show
@theellenshow
62.5M followers

CNN
@cnn
61.9M followers

Neymar Jr
@neymarjr
61.7M followers

X
@x
60.9M followers

Selena Gomez
@selenagomez
60.2M followers